


Markets are testing defining technical levels for the second half of 2026, with several major assets approaching critical confluence zones as geopolitical developments and shifting Federal Reserve policy expectations drive risk sentiment.
Headlines surrounding US-Iran negotiations helped revive risk-on sentiment, which gained further support after the latest US Non-Farm Payrolls report surprised to the downside and pushed expectations for a September Fed rate hike further below the 50% threshold.
Attention now turns to this week's US CPI report, which could help define the next phase of Fed monetary policy expectations and confirm either breakouts or rebounds from the technical levels currently in focus.
Several major markets are approaching critical technical levels as momentum becomes increasingly stretched:
- Dow Jones: Extended its rally toward the 54,700 record high and the upper boundary of its rising channel dating back to 2022, while monthly momentum is flashing overbought conditions last seen in 2018. [Dow Analysis]
- S&P 500: Extended its rally toward the 7,790 resistance zone, with momentum entering overbought territory across both daily and hourly time frames.
- Gold and silver: Broke above their year-long descending resistance structures and June-August consolidations, while daily momentum has reached overbought conditions last seen in January 2026.
- US Dollar Index (DXY): Pulled back toward rising support near 99.30, a key level defining the index's bullish 2026 structure.
- USD/JPY: Continues to hold a bullish rebound from the 155 area, highlighting underlying dollar resilience despite weakness in the latest US employment report and reflecting persistent safe-haven demand. USDJPY analysis
- Bitcoin: Remains subdued despite broader market optimism, trading within its extended June-August 2026 consolidation and below the key $68,000 resistance level.
Together, these markets are approaching technical inflection points just as US CPI, Fed expectations, and geopolitical developments converge as potential catalysts.
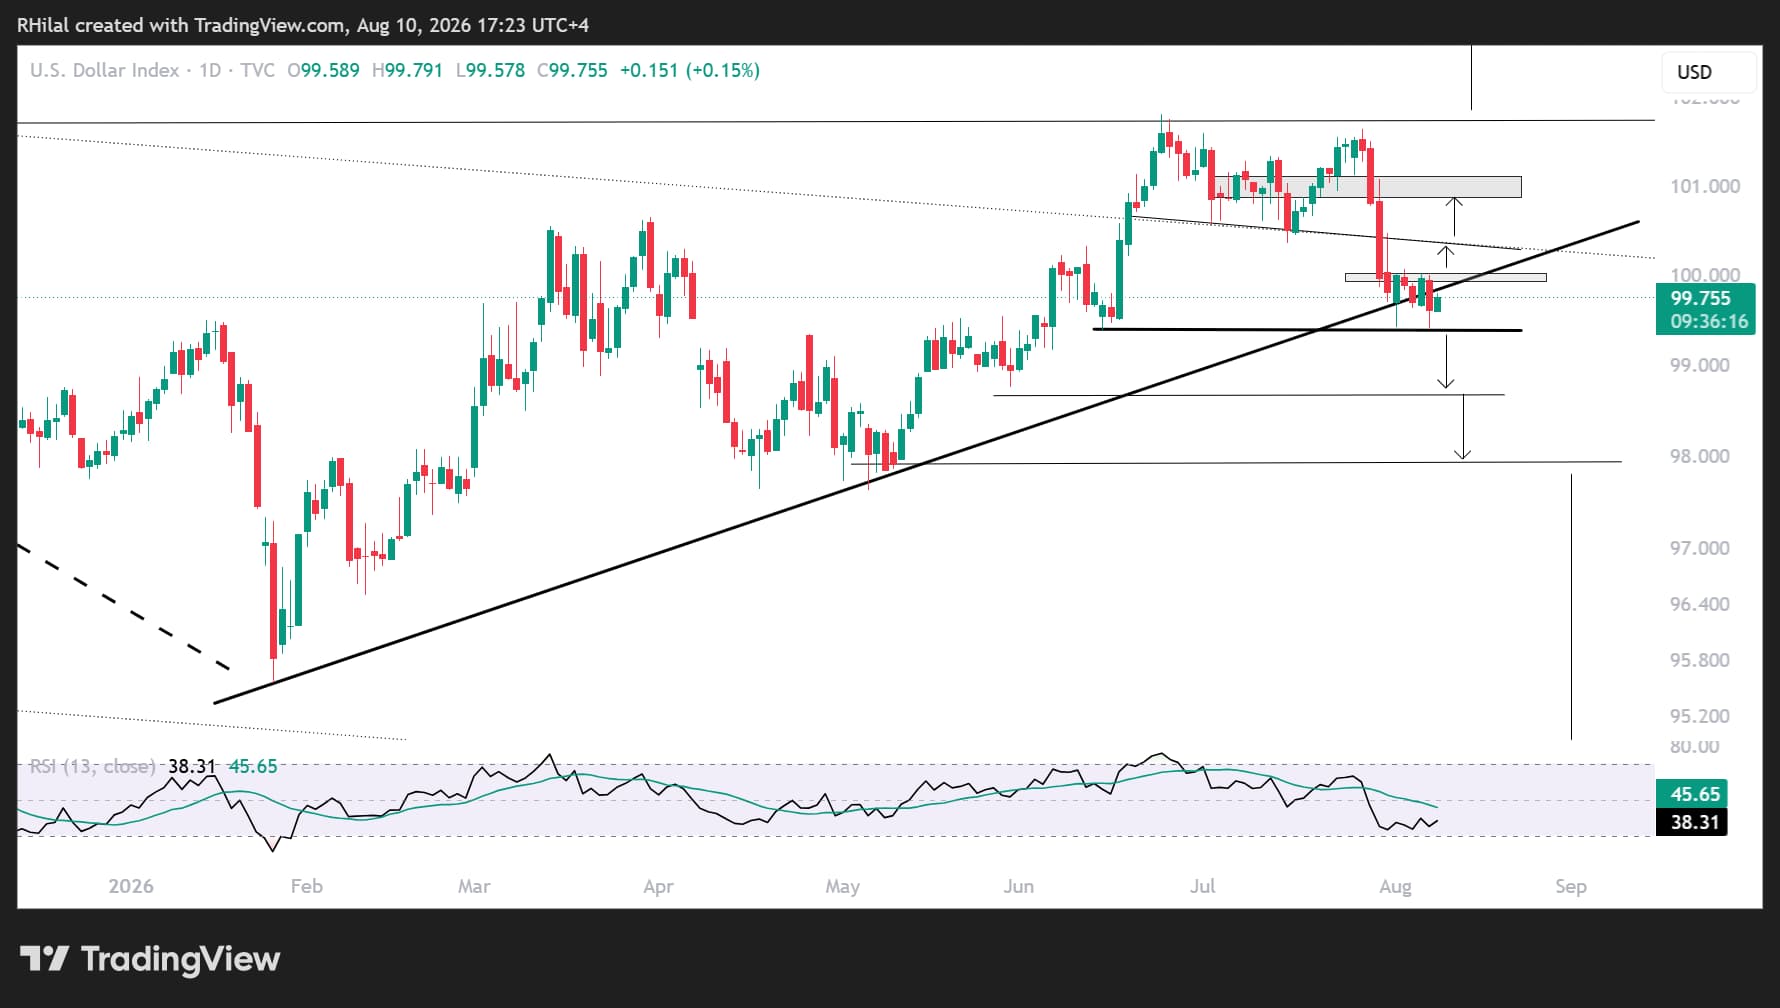
DXY Outlook: Daily Time Frame – Log Scale
Source: TradingView
The latest pullback in the US Dollar Index developed after DXY stalled just below the critical 101.80-102.00 resistance zone, which remains the key barrier for confirming another bullish breakout.
Despite the decline, several technical factors continue to support the broader 2026 bullish structure:
- The ascending trendline connecting the higher lows established throughout 2026 remains intact.
- The 99.30 level, representing the 38.2% Fibonacci retracement of the 2026 advance, continues to provide important technical support.
- Daily momentum has moved into oversold territory last seen in January 2026, increasing the potential for another rebound if support holds.
As long as DXY remains above the broader 99.30-100.30 support zone, the 2026 bullish outlook remains intact.
A confirmed break below 99.30 would weaken that structure and increase bearish pressure toward the 98.60-98.00 region, near the 61.8% Fibonacci retracement of the 2026 advance.
For now, the daily chart suggests that recent dollar weakness remains a correction within the prevailing 2026 uptrend rather than confirmation of a broader bearish reversal—a view that remains consistent with the longer-term monthly structure.
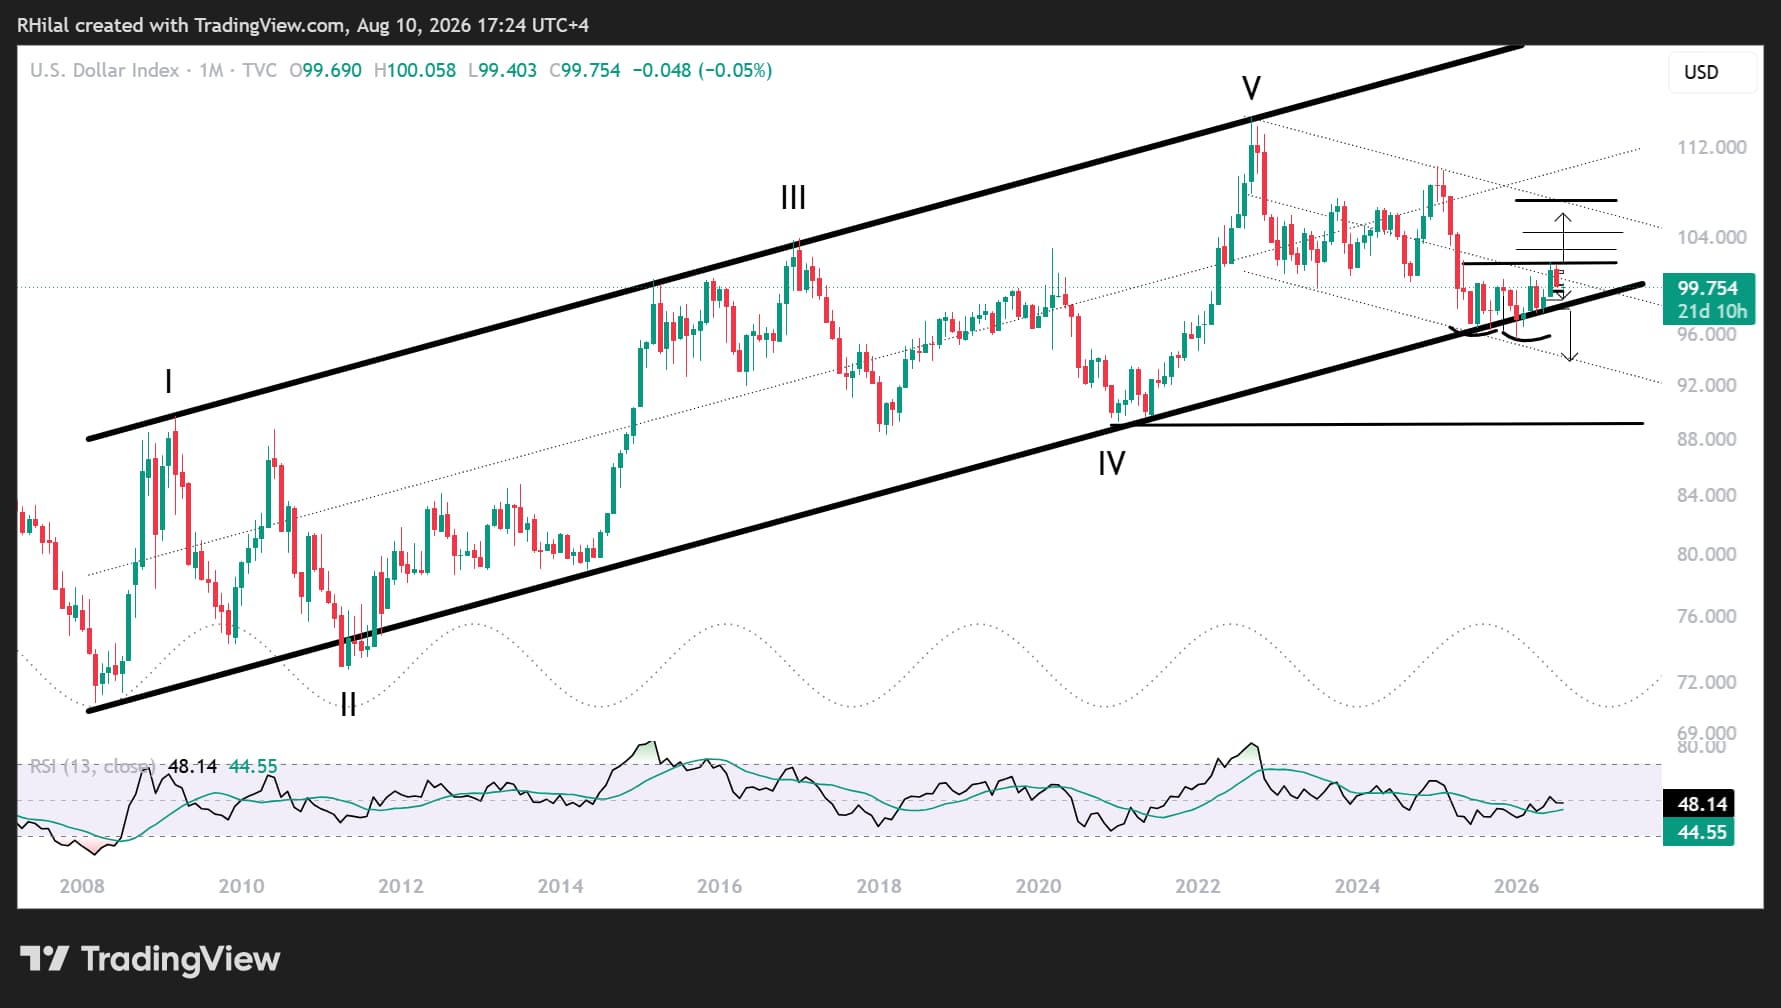
DXY Outlook: Monthly Time Frame – Log Scale
Source: TradingView
The monthly chart continues to reinforce the US Dollar Index's broader bullish structure through several important technical developments:
- An ascending channel dating back to 2008 continues to define the Dollar Index's long-term structure. Its lower boundary, near the 95-97 zone, represents the next major support area should DXY close below 99.30 and invalidate the current 2026 bullish setup. A test of this region could either trigger another long-term rebound or signal the beginning of a broader structural decline.
- DXY is currently in pullback mode after testing a significant technical confluence that includes:
- The neckline of a potential double-bottom formation positioned between the long-term ascending channel from 2008 and the descending channel in place since 2022.
- The midpoint of the 2022-2026 descending channel.
- A multi-year support and resistance zone that has repeatedly influenced price action since 2023.
A monthly close above 102.00 would strengthen the bullish outlook and expose the next resistance levels at 102.80, 104.50, and ultimately 107.00, with the latter aligning with the upper boundary of the descending channel in place since 2022.
Such a breakout could coincide with renewed geopolitical tensions, stronger inflationary pressures, or a more hawkish shift in Federal Reserve expectations. It could also increase downside pressure across major currencies and precious metals, potentially driving another corrective phase before longer-term support levels come back into focus.
As long as Middle East tensions persist and crude oil remains supported within or above the $70-$80 per barrel region, upside risks for the dollar are likely to remain elevated.
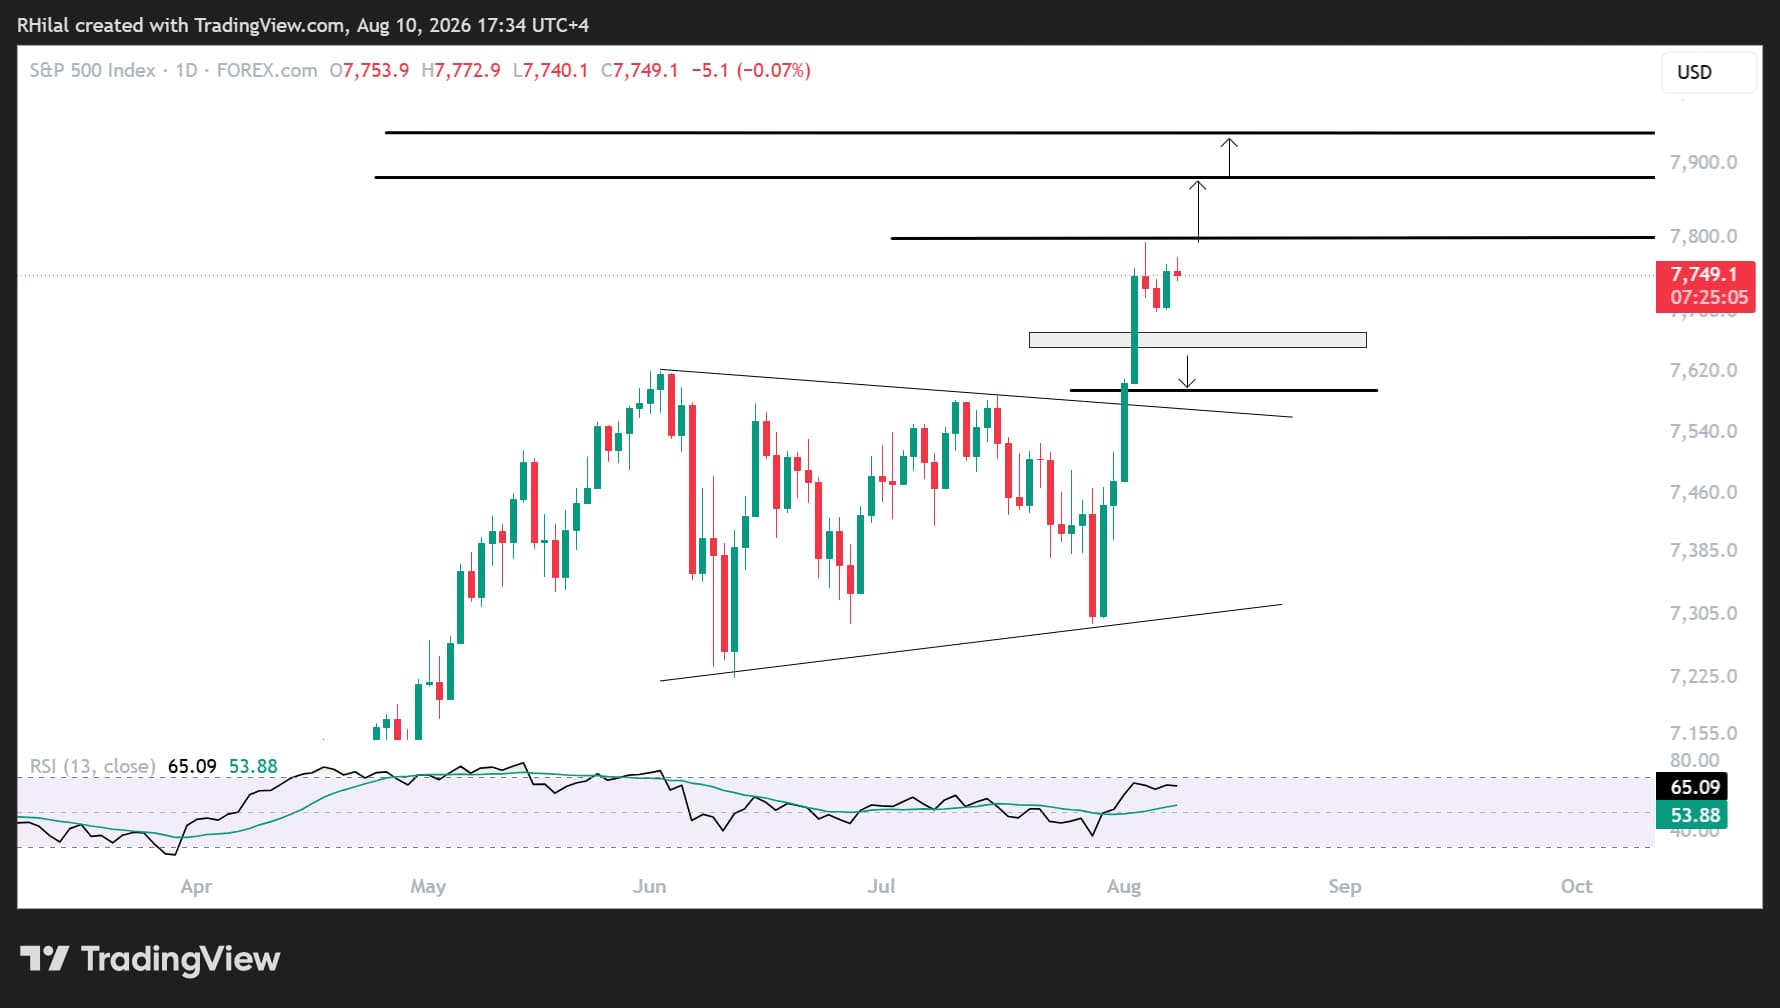
S&P 500 Outlook: Daily Time Frame – Log Scale
Source: Trading View
From a daily time frame perspective, the S&P 500 is testing the 7,790-7,800 resistance region, aligning with the 138.2% Fibonacci extension of the June-July cycle.
A sustained breakout above this zone would expose the 161.8% Fibonacci extension near 7,880, reinforcing the broader risk-on trend and opening the door for another extension into record territory.
However, stretched momentum conditions leave the index vulnerable to short-term consolidation or a corrective pullback.
On the downside, a break below the 7,700-7,650 support zone would increase the risk of a deeper correction toward 7,600. This region aligns with the upper boundary of the June-July consolidation and the 38.2% Fibonacci retracement of the July-August advance.
A successful hold around 7,600 could provide another dip-buying opportunity and preserve the broader bullish structure. Conversely, a sustained break below this confluence would strengthen the risk-off case and increase the probability of a deeper correction.
With DXY testing defining 2026 support while the S&P 500 approaches record resistance, this week's US CPI report could prove decisive in determining whether the second half of 2026 begins with another extension of the risk-on trend or a broader corrective phase.
Written by Razan Hilal, CMT
Follow on X: @Rh_waves






