


The US Dollar pullback found support at a big spot last Thursday and Friday, at the Fibonacci level of 98.98. And so far this week, bulls have been pushing with another breakout this morning to re-test the major resistance zone running from 100-100.22. Tomorrow’s NFP report will likely have sway on the matter, but there’s also the counter-part component to consider, as EUR/USD is fast approaching another re-test of the vaulted psychological level at 1.1500.

The winds of change are afoot across macro markets: Equities are pulling back and crypto continues to show light symptoms of ‘melt down.’ Even gold hasn’t been able to hold a bid for long, and as I shared in yesterday’s webinar, the fact that these hot markets have all been showing signs of pullback around the same time seems to suggest that we’re seeing more of a squaring up type of theme as we finally get some US government data following the prolonged shutdown.
We’ll find out more tomorrow as we get the NFP report and while the data is old and rather stale, it’ll still be important and we’re seeing ‘why’ as markets coil ahead of that release.
In the US Dollar, and this is again a topic I encountered in yesterday’s webinar, there’s likely a few different forces at work. An obvious one is the scaling back of expectations for a December rate cut, and that syncs well given that both stocks topped and the US Dollar started to see the rally heat up around the last FOMC meeting on October 29th.
But – markets are still fully expecting another 75 bps of cuts by the end of next year and that’s something that can change quickly as Fed-speak of late has sounded a bit more cautious. This is something that could certainly compel another shot of USD-strength and, potentially, a breakout from the key resistance zone that’s held bulls at bay for almost four full months now.
That zone even has some relation to last year, when 100.22 set the low when the Fed cut rates in September of 2024. That support stalled the move, with sellers unable to stretch down to 100 and that then led into a massive bullish reversal in Q4 trade. That setup showed a short-term falling wedge, very similar to the longer-term formation that’s built over the past six months in DXY.
US Dollar Daily Chart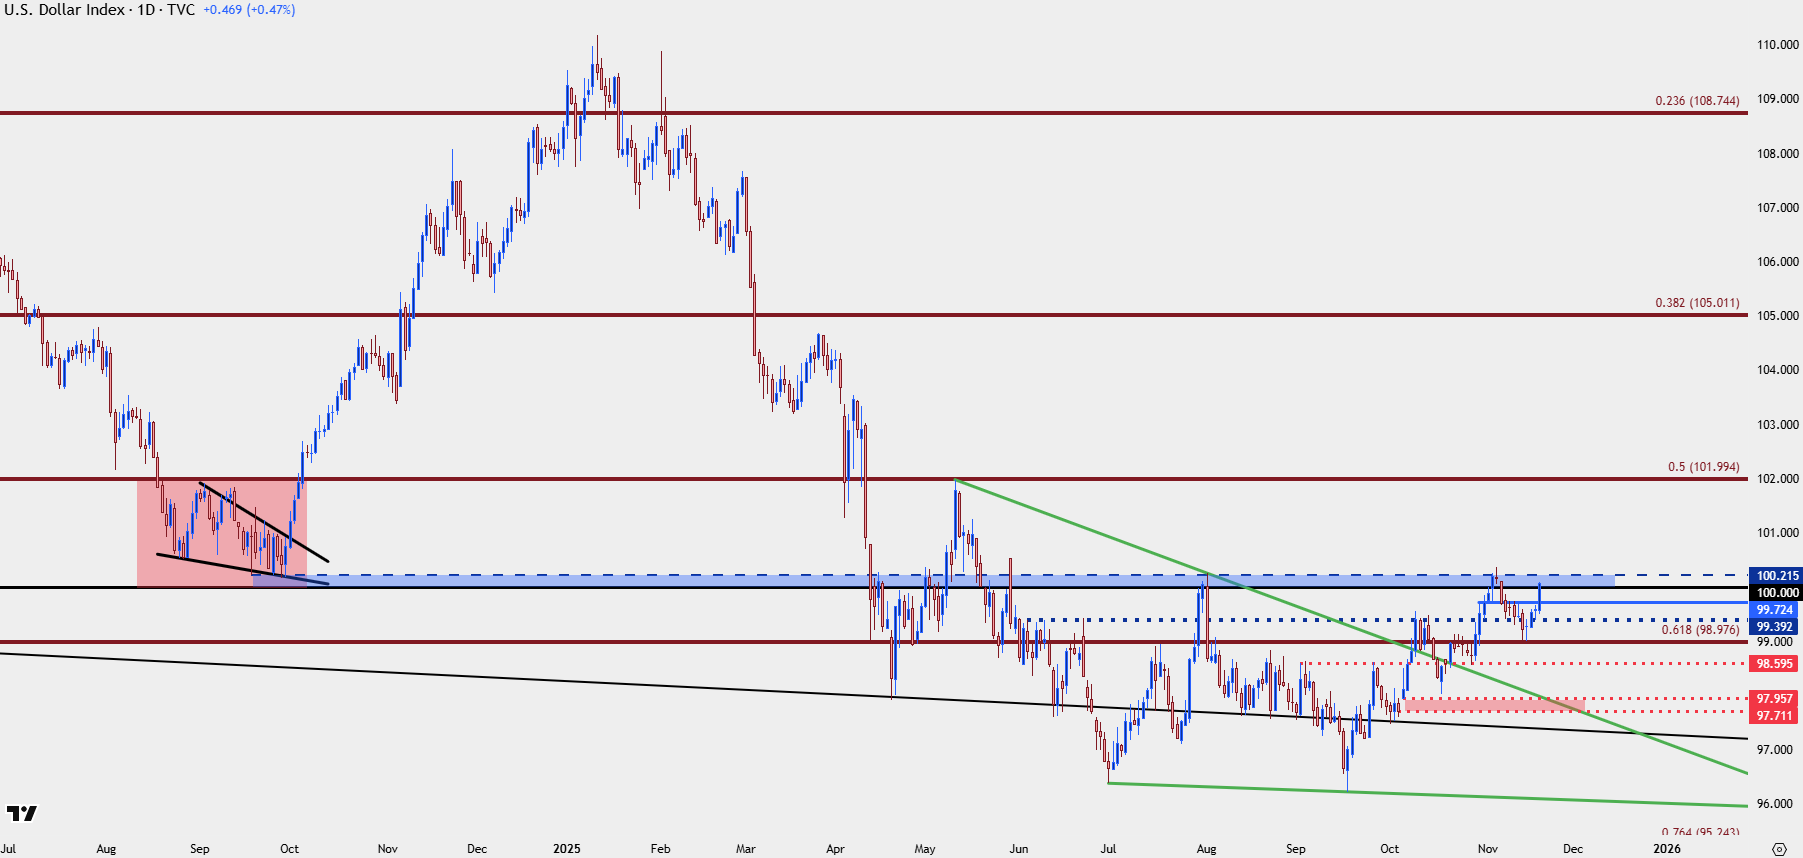
Chart prepared by James Stanley; data derived from Tradingview
USD Following a Similar Pattern
The current low in the US Dollar was set on September 17th, the day that the Fed started cutting rates this year. Interestingly, this echoes what happened last year, albeit with some different formatting. The USD sold off into the Fed’s first cut in September, with DXY setting a low at that announcement. And then as we traded into Q4, even with a Federal Reserve still cutting rates, the US Dollar rallied in a very big way.
Notably, Jerome Powell called this year’s September move a ‘risk management rate cut.’ That triggered a series of higher-highs and higher-lows, with another fresh high printing after the Fed’s next rate cut on October 29th. That rally eventually ran to the top of the 100-100.22 resistance zone, at which price began to relax.
Last week was mostly pullback – all the way until 98.98 came into the picture, and that set the low for two days before bulls can get back in the driver’s seat.
But, from that deduction we can draw a relationship, where a ‘less dovish’ Fed has helped to bring USD-strength, and while the recent rally from 98.98 goes along with odds for a December cut whittling down to a coin flip, there’s still wide expectation for more rate cuts next year.
In yesterday’s webinar, it was right around 75% for another 75 bps in cuts in 2026. As of right now that probability is 74.2% for another 75 bps in cuts next year.
This can be catalyst for USD-strength, although there’s another component I’ll speak of in the next section, and this puts a lot emphasis on upcoming data out of the United States as any narrowing of rate cut expectations for next year can further push USD-strength, squeezing Dollar shorts, and showing a similar backdrop as what played out last year.
USD Since Rate Cuts Began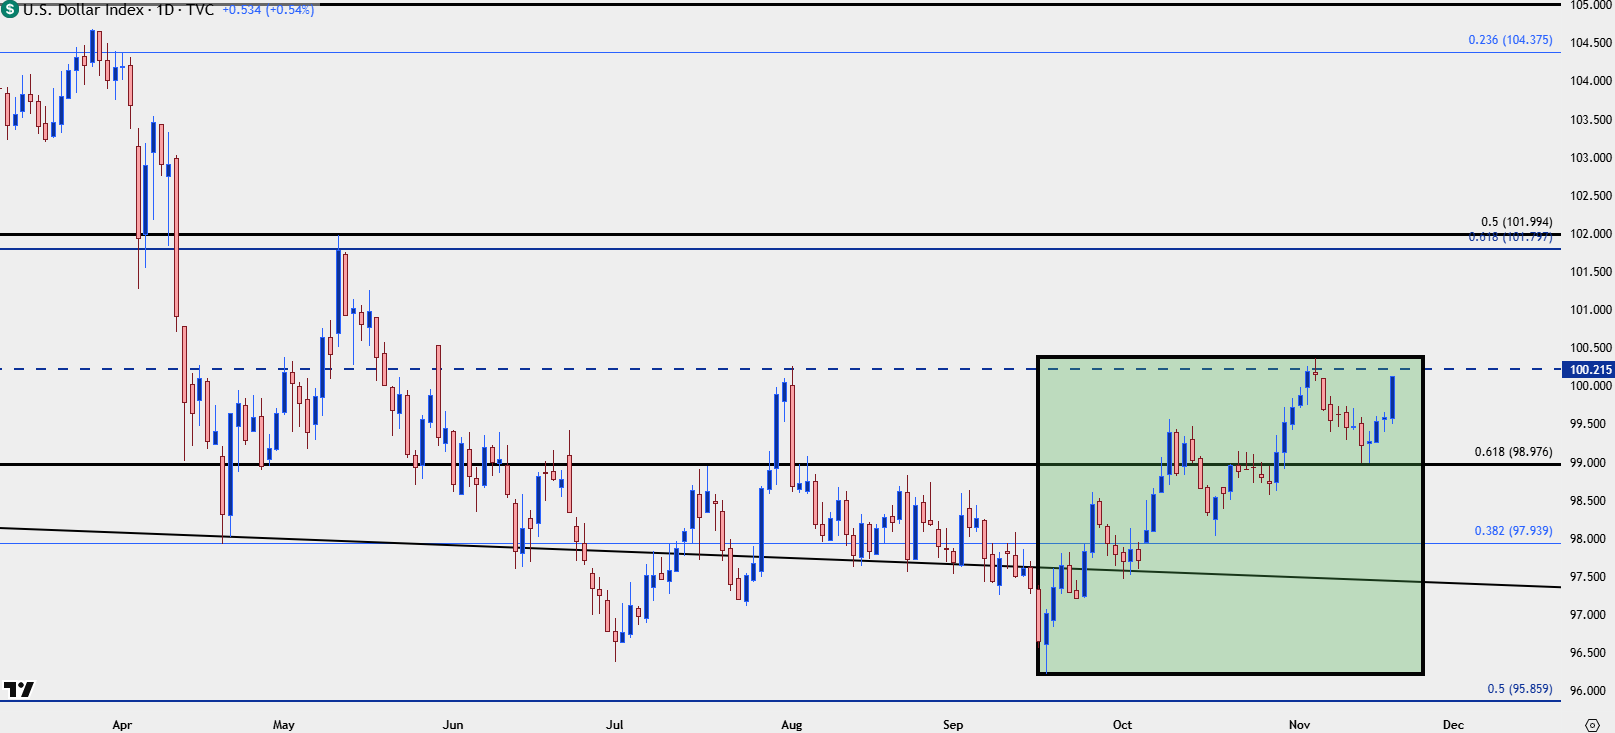
Chart prepared by James Stanley; data derived from Tradingview
EUR/USD 1.1500
When we had that USD resistance test a couple of weeks ago at 100.22, with DXY technically setting a fresh four-month-high, I warned against chasing the move in the webinar just before the test.
My rationale then drew back to counterparts, and specifically the largest component of the DXY basket with the Euro, which is 57.6% of the DXY quote.
At the time EUR/USD had just pushed below the psychological level at 1.1500, and historically speaking, that’s a price that’s brought some drama for the pair. I didn’t like the prospect of a clean break and run below 1.1500, especially as DXY was at a fresh four-month high. Both markets then pulled back and continued to do so into late trade last week.
So, if we are to get a USD breakout here, it seems we’re probably going to need some participation from the Euro, with EUR/USD nearing another test of the 1.1500 handle.
And, perhaps related, we’re going to need the Japanese Finance Ministry to relax a bit as they’ve already started to grumble about intervention, and the USD/JPY pair is in the midst of a strong breakout there. I’m looking to 157.50 or 158.00 for that next intervention comment, although I’m expecting that to be a veiled threat more than an actual sign of intervention.
EUR/USD Daily Chart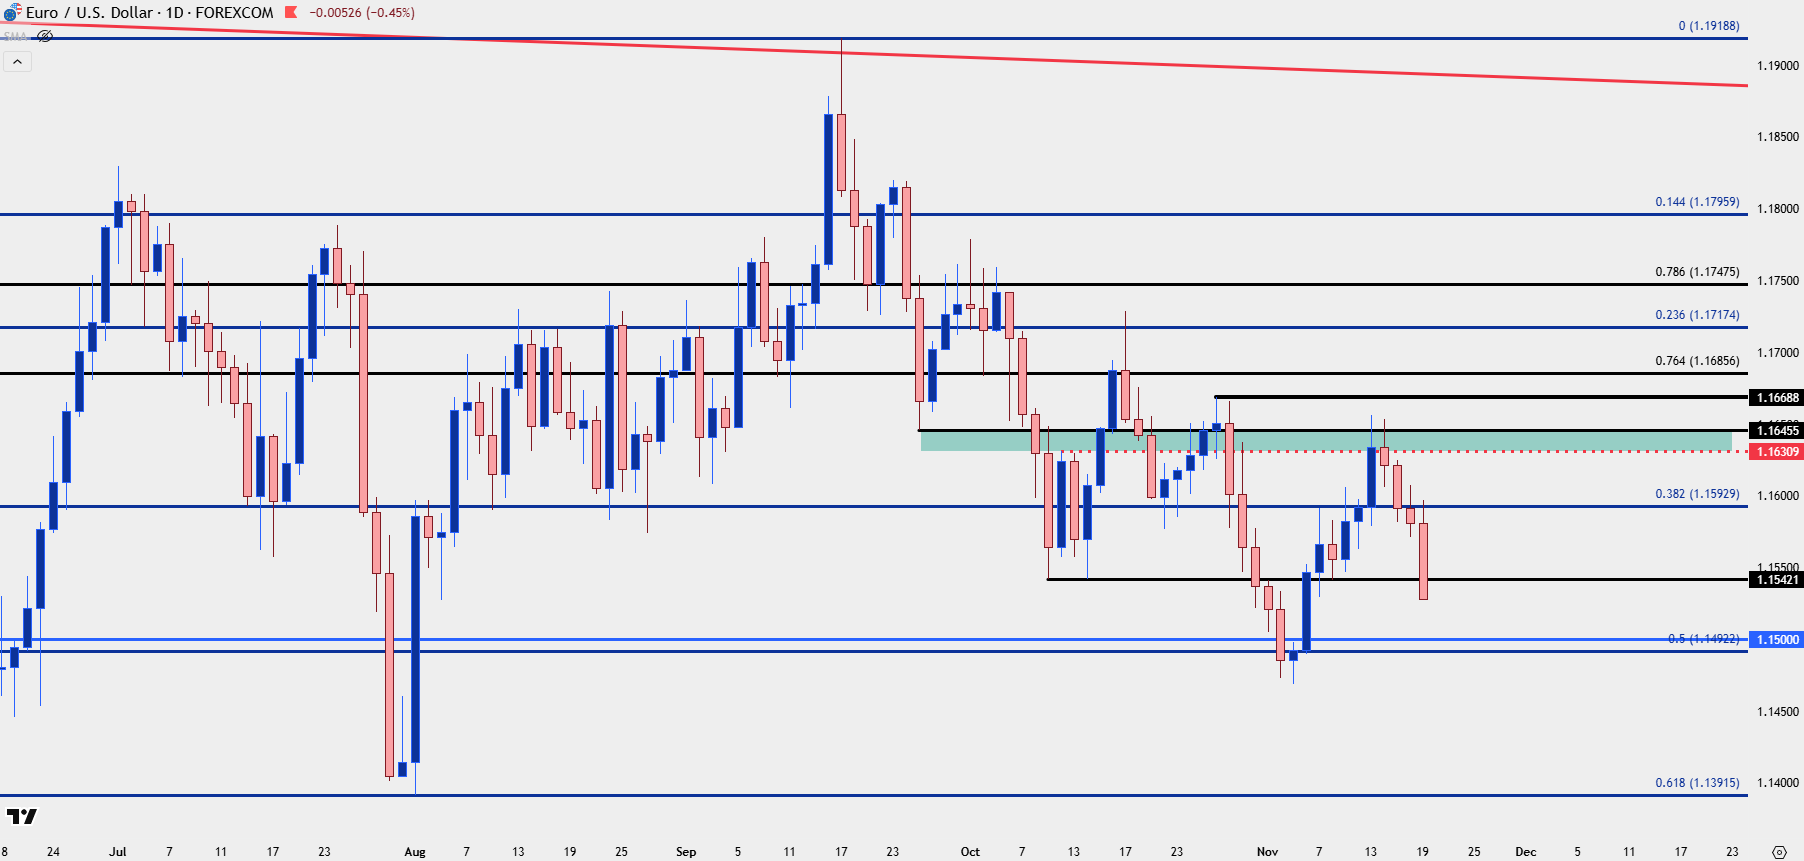
Chart prepared by James Stanley; data derived from Tradingview
--- written by James Stanley, Senior Market Analyst, Global Macro






