Markets were very eager to pile into the de-escalation narrative, and even the faintest hint that the US Hormuz blockade might be nudging things back toward talks has been enough to put crude oil, and the dollar, under a fair bit of pressure, providing relief for risk assets. Trump’s remark that Iran had reached out to restart negotiations only added fuel to the move, prompting another round of dollar selling. From here, though, you’d need to see something more concrete on a lasting ceasefire to drag the dollar all the way back to pre-war levels. That said, with the S&P 500 already back there, it wouldn’t be a huge surprise if other markets start to follow suit. The USD/JPY forecast is in focus with the bears eyeing a drop as the US dollar and bond yields ease back.
Could USD/JPY drop to pre-war levels?
If we do get clearer signs that a proper ceasefire is coming together, you could see the USD/JPY push below 158.00 and drift back toward those pre-war levels of 156.00ish. It might sound a touch counterintuitive given energy prices would still be relatively elevated, but with the Bank of Japan other central banks sounding more hawkish than the Fed, the broader case for a softer dollar against its peers still holds.
Softening US economy could weigh on USD/JPY forecast
On the macro front, last week’s data painted a softer picture of the US economy. Strip out the energy shock, and there’s a growing sense the Fed may have room to ease policy again down the line. Take consumer sentiment, for instance. The University of Michigan’s latest read showed confidence dropping to a record low, with the preliminary April index tumbling to 47.6 from 53.3. That’s a pretty stark move, likely reflecting the knock-on effects of the US-Israel-Iran tensions and renewed inflation worries.
That said, there’s a decent argument that this latest bout of inflation proves more temporary than the last. Yes, higher gasoline prices have pushed up headline numbers, but underlying inflation looks a bit more contained than feared. Demand isn’t exactly roaring, and firms don’t seem to have the same pricing power they did back in 2022, which should help keep a lid on things.
Will the BoJ hold fire for now?
Meanwhile, the Bank of Japan Governor Kazuo Ueda has hinted that a rate hike at the 28 April meeting is unlikely, which has taken a bit of pressure off risk assets. Not long ago, markets were pricing in around a 70% chance of a move, following a run of hawkish signals earlier in the year. But that’s changed as geopolitical risks and energy concerns have crept higher, raising growth fears.
The Middle East situation is particularly relevant for Japan, given it sources a vast majority of its oil through the Strait of Hormuz. Any prolonged disruption there leaves the economy exposed. Inside the BOJ, there’s now a bit of a split—some policymakers point to inflation hovering near the 2% target for years as justification for a hike, while others would rather sit tight and see how events unfold.
For now, the expectation is that the BOJ holds rates steady in April, but it will almost certainly nudge up its inflation forecasts while trimming its growth outlook.
Technical USD/JPY forecast
Let’s start by looking at the weekly chart of the USD/JPY:
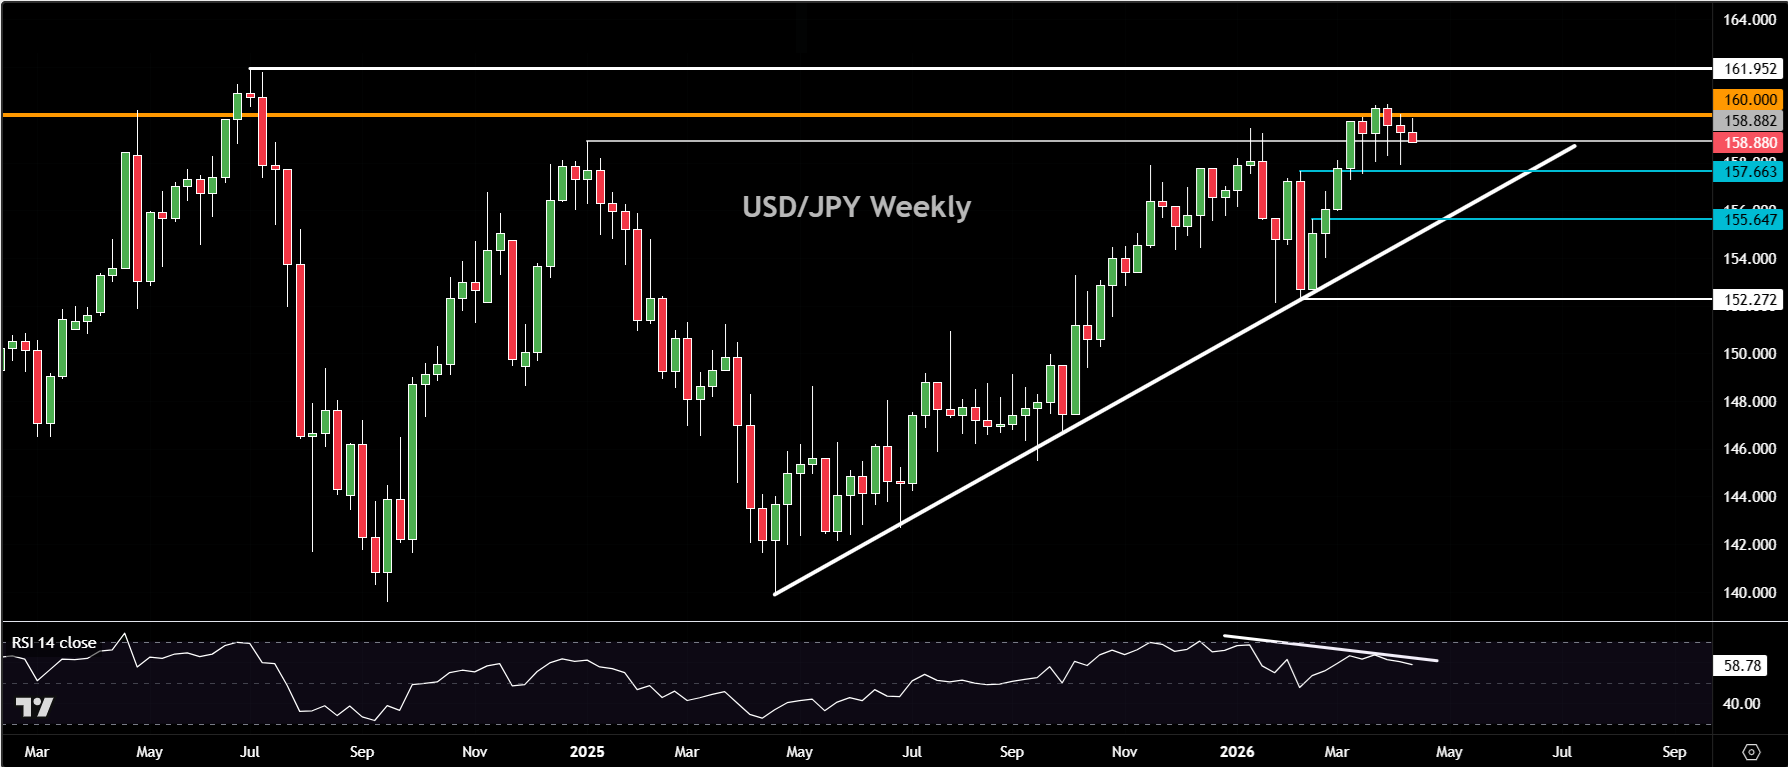
We can see that this week’s candle has turned red after starting the week on a positive note. If it closes like this, it will mark the third consecutive bearish weekly candle for dollar yen.
What’s notable here is that this price action is unfolding around the long-term resistance area near the 160.00 region — a level where we’ve previously seen significant declines in this currency pair. This suggests that the prior bullish trend may be weakening or, at the very least, losing momentum around this key resistance zone.
Looking at the Relative Strength Index (RSI), it also supports this view. The RSI has formed a lower high while price recently pushed to a higher high, indicating bearish divergence. This suggests that the latest move up from the early February lows may be running out of steam – as we already have seen.
That said, it’s still far too early to call a top. While the technical signals point to a more cautious USD/JPY forecast, we would need to see a break below key support levels to trigger fresh selling pressure. For now, price is still holding above major support levels on the longer-term timeframe, so it’s premature to suggest that the pair has topped out.
Key USD/JPY technical levels to watch
In terms of levels to watch on the weekly chart, 158.88 stands out as a key level. It acted as resistance in December 2024 and that same level was retested a couple of times earlier this year before price sold off, despite a brief break above it. In early March, we finally saw a decisive breakout above 158.88, but there has been very little follow-through buying since then.
With selling pressure emerging again near 160.00, this raises the possibility of another false breakout above 158.88 — although, again, it’s too early to draw firm conclusions.
Below 158.88, the next support level to watch is 157.66. This level previously acted as resistance and has since turned into support on multiple occasions, making it a key area for a potential retest.
Further down, 155.65 is another potential support level. This area is particularly important as it aligns with a bullish trendline that has been in place since April 2025. The trendline has been validated by several higher lows, most recently in February this year.
At this stage, only a clear break below this bullish trendline would confirm a broader reversal.
Daily USD/JPY chart shows a similar picture
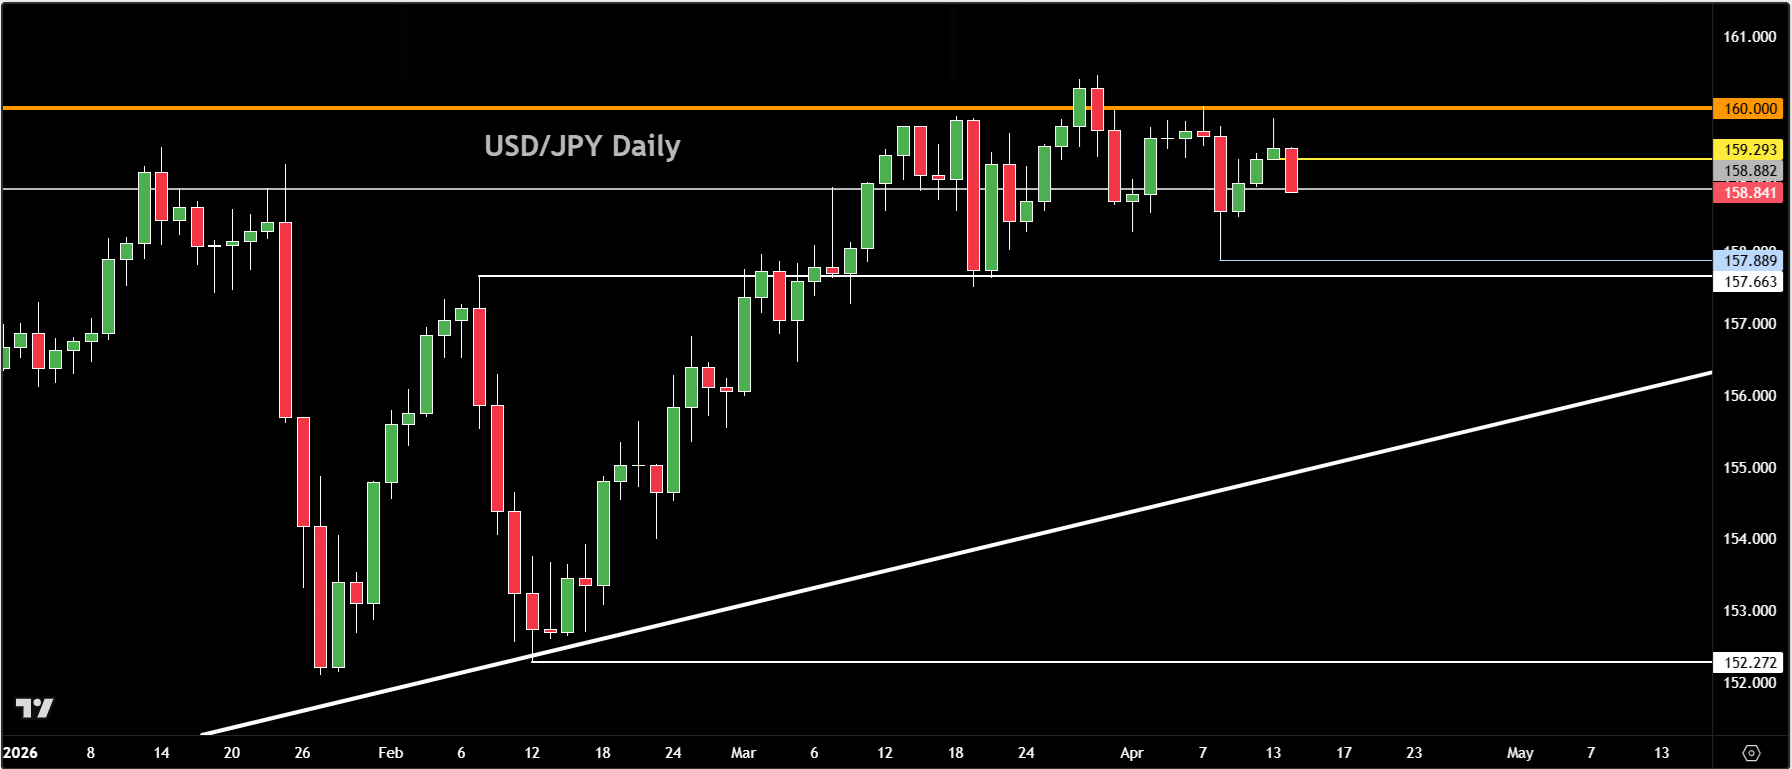
Switching to the daily chart, we see a similar picture. Price action has become more range-bound, with no strong directional movement, reinforcing the idea that momentum has faded in the short term.
This also aligns with the broader macro backdrop, where other major central banks — outside of the Federal Reserve — have turned more hawkish, mainly in response to rising energy prices.
On the daily timeframe, there aren’t many additional levels beyond those already highlighted on the weekly chart. However, one near-term resistance level to watch is 159.29, which marks the low of yesterday’s inverted hammer candle.
That level now becomes important resistance if price attempts to move higher in the coming sessions.

-- Written by Fawad Razaqzada, Market Analyst
Follow Fawad on Twitter @Trader_F_R