
Weekly Technical Trade Levels on USD Majors, Commodities & Stocks
- Technical trade setups we are tracking into the start of the week on the USD Majors, commodities, bitcoin, and equity indices.
- Next Weekly Strategy Webinar: Monday, June 15 at 8:30am ET
- Review the latest Video Updates or Stream Live on my YouTube playlist
In this webinar we take an in-depth look at the technical trade levels for the US Dollar (DXY), Euro (EUR/USD), British Pound (GBP/USD), Australian Dollar (AUD/USD), Canadian Dollar (USD/CAD), Japanese Yen (USD/JPY), Swiss Franc (USD/CHF), Gold (XAU/USD), Crude Oil (WTI), and Bitcoin (BTC/USD), and S&P 500 (SPX500), Nasdaq (NDX), and Dow Jones (DJI). These are the levels that matter on the technical charts into the weekly open. The assets are chaptered on the recording for your convenience.
US Dollar Index Price Chart – USD 240min
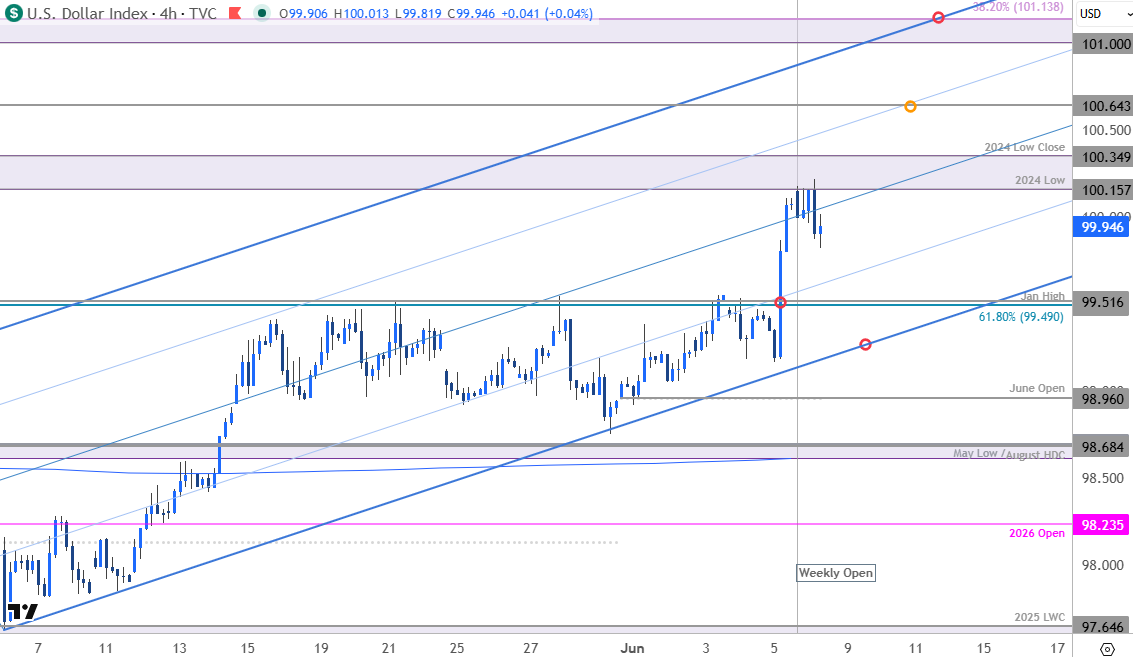
Chart Prepared by Michael Boutros, Sr. Technical Strategist; DXY on TradingView
Notes: The U.S. Dollar Index broke technical resistance last week at 99.50 with DXY rallying nearly 1.9% off the late-May low. The bulls are testing the next major pivot zone today at 100.16/35- a region defined by the 2024 swing low / low close, the August & April highs, and the November high-day close. The immediate focus is on a reaction off this threshold with the long-bias vulnerable while below.
Look for initial support at former resistance around 99.50 with the lower parallel just lower, currently near 99.20s. Monthly open support rests at 98.96 with broader bullish invalidation steady at the 200-day moving average and the May low / August high-day close (HDC) at 98.62/68.
A topside break from here exposes subsequent resistance objectives at the yearly swing high at 100.65 and the 38.2% retracement of the 2025 decline at 101.00/13. Note the upper parallel converges on this zone into the close of the week- look for larger reaction there IF reached.
Bottom line: The U.S. Dollar is trading just below pivotal resistance near the yearly high into the start of the week, and the focus is on possible price inflection off this zone- risk for some kickback here within the broader structure. From a trading standpoint, losses should be limited to the lower parallel (~99.20s) IF price is heading higher on this stretch with a daily close above 100.35 needed to fuel the next leg of the advance.
Keep in mind that markets will be digesting two key event risks this week, with the release of the May U.S. Consumer Price Index (CPI) on Wednesday followed by the European Central Bank rate decision on Thursday. While the market is broadly positioned for a 25-basis-point hike from the ECB, the reaction function may ultimately hinge on the tone of the accompanying statement and any signals regarding the pace of future tightening. Stay nimble into the event risk and watch the weekly close here for clues on the next directional move. Review my latest US Dollar Weekly Forecast for a closer look at the longer-term DXY technical trade levels.

Canadian Dollar Price Chart – USD/CAD 240min
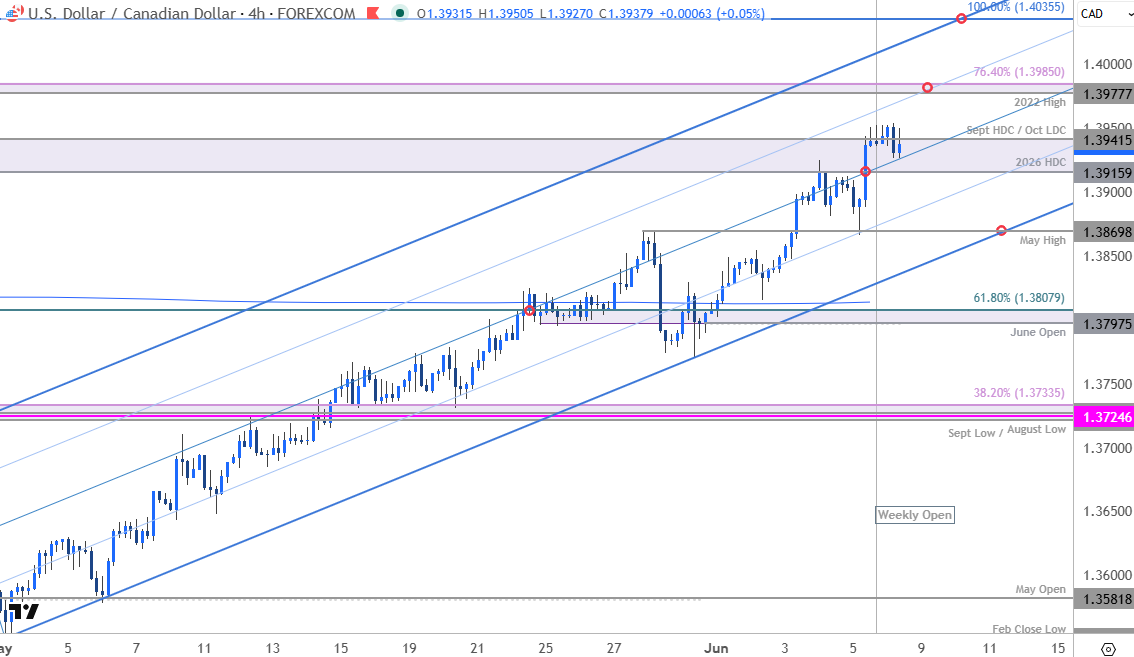
Chart Prepared by Michael Boutros, Sr. Technical Strategist; USD/CAD on TradingView
Notes: USD/CAD is attempting to breach major resistance into the start of the week at 1.3916/42- a region defined by the yearly high-day close (HDC), the September HDC, and the October low-day close (LDC). This technical hurdle has capped advances since the start of the year and a daily close above is needed to keep the immediate advance viable.
Subsequent resistance objectives are eyed at the 2022 high and the 76.4% retracement of the November decline at 1.3978/85 and the 100% extension of the late-January advance at 1.4035. Note that this level converges on the upper parallel later in the week- look for a larger reaction there IF reached.
Initial support now 1.3916 backed by the May high at 1.3870. Near-term bullish invalidation is now raised to 1.3798-1.3814 – a region defined by the June open, the 61.8% retracement of the March decline and the 200-day moving average.
Bottom line: The focus is on this attempted breakout of a key pivot-zone near the yearly highs. From a trading standpoint, losses would need to bel limited to 1.3870 IF price is heading higher on this stretch with a secured close here keeping the focus on subsequent resistance objectives at fresh yearly highs.
The Bank of Canada rate decision is on tap Wednesday just after U.S. CPI, and the central bank widely expected to leave rates unchanged. Watch the weekly close here and keep in mind a sustained push through this zone would constitute a breakout of the yearly opening range and have longer-term implications for trend in the months ahead. Review my last Canadian Dollar Forecast for a closer look at the longer-term USD/CAD technical trade levels.
Economic Calendar – Key Data Releases
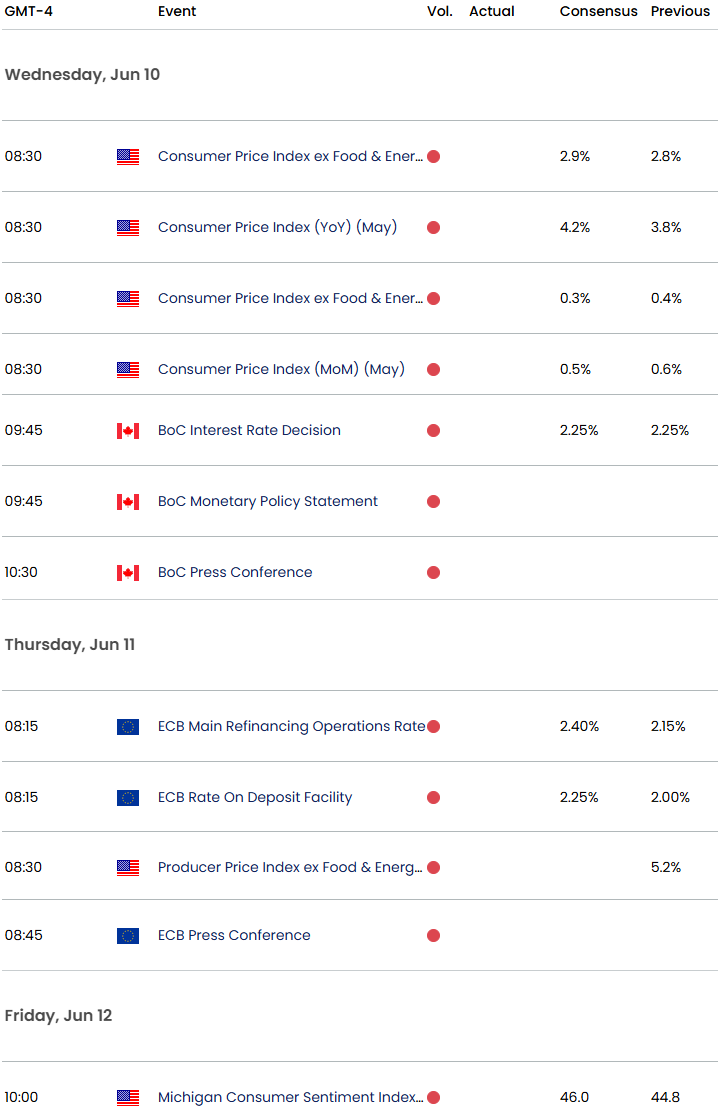
Economic Calendar - latest economic developments and upcoming event risk.
--- Written by Michael Boutros, Senior Technical Strategist
Follow Michael on X @MBForex