






USD Spike to Two-Year High, EUR/USD Breaks Down, USD/CAD Holds 1.4000
USD/CAD held inside of the 1.4000 handle and the prior week high, even as EUR/USD and DXY broke out to multi-year extremes. Next week is big for USD, USD/CAD and EUR/USD themes as move into month-end.
Share this:

US Dollar, DXY, USD/CAD, EUR/USD Talking Points:
- It was another week of strength for the US Dollar, driven in-large part by the EUR/USD breakdown below the 1.0500 level.
- GBP/USD was similarly week, trading to a fresh low but both USD/CAD and USD/JPY held inside of prior week highs, setting the stage for possible reversion scenarios as we move into next week.
- For next week, FOMC minutes are released on Tuesday and that could be big given the response to last month’s rate cut, with markets now showing a coin flip for another cut in December. And at that December FOMC meeting, we’ll also get updated guidance and projections that will show how dovish the Fed as we move into 2025.
- I’ll be looking at each of these markets in the Tuesday webinar ahead of next week’s release of FOMC minutes. You’re welcome to join: Click here for registration information.
The US Dollar technically set a fresh two-year-high this week as the Friday spike traded above the 108.00 handle. This went along with a fresh two-year-low in EUR/USD with was pushed along after the pair traded through the 1.0500 handle that had previously marked range resistance in the pair.
While GBP/USD was similarly weak, that same USD-strength didn’t show as prominently elsewhere. Both USD/CAD and USD/JPY remained inside of prior week highs and as we move into next week, where there are a couple of big drivers for the US Dollar, that remains of interest for possible reversion scenarios.
On the drivers front, FOMC minutes on Tuesday should be interesting. It was at last month’s rate cut that the Fed removed a phrase around having confidence that inflation was under control. That helped to bring an initial move of strength to the USD, but with Powell demurring the matter when questioned in the Q&A, USD continued its post-election pullback.
But, since then the Dollar has been incredibly strong and we’ve seen rate cut probabilities for another cut in December whittle down to a coin flip, as of this writing. And for next year, expectations have moderated quite a bit from where they were at the Fed meeting earlier this month. So the release of FOMC minutes from that meeting should be telling.
Then the next day brings Core PCE which is known as ‘the Fed’s preferred inflation gauge,’ and that’s released alongside a GDP reading at 8:30 that morning. And then the day after is Thanksgiving, so US markets will be closed for the day, and the following day is ‘Black Friday,’ which can bring about possible lower liquidity backdrops.
Also interesting is that Black Friday is the final trading day in November, so we’ll see the close of monthly bars and the USD/CAD testing of 1.4000 remains a hot button on that front.
In the US Dollar, resistance finally showed after a test of the 108.00 level in DXY, which was last traded in November of 2022. Bulls did nudge above, albeit slightly, which is what technically set that fresh two-year high. But it was a strong response in the back-half of the week after 107.00 had held resistance last Friday, leading into pullback on Monday and Tuesday.
US Dollar Weekly Price Chart
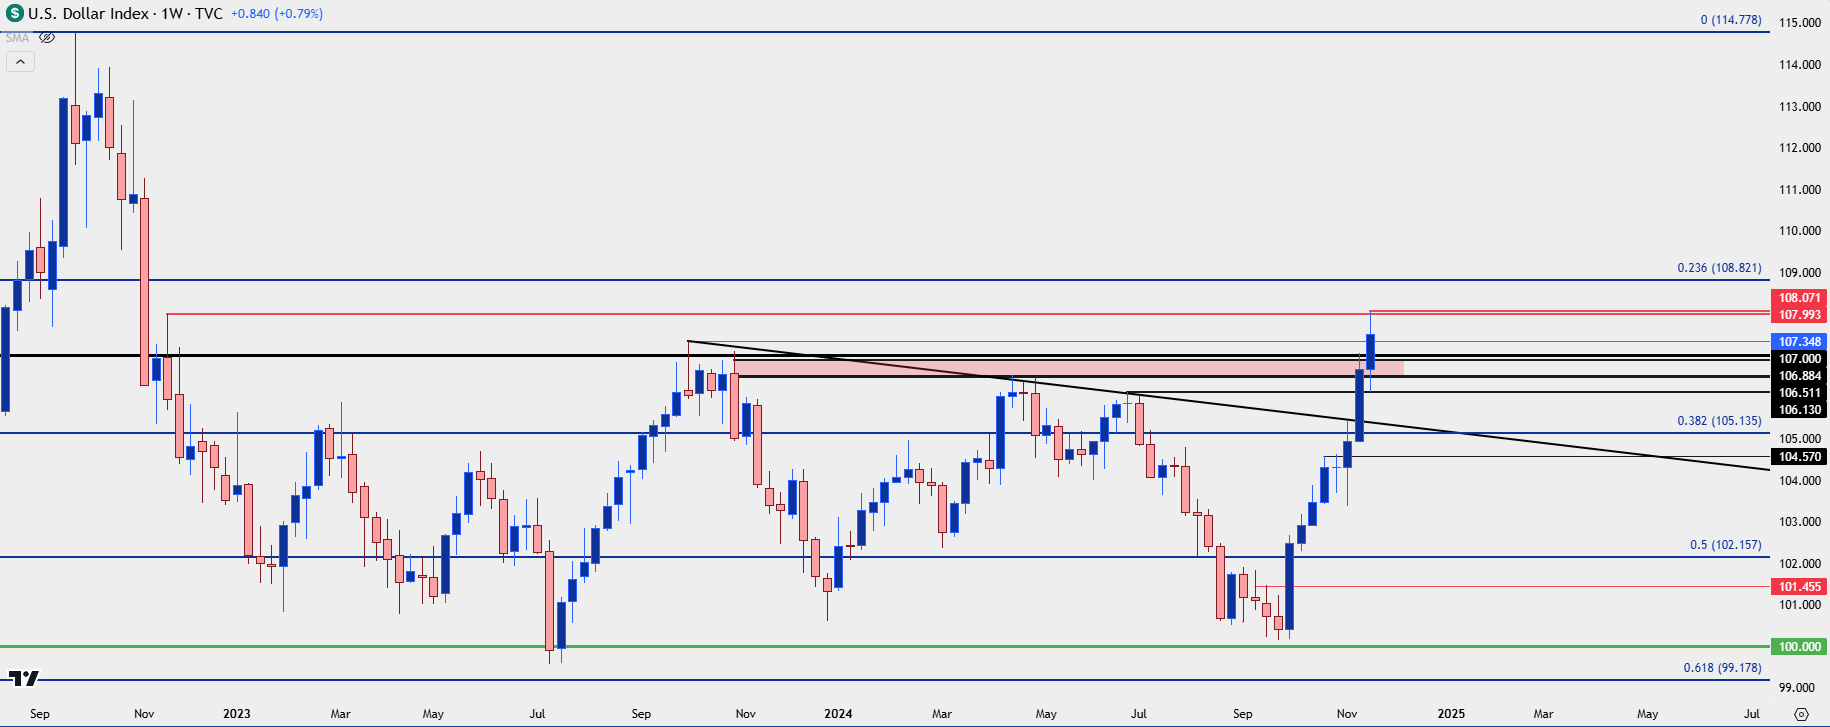 Chart prepared by James Stanley; data derived from Tradingview
US Dollar Daily
The pullback that held through the weekly open remained relatively mild, with support holding at prior resistance of 106.13 on Monday, Tuesday, and Wednesday. The flare of geopolitical tension seemed to help both USD and gold move-higher and that move in gold was very impressive as the metal gained more than 5% on the week.
In the USD, it would be difficult to call this anything but a bullish picture as there’s been extension of both higher-highs and higher-lows. Given prior resistance, there’s a couple of spots for possible support potential especially as we near some big drivers for the US economy on next week’s calendar.
The 107.00 level is rather obvious, as this helped to hold last week’s high. And there’s also the prior FOMC-gap from last November, plotted from 106.50-106.88.
If bulls lose the handle below 106.13 then the door can open to deeper reversion potential.
US Dollar Daily Price Chart
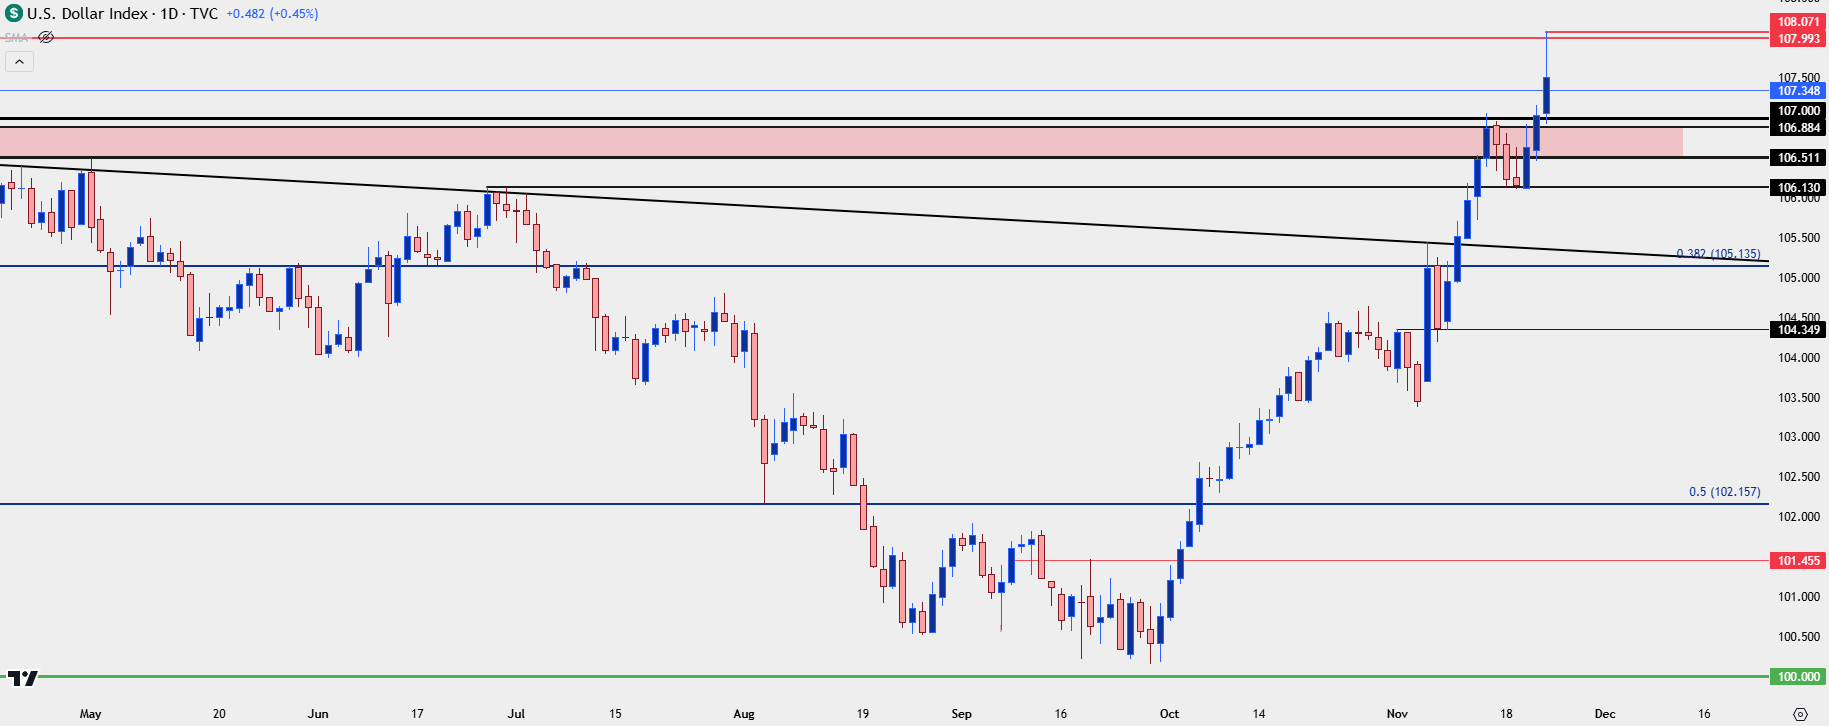 Chart prepared by James Stanley; data derived from Tradingview
EUR/USD
The Euro is 57.6% of the DXY quote and last week’s breakout in DXY was very much coupled with a breakdown in EUR/USD. And there’s also a similar dynamic of a well-developed move that could be difficult to chase in the trend-side direction. But, there’s also no sign yet that the move is over.
Calls for parity have already begun to permeate headlines and given the economic divergence between the two economies, that’s something that probably can’t be ruled out. But – the 1.0200 level presents a big spot in EUR/USD.
The Fibonacci retracement produced by the 2021-2022 major move remains relevant: it was the 38.2% retracement of that move that helped to set the weekly high at 1.0611, a level I looked at in the Tuesday webinar. And last year’s high showed at the 61.8% retracement of that same major move. The 1.0200 level is the 23.6% retracement from that same Fibonacci study and it’s now confluent with the 61.8% retracement of the September 2022-July 2023 rally. That’s a major spot if/when it comes into play.
For resistance, there’s a shorter-term swing level at 1.0462 and of course the 1.0500 level remains of interest as this had provided support over multiple occasions in the past couple of years.
EUR/USD Weekly Price Chart
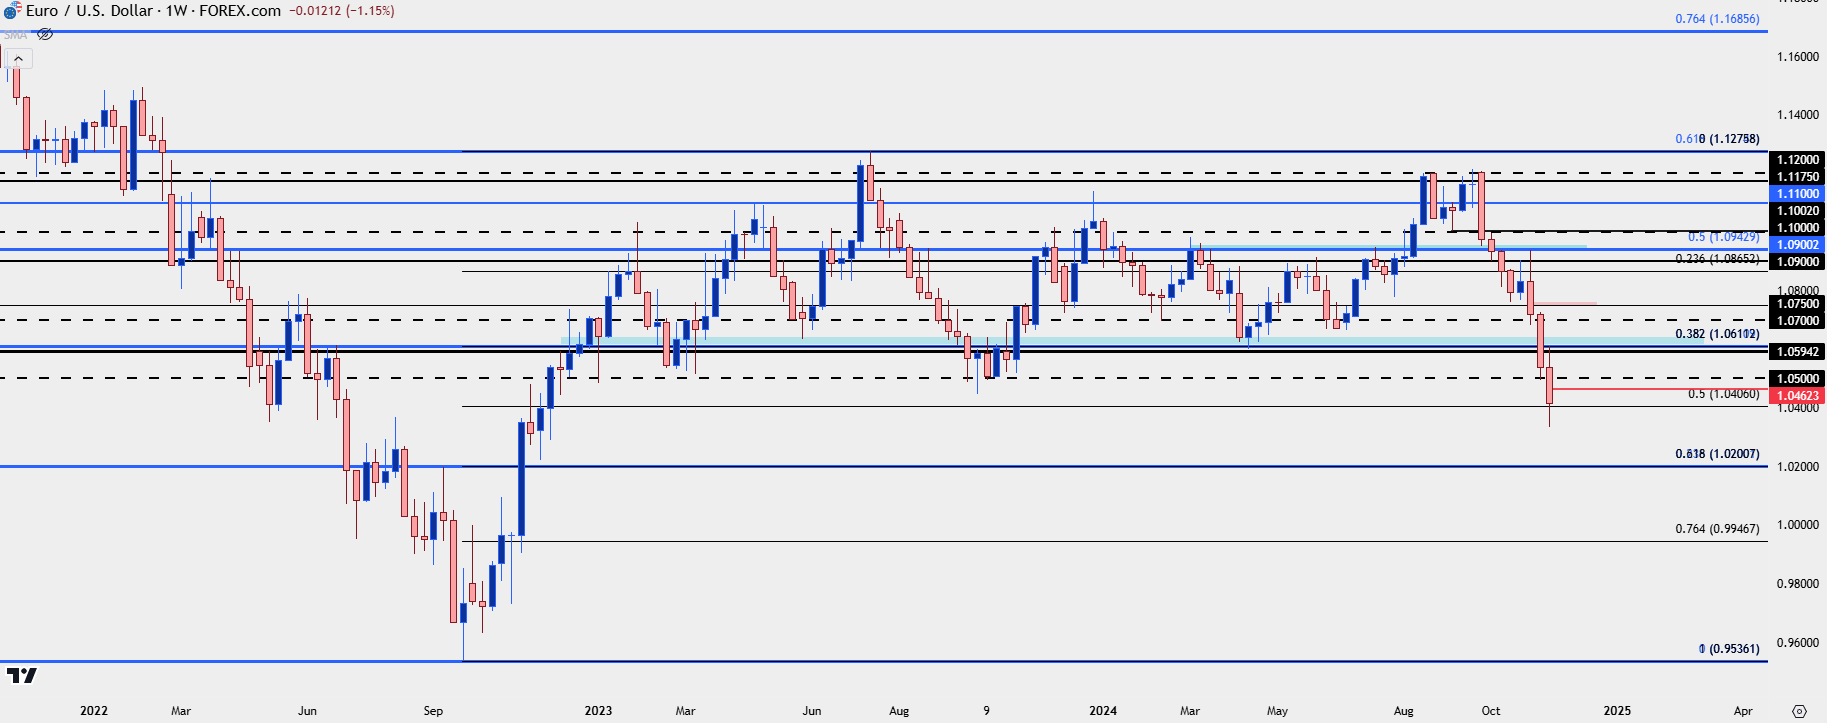 Chart prepared by James Stanley, EUR/USD on Tradingview
USD/CAD
While EUR/USD and GBP/USD both broke down to fresh lows last week, USD/CAD notably held inside of last week’s high.
This is one that I’m going to keep on the radar until the end of the month but as I discussed in the Thursday article, the 1.4000 level is important in the pair, and there’s only been one monthly close above that price in the past 20 years, and that was the month that Covid was getting priced-in.
It’s still too early to call a top, however, and next Friday represents the monthly close; so if we do see prices holding inside of that major psychological level, the prospect of reversion can begin to look as more attractive.
For this week, the move was messy, and 1.4000 was tested twice more after USD/CAD fell-below the big figure on Tuesday. In both cases, sellers came in to push price back below.
Where the pair gets interesting for next week is if we do see USD-weakness take-over after the Wednesday data.
USD/CAD Daily Price Chart
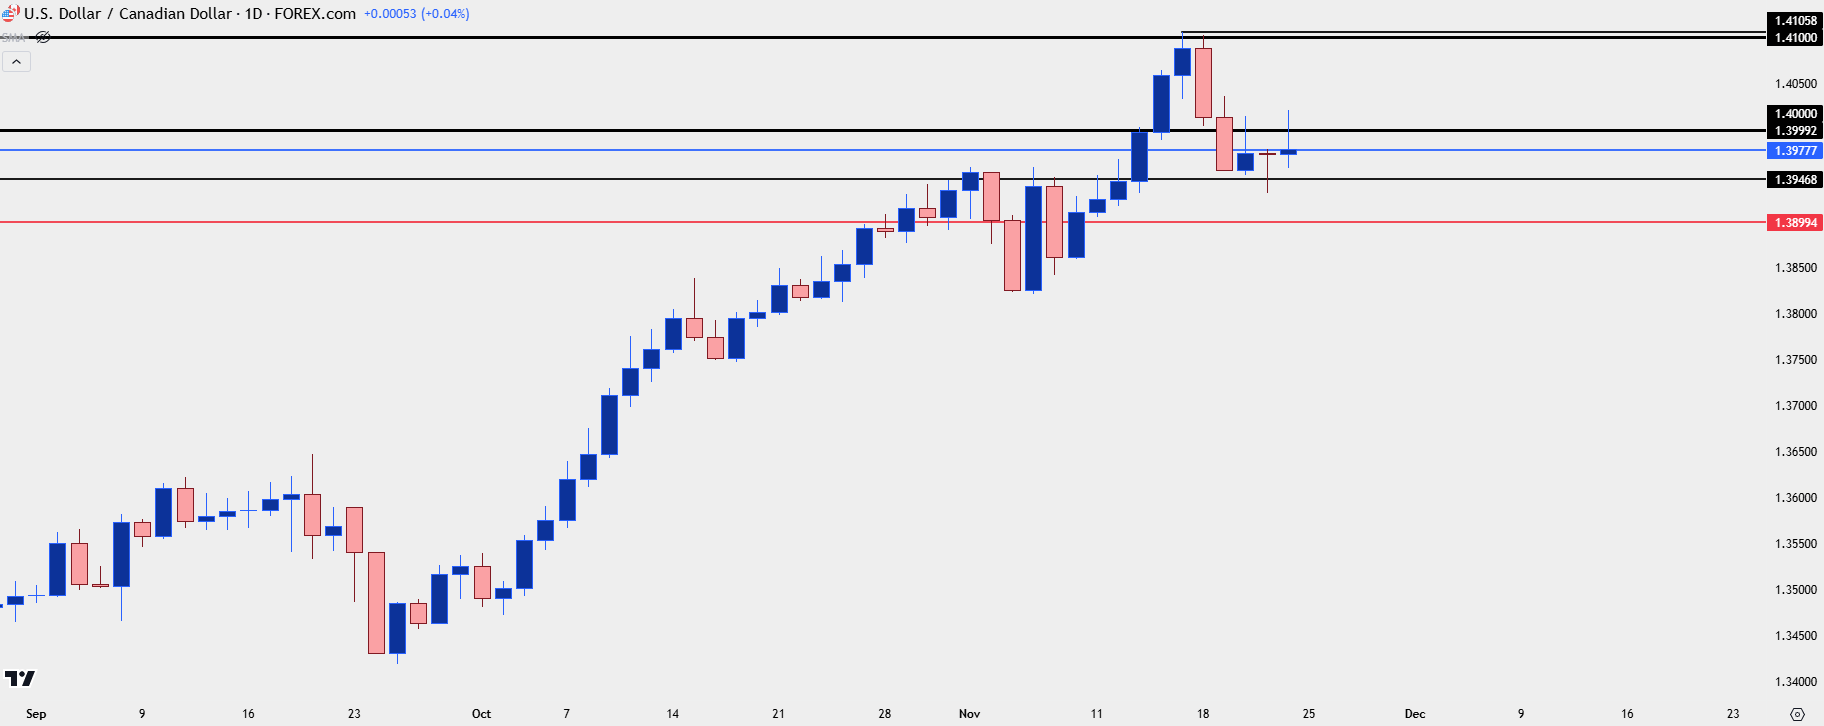 Chart prepared by James Stanley, USD/CAD on Tradingview
--- written by James Stanley, Senior Strategist
US Dollar, DXY, USD/CAD, EUR/USD Talking Points:
- It was another week of strength for the US Dollar, driven in-large part by the EUR/USD breakdown below the 1.0500 level.
- GBP/USD was similarly week, trading to a fresh low but both USD/CAD and USD/JPY held inside of prior week highs, setting the stage for possible reversion scenarios as we move into next week.
- For next week, FOMC minutes are released on Tuesday and that could be big given the response to last month’s rate cut, with markets now showing a coin flip for another cut in December. And at that December FOMC meeting, we’ll also get updated guidance and projections that will show how dovish the Fed as we move into 2025.
- I’ll be looking at each of these markets in the Tuesday webinar ahead of next week’s release of FOMC minutes. You’re welcome to join: Click here for registration information.
The US Dollar technically set a fresh two-year-high this week as the Friday spike traded above the 108.00 handle. This went along with a fresh two-year-low in EUR/USD with was pushed along after the pair traded through the 1.0500 handle that had previously marked range resistance in the pair.
While GBP/USD was similarly weak, that same USD-strength didn’t show as prominently elsewhere. Both USD/CAD and USD/JPY remained inside of prior week highs and as we move into next week, where there are a couple of big drivers for the US Dollar, that remains of interest for possible reversion scenarios.
On the drivers front, FOMC minutes on Tuesday should be interesting. It was at last month’s rate cut that the Fed removed a phrase around having confidence that inflation was under control. That helped to bring an initial move of strength to the USD, but with Powell demurring the matter when questioned in the Q&A, USD continued its post-election pullback.
But, since then the Dollar has been incredibly strong and we’ve seen rate cut probabilities for another cut in December whittle down to a coin flip, as of this writing. And for next year, expectations have moderated quite a bit from where they were at the Fed meeting earlier this month. So the release of FOMC minutes from that meeting should be telling.
Then the next day brings Core PCE which is known as ‘the Fed’s preferred inflation gauge,’ and that’s released alongside a GDP reading at 8:30 that morning. And then the day after is Thanksgiving, so US markets will be closed for the day, and the following day is ‘Black Friday,’ which can bring about possible lower liquidity backdrops.
Also interesting is that Black Friday is the final trading day in November, so we’ll see the close of monthly bars and the USD/CAD testing of 1.4000 remains a hot button on that front.
In the US Dollar, resistance finally showed after a test of the 108.00 level in DXY, which was last traded in November of 2022. Bulls did nudge above, albeit slightly, which is what technically set that fresh two-year high. But it was a strong response in the back-half of the week after 107.00 had held resistance last Friday, leading into pullback on Monday and Tuesday.
US Dollar Weekly Price Chart
Chart prepared by James Stanley; data derived from Tradingview
US Dollar Daily
The pullback that held through the weekly open remained relatively mild, with support holding at prior resistance of 106.13 on Monday, Tuesday, and Wednesday. The flare of geopolitical tension seemed to help both USD and gold move-higher and that move in gold was very impressive as the metal gained more than 5% on the week.
In the USD, it would be difficult to call this anything but a bullish picture as there’s been extension of both higher-highs and higher-lows. Given prior resistance, there’s a couple of spots for possible support potential especially as we near some big drivers for the US economy on next week’s calendar.
The 107.00 level is rather obvious, as this helped to hold last week’s high. And there’s also the prior FOMC-gap from last November, plotted from 106.50-106.88.
If bulls lose the handle below 106.13 then the door can open to deeper reversion potential.
US Dollar Daily Price Chart
Chart prepared by James Stanley; data derived from Tradingview
EUR/USD
The Euro is 57.6% of the DXY quote and last week’s breakout in DXY was very much coupled with a breakdown in EUR/USD. And there’s also a similar dynamic of a well-developed move that could be difficult to chase in the trend-side direction. But, there’s also no sign yet that the move is over.
Calls for parity have already begun to permeate headlines and given the economic divergence between the two economies, that’s something that probably can’t be ruled out. But – the 1.0200 level presents a big spot in EUR/USD.
The Fibonacci retracement produced by the 2021-2022 major move remains relevant: it was the 38.2% retracement of that move that helped to set the weekly high at 1.0611, a level I looked at in the Tuesday webinar. And last year’s high showed at the 61.8% retracement of that same major move. The 1.0200 level is the 23.6% retracement from that same Fibonacci study and it’s now confluent with the 61.8% retracement of the September 2022-July 2023 rally. That’s a major spot if/when it comes into play.
For resistance, there’s a shorter-term swing level at 1.0462 and of course the 1.0500 level remains of interest as this had provided support over multiple occasions in the past couple of years.
EUR/USD Weekly Price Chart
Chart prepared by James Stanley, EUR/USD on Tradingview
USD/CAD
While EUR/USD and GBP/USD both broke down to fresh lows last week, USD/CAD notably held inside of last week’s high.
This is one that I’m going to keep on the radar until the end of the month but as I discussed in the Thursday article, the 1.4000 level is important in the pair, and there’s only been one monthly close above that price in the past 20 years, and that was the month that Covid was getting priced-in.
It’s still too early to call a top, however, and next Friday represents the monthly close; so if we do see prices holding inside of that major psychological level, the prospect of reversion can begin to look as more attractive.
For this week, the move was messy, and 1.4000 was tested twice more after USD/CAD fell-below the big figure on Tuesday. In both cases, sellers came in to push price back below.
Where the pair gets interesting for next week is if we do see USD-weakness take-over after the Wednesday data.
USD/CAD Daily Price Chart
Chart prepared by James Stanley, USD/CAD on Tradingview
--- written by James Stanley, Senior Strategist
Related tags:
Latest market news




Open an account in minutes
Experience award-winning platforms with fast and secure execution.
Economic calendar
Web Trader platform
Our sophisticated web-based platform is packed with features.
Related articles
US Dollar Price Action Setups: EUR/USD, USD/JPY
The US Dollar broke out to a fresh yearly high after the CPI report, and that Dollar strength was on full view in pretty much all major pairings with a particular push in EUR/USD.
US dollar forecast: USD/JPY and USD/CHF in focus | Forex Friday
Sticky US inflation and a hawkish Fed have kept the dollar firm across the majors, with USD/JPY pressing on the 160 handle. Here are the levels that matter on USD/JPY and USD/CHF as next week's retail sales, Nvidia results and FOMC minutes approach.

S&P 500 forecast: SPX struggles for direction ahead of PPI data
U.S. stocks are struggling for direction on Friday as investors continue to weigh up the fallout from Nvidia’s leadership change, rising Treasury yields and the upcoming U.S. producer price inflation data.

The information on this web site is not targeted at the general public of any particular country. It is not intended for distribution to residents in any country where such distribution or use would contravene any local law or regulatory requirement. The information and opinions in this report are for general information use only and are not intended as an offer or solicitation with respect to the purchase or sale of any currency or CFD contract. All opinions and information contained in this report are subject to change without notice. This report has been prepared without regard to the specific investment objectives, financial situation and needs of any particular recipient. Any references to historical price movements or levels is informational based on our analysis and we do not represent or warranty that any such movements or levels are likely to reoccur in the future. While the information contained herein was obtained from sources believed to be reliable, author does not guarantee its accuracy or completeness, nor does author assume any liability for any direct, indirect or consequential loss that may result from the reliance by any person upon any such information or opinions.
Futures, Options on Futures, Foreign Exchange and other leveraged products involves significant risk of loss and is not suitable for all investors. Losses can exceed your deposits. Increasing leverage increases risk. Spot Gold and Silver contracts are not subject to regulation under the U.S. Commodity Exchange Act. Contracts for Difference (CFDs) are not available for US residents. Before deciding to trade forex, commodity futures, or digital assets, you should carefully consider your financial objectives, level of experience and risk appetite. Any opinions, news, research, analyses, prices or other information contained herein is intended as general information about the subject matter covered and is provided with the understanding that we do not provide any investment, legal, or tax advice. You should consult with appropriate counsel or other advisors on all investment, legal, or tax matters. References to FOREX.com or GAIN Capital refer to StoneX Group Inc. and its subsidiaries. Please read Characteristics and Risks of Standardized Options.