
The week begins with a new depreciation in USD/MXN of -0.71% during the session, favoring the Mexican peso and attempting to reestablish a consistent bearish bias.
For now, selling pressure has re-emerged in the short term following the release of relevant inflation data for February in Mexico. This could trigger a more aggressive outlook from Banco de México, which in turn could support a more consistent recovery in demand for the Mexican peso in the near term. This fundamental development may act as a catalyst for potential downside pressure in USD/MXN in the coming trading sessions.

Inflation Data Released in Mexico
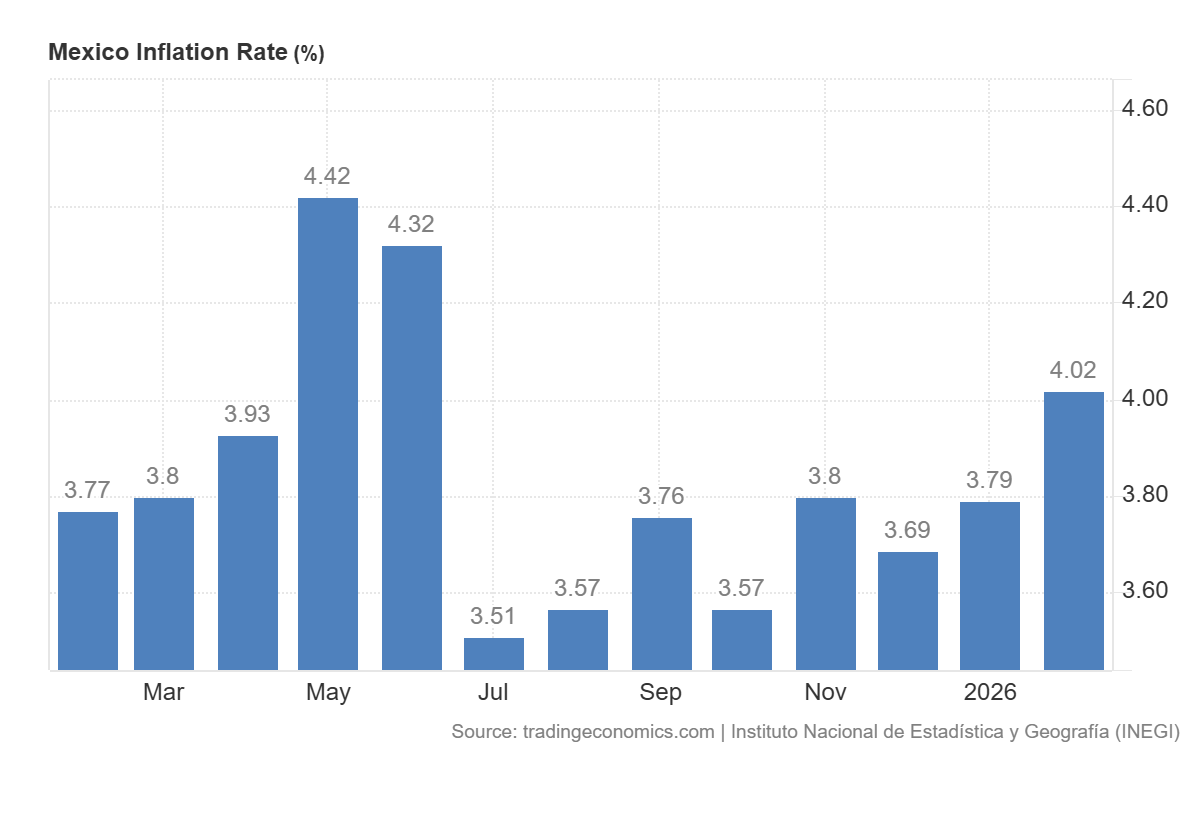
Mexico’s latest inflation figures came in above expectations, registering 4.02% year-over-year, compared to the forecast of 3.94%, and also above Banco de México’s target of 3.00% +/- one percentage point.
This confirms a consistent upward trend since December, when inflation stood at 3.69%, reflecting steady increases in subsequent months. This behavior suggests that inflation control is facing renewed challenges in the short term.
Source: TradingEconomics
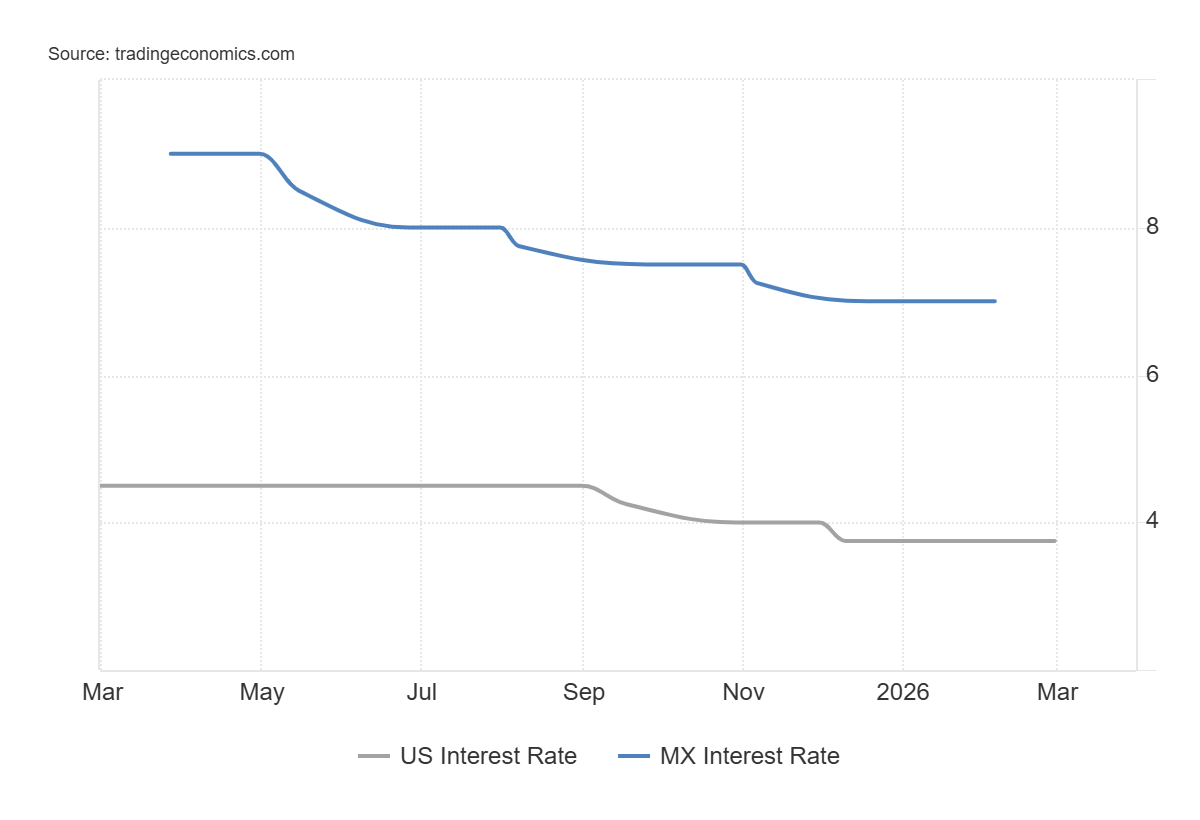
Under this new scenario, Banco de México, which had recently paused its rate-cutting cycle and currently holds the benchmark rate at 7.00%, faces a more complex monetary policy landscape. One of its primary mandates is inflation control, and recent data indicate that progress may be losing momentum.
Additionally, the ongoing conflict in the Middle East may exert further pressure on global inflation due to rising energy commodity prices. This could also influence Mexican inflation, increasing the likelihood that the central bank maintains a neutral stance for longer or that expectations of a more restrictive policy begin to emerge in the short term.
The event is relevant for the strength of the Mexican peso, as Banco de México’s 7.00% benchmark rate remains among the highest compared to major central banks and significantly exceeds the US benchmark rate of 3.75%. This creates a meaningful interest rate differential that favors peso-denominated investments over US dollar assets in the short term.
Source: TradingEconomics
This rate differential has acted as a structural catalyst for peso strength in previous months. If markets begin to anticipate a firmer Banco de México stance in response to rising inflation, the differential may persist or even widen, further supporting the peso and reinforcing downside pressure in USD/MXN in the coming sessions.
The US Dollar Shows Signs of Pause
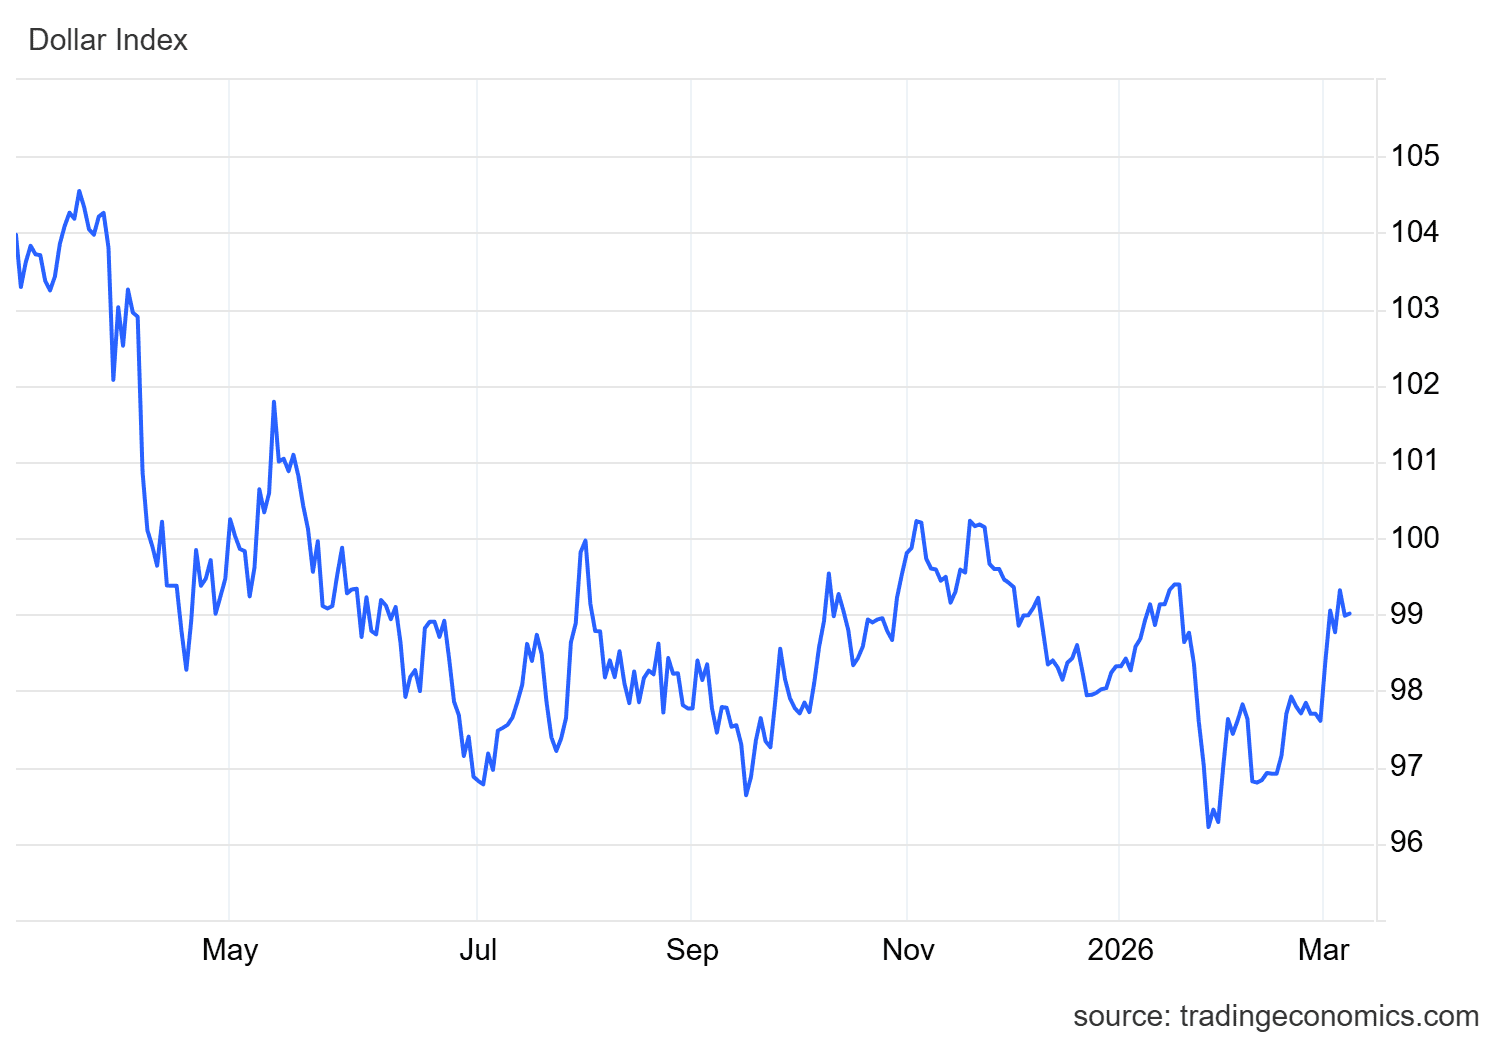
Despite ongoing geopolitical tensions in the Middle East, the US dollar has begun to show greater short-term stability. The DXY index, which measures the dollar’s strength, has paused around the 98.8 level, after posting a notable bullish move last week, now entering a consolidation phase.
Source: TradingEconomics
If the DXY continues to display a neutral bias, this could indicate a pause in the dollar’s strengthening trend and allow currencies such as the Mexican peso to gain ground in the short term. This dynamic may also contribute to sustained downside pressure in USD/MXN over the coming sessions.
Technical Outlook for USD/MXN
Fuente: StoneX, Tradingview
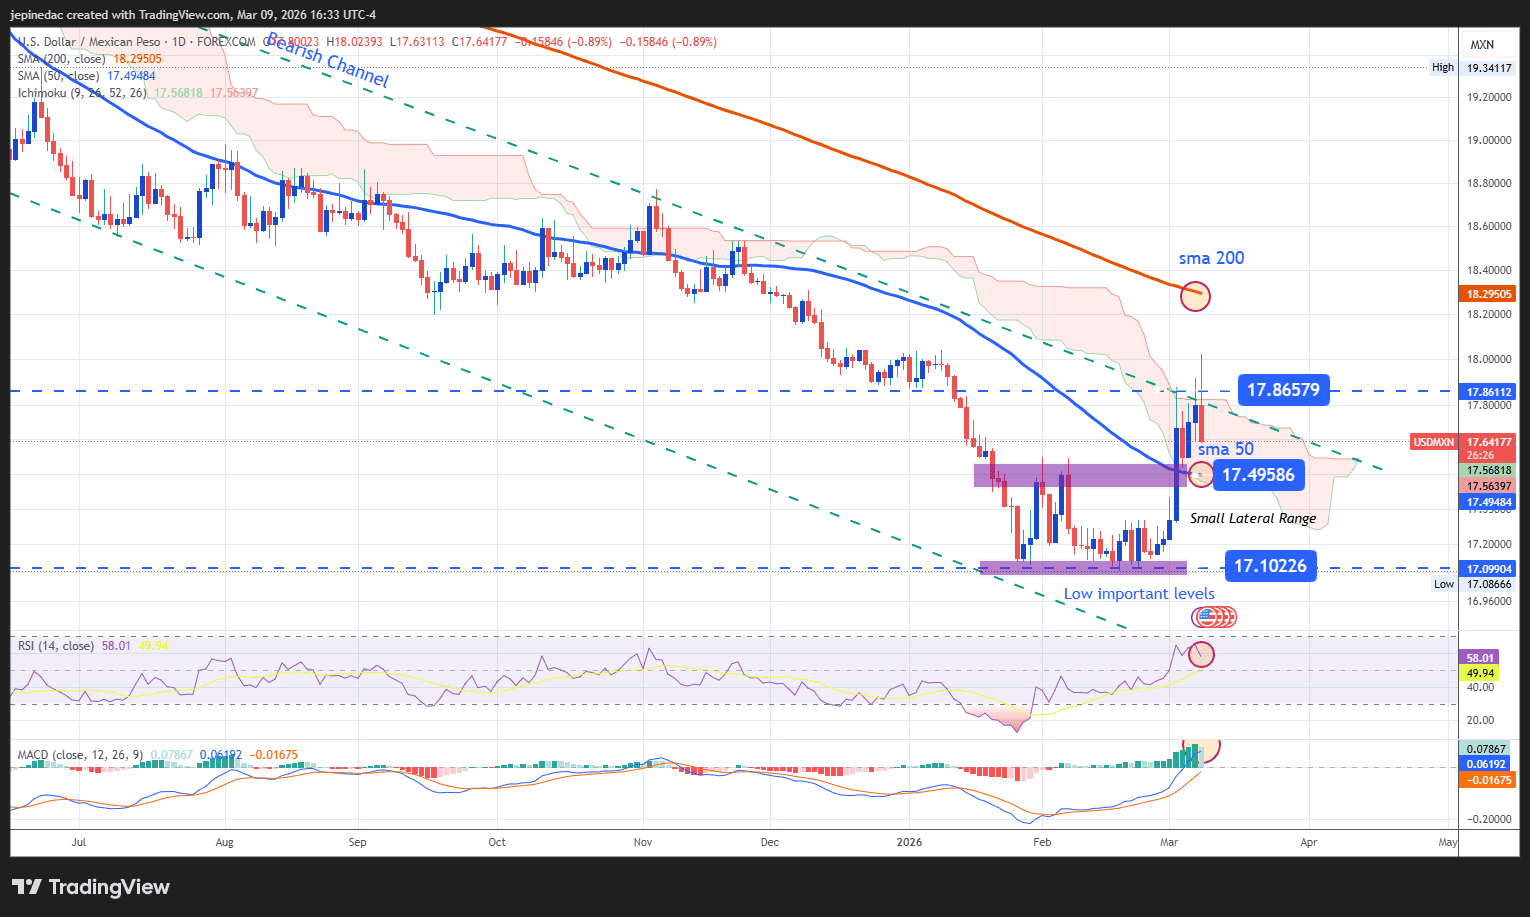
- The Broad Bearish Channel Remains Relevant: Although USD/MXN has attempted to stage short-term recoveries, these moves remain insufficient to break the broader bearish channel that has been in place for several months. For now, this remains the most relevant technical structure for short-term price action. If current selling pressure persists, the bearish channel could extend further in the coming sessions, at least until a more dominant bullish breakout emerges.
- RSI: While the RSI remains above the neutral 50 level, it has recently begun to slope downward, moving back toward neutral territory. This suggests that average bullish momentum is losing consistency in the short term. If this dynamic continues, a more pronounced phase of neutrality could develop in the coming sessions.
- MACD: A similar pattern is visible in the MACD, whose histogram has begun to decline in the short term. This indicates that average bullish momentum in moving averages is weakening, potentially opening the door to a more sustained phase of indecision in the chart.
Key Levels:
- 17.86 – Key Resistance: This level aligns with the long-term downward trendline. A sustained move toward this area could threaten the dominant bearish structure and open the door to a more relevant medium-term bullish bias.
- 17.50 – Current Barrier: Zone aligned with the 50-period moving average. A return to this level could reinforce neutrality and consolidate a more consistent short-term sideways range.
- 17.11 – Relevant Support: A level not seen since April 2024. A sustained break below this zone could intensify the bearish channel and reinforce the dominance of the selling bias in USD/MXN in the coming weeks.
Written by Julian Pineda, CFA, CMT – Market Analyst
Follow him on: @julianpineda25