



WTI Crude Oil Outlook: Bearish Momentum Mounts, COT Data Sends Warning
WTI crude oil slips below key support as bearish momentum accelerates. COT data warns of a potential sentiment extreme despite short-term downside risk.
Share this:

Oil prices have fallen nearly 10% since the July high. OPEC’s increased output and hopes that talks between Trump and Putin could result in lower oil sanction on Russia have helped weigh on crude oil, and price action on the weekly chart suggests there could be more downside to follow before a cycle low is set.
View related analysis:
View related analysis:
WTI Crude Oil Futures (CL) Technical Analysis, COT Positioning
WTI crude oil futures have been range-bound for the past two and a half years, trading between $50 and $80. Over the past 18 months, price action has been confined to a tighter $57–$75 band.
Momentum is now turning bearish. A pronounced bearish engulfing week marked a key top and a false breakout above $75. A potential bear flag has also formed around the 200-week moving averages. With WTI crude oil futures now trading below both the 200-week SMA and EMA, positioned in the lower half of the range, and momentum pointing lower, the technical outlook suggests scope for further downside — with $60 as a potential target.

Chart analysis by Matt Simpson, Source: TradingView, ICE Futures, WTI Crude Oil
WTI Crude Oil Futures (CL) Daily chart
WTI crude has just posted its most bearish streak since August 2021, with seven straight daily losses culminating in Friday’s doji low. This pattern raises the probability of at least a short-term rebound. Adding to the case, the daily RSI (2) is curling higher from oversold territory, while Monday formed a bullish inside day just beneath the 200-day averages.
My near-term bias is for a bounce toward the weekly volume point of control (VPOC) at $65.56. A break above this level would bring the monthly pivot point near $68 into focus. However, with the weekly chart still pointing lower, the broader strategy is to look for signs of a swing high on the daily timeframe — should prices rally as expected — to align with the longer-term bearish outlook.
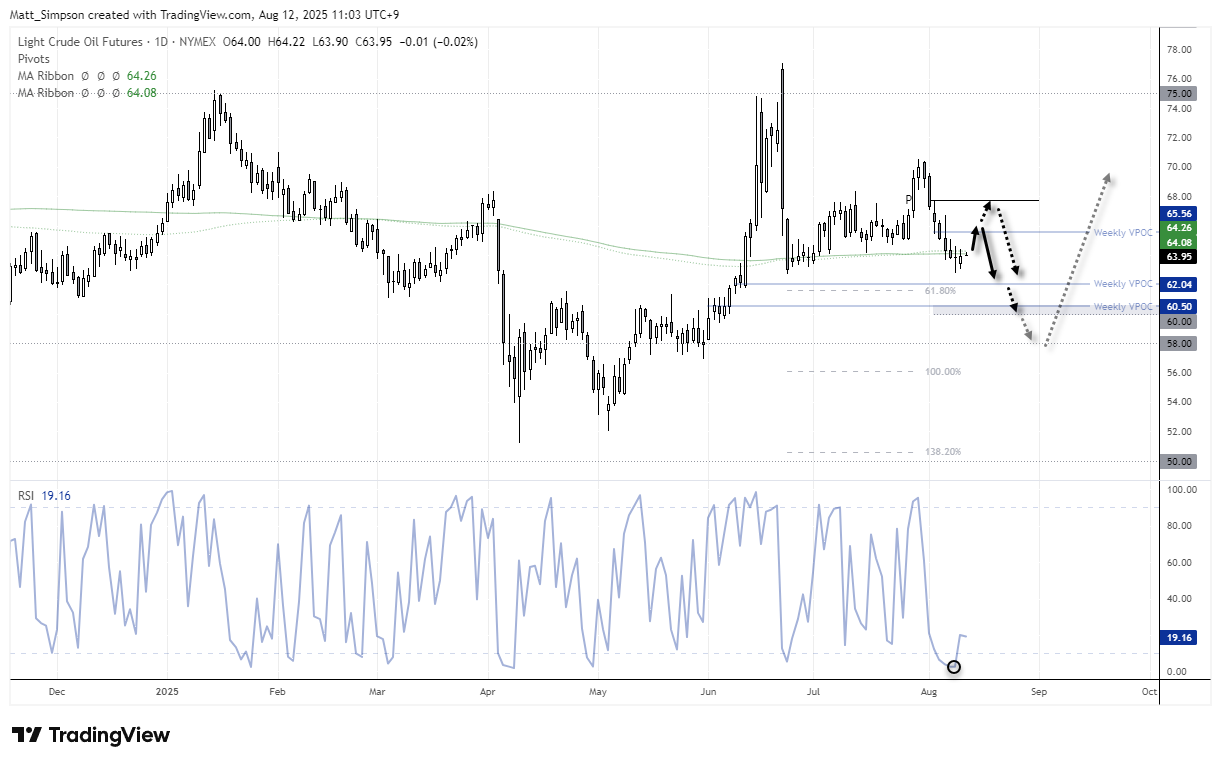
Chart analysis by Matt Simpson, Source: TradingView, ICE Futures, WTI Crude Oil
WTI Crude Oil Positioning (CL): Weekly COT Report Analysis
Net-long exposure among large speculators has dropped to a 17-week low, driven by a surge in short positions against crude oil. Gross shorts have been trending higher since mid-May, while gross longs remain relatively subdued — sitting at roughly half the level of gross shorts.
Although this setup is not particularly bullish in the near term, it is interesting to note that net-long exposure has rarely stayed below 150,000 contracts over the past 15 years. With gross longs now approaching their 2025 peak set in April, there remains a mild risk of a sentiment extreme forming.
This doesn’t justify a strong bullish case just yet, but traders may want to be cautious about assuming much lower prices from here. Though a move to $60 still remains a plausible path.
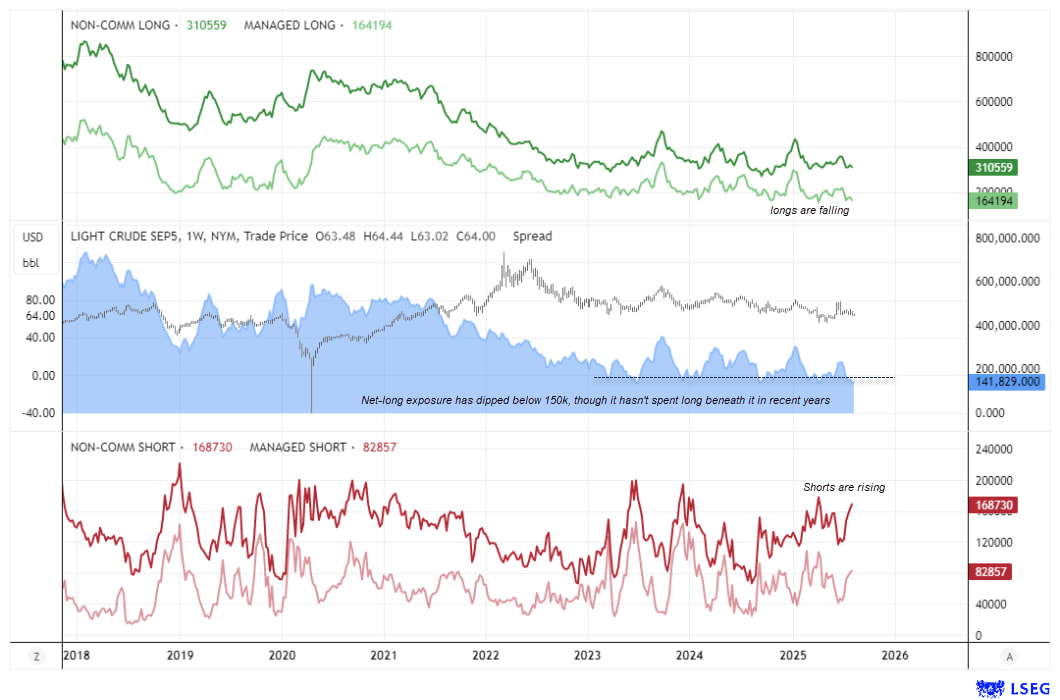
Chart analysis by Matt Simpson - Source: CME, LSEG
View the full economic calendar
View the full economic calendar
-- Written by Matt Simpson
Follow Matt on Twitter @cLeverEdge
How to trade with City Index
You can trade with City Index by following these four easy steps:
- Open an account, or log in if you’re already a customer
• Open an account in the UK
• Open an account in Australia
• Open an account in Singapore
- Search for the market you want to trade in our award-winning platform
- Choose your position and size, and your stop and limit levels
- Place the trade
Related tags:
Latest market news




Open an account in minutes
Experience award-winning platforms with fast and secure execution.
Economic calendar
Web Trader platform
Our sophisticated web-based platform is packed with features.
Related articles
The information on this web site is not targeted at the general public of any particular country. It is not intended for distribution to residents in any country where such distribution or use would contravene any local law or regulatory requirement. The information and opinions in this report are for general information use only and are not intended as an offer or solicitation with respect to the purchase or sale of any currency or CFD contract. All opinions and information contained in this report are subject to change without notice. This report has been prepared without regard to the specific investment objectives, financial situation and needs of any particular recipient. Any references to historical price movements or levels is informational based on our analysis and we do not represent or warranty that any such movements or levels are likely to reoccur in the future. While the information contained herein was obtained from sources believed to be reliable, author does not guarantee its accuracy or completeness, nor does author assume any liability for any direct, indirect or consequential loss that may result from the reliance by any person upon any such information or opinions.
Futures, Options on Futures, Foreign Exchange and other leveraged products involves significant risk of loss and is not suitable for all investors. Losses can exceed your deposits. Increasing leverage increases risk. Spot Gold and Silver contracts are not subject to regulation under the U.S. Commodity Exchange Act. Contracts for Difference (CFDs) are not available for US residents. Before deciding to trade forex, commodity futures, or digital assets, you should carefully consider your financial objectives, level of experience and risk appetite. Any opinions, news, research, analyses, prices or other information contained herein is intended as general information about the subject matter covered and is provided with the understanding that we do not provide any investment, legal, or tax advice. You should consult with appropriate counsel or other advisors on all investment, legal, or tax matters. References to FOREX.com or GAIN Capital refer to StoneX Group Inc. and its subsidiaries. Please read Characteristics and Risks of Standardized Options.