




WTI Crude Oil Forecast: Can Prices Rebound or Is Another Leg Lower Ahead?
Crude oil prices reversed sharply after a 47% rally. Can WTI crude oil bounce from key support or is another drop looming?
Share this:

WTI crude oil saw a sharp 47% rally from the May low to the June high — but the fact that half of that move was unwound in just two sessions shouldn't be ignored. This rapid reversal raises the risk of another dip lower for crude oil prices, especially given the magnitude of the decline relative to the prior rally.
That said, short-term momentum has turned higher from a key support zone, favouring an initial bounce — something crude oil bears may want to monitor for signs of a swing high next week.
View related analysis:
View related analysis:
Independence Day and OPEC Meeting Incoming
Please note that trading hours will be reduced due to the US Independence Day holiday. While exact times may vary by platform, US futures markets are expected to close at 12:00 PM EST on Friday and reopen at their usual time on Sunday night (Monday morning in Asia).
Also of note is the upcoming OPEC+ meeting on Sunday, which could trigger price gaps for WTI crude oil at Monday’s open. The market currently expects the oil cartel to announce an additional production increase of 411k barrels per day — a move that could limit upside potential for crude oil prices. However, any deviation from this guidance could surprise markets and fuel additional volatility.
WTI Crude Oil Technical Analysis: Support Levels in Play
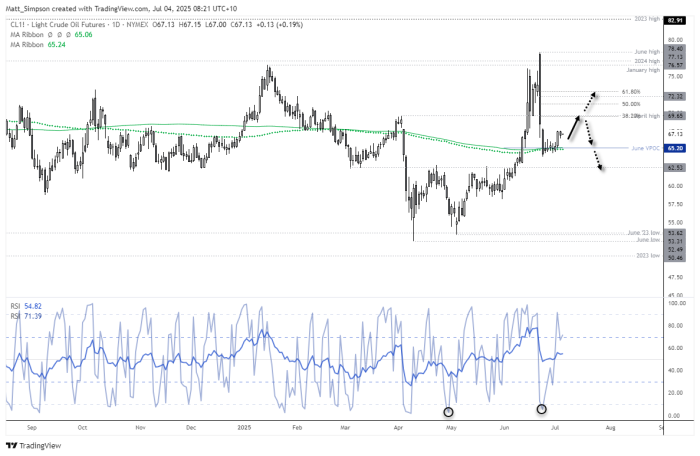
Chart analysis by Matt Simpson, Source: TradingView, ICE Futures, WTI Crude Oil
WTI crude oil has consolidated above the post-Israel–Iran ceasefire low, with price action holding near the $65 handle — a zone that also captures the 200-day EMA, 200-day SMA, and June’s volume point of control (VPOC).
The RSI (2) also reached its most oversold level since late April on June 24, suggesting that an interim swing low could be in place for crude oil.
WTI Crude Oil Trade Setup: Key Levels to Watch
• Bullish Scenario: Traders may seek dips above recent cycle lows or around $65 for tighter risk, targeting the April high near $69.65 in the short term.
• Bearish Scenario: A swing high around the 50–78.6% Fibonacci retracement levels (up to $72.50) could offer selling opportunities, with potential for crude oil prices to eventually break below the 200-day averages and revisit the $60 zone.
View the full economic calendar
View the full economic calendar
-- Written by Matt Simpson
Follow Matt on Twitter @cLeverEdge
How to trade with City Index
You can trade with City Index by following these four easy steps:
- Open an account, or log in if you’re already a customer
• Open an account in the UK
• Open an account in Australia
• Open an account in Singapore
- Search for the market you want to trade in our award-winning platform
- Choose your position and size, and your stop and limit levels
- Place the trade
Related tags:
Latest market news




Open an account in minutes
Experience award-winning platforms with fast and secure execution.
Economic calendar
Web Trader platform
Our sophisticated web-based platform is packed with features.
Related articles

Gold, EUR/USD hit 2026 lows as US yields erupt
US Treasury yields have staged one of their largest four-session increases in decades, hammering EUR/USD and gold. But while the euro's decline makes sense, gold's reaction has been extraordinary.

EUR/USD, EUR/JPY: Hawkish Fed Weighs on Euro as Yen Bulls Struggle
Hawkish Fed bets weigh on EUR/USD as ECB caution grows, while EUR/JPY's bullish wedge breakout keeps 181.50 in focus despite broader downside risks.

Tankers Still Get Hit but Brent Crude Oil Keeps Falling
Brent crude oil has turned bearish after breaking its uptrend, as de-escalation signals outweigh tanker strikes near the Strait of Hormuz.

The information on this web site is not targeted at the general public of any particular country. It is not intended for distribution to residents in any country where such distribution or use would contravene any local law or regulatory requirement. The information and opinions in this report are for general information use only and are not intended as an offer or solicitation with respect to the purchase or sale of any currency or CFD contract. All opinions and information contained in this report are subject to change without notice. This report has been prepared without regard to the specific investment objectives, financial situation and needs of any particular recipient. Any references to historical price movements or levels is informational based on our analysis and we do not represent or warranty that any such movements or levels are likely to reoccur in the future. While the information contained herein was obtained from sources believed to be reliable, author does not guarantee its accuracy or completeness, nor does author assume any liability for any direct, indirect or consequential loss that may result from the reliance by any person upon any such information or opinions.
Futures, Options on Futures, Foreign Exchange and other leveraged products involves significant risk of loss and is not suitable for all investors. Losses can exceed your deposits. Increasing leverage increases risk. Spot Gold and Silver contracts are not subject to regulation under the U.S. Commodity Exchange Act. Contracts for Difference (CFDs) are not available for US residents. Before deciding to trade forex, commodity futures, or digital assets, you should carefully consider your financial objectives, level of experience and risk appetite. Any opinions, news, research, analyses, prices or other information contained herein is intended as general information about the subject matter covered and is provided with the understanding that we do not provide any investment, legal, or tax advice. You should consult with appropriate counsel or other advisors on all investment, legal, or tax matters. References to FOREX.com or GAIN Capital refer to StoneX Group Inc. and its subsidiaries. Please read Characteristics and Risks of Standardized Options.