


AUD/USD, EUR/AUD Technical Outlook: Australian Dollar Under Pressure
AUD/USD faces bearish pressure after rejecting VPOC resistance, while EUR/AUD eyes a bullish breakout from an inverted head and shoulders.
Share this:

US Dollar Rises on Hot PPI, Cooling Fed Rate Cut Bets
The US dollar strengthened on Thursday after hotter-than-expected PPI data showed producer prices jumping 0.9% m/m and core PPI climbing 0.6% m/m. The data reinforced expectations that the Federal Reserve will resist aggressive rate cuts, limiting easing compared to what markets — and President Trump — have been calling for.
Fed Funds futures still price a 25bp cut in September, but odds for October have fallen to 52%, with December at 72% — down sharply from the three cuts expected after last week’s weak US nonfarm payrolls. This shift underpins further upside potential for the US Dollar Index (DXY), which is holding above a key trendline support level.
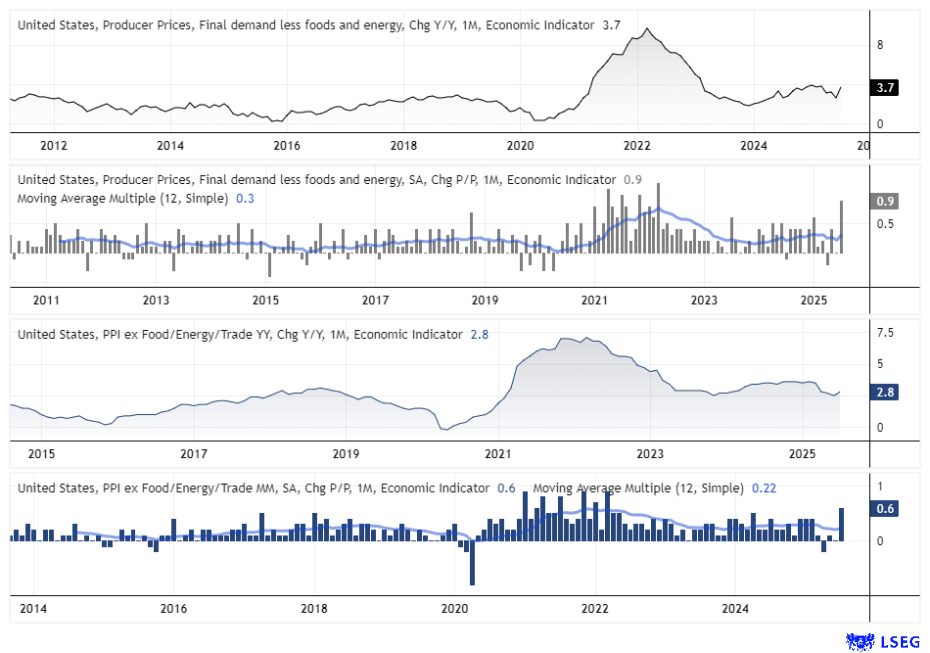
Chart prepared by Matt Simpson - data source: Bureau of Labor Statistics (LBS), London Stock Exchange Group (LSEG)
View related analysis:
View related analysis:
The Australian dollar remains under pressure against the US dollar after a strong rejection from July’s VPOC resistance, while the euro is testing a potential bullish breakout against the Australian dollar. With multiple high-impact economic releases on the calendar, including GDP data from Japan, China’s retail sales, and US retail figures, volatility across AUD/USD and EUR/AUD could pick up sharply in the coming sessions.
AUD/USD Technical Analysis: Australian Dollar vs US Dollar
A prominent bearish engulfing candle has formed on the AUD/USD daily chart, with the high perfectly respecting the July VPOC (volume point of control) — a resistance level highlighted repeatedly over the past two weeks.
With the US Dollar Index holding above trend support for now, the near-term bias leans towards further upside for the greenback and potential downside for the Australian dollar. A move towards the 0.6400 support zone remains possible, depending on the Federal Reserve’s willingness to resist political pressure from the Trump administration for multiple rate cuts.
Traders should also watch the 200-day EMA near 0.6540 and the 0.6419 swing low, which could provide interim support if selling pressure resumes.

Chart analysis by Matt Simpson - data source: TradingView AUD/USD
AUD/USD Technical Analysis: 1-Hour Chart
The 1-hour chart shows the fall from the VPOC was accompanied with rising volumes, which suggests bearish initiation behind the moved. Support was found around the 0.6480 lows, and while prices are trying to retrace higher they are on low volumes – which suggests the move to be a retracement.
Bears could seek to fade into moves towards the daily pivot point (0.6516) near the 38.2% Fibonacci level. Also note a HVN from the decline sits around the 50% retracement level near 0.6520, making a potential zone of resistance for bears to monitor.
A break below 0.6480 assumes bearish continuation in line with the daily timeframe.
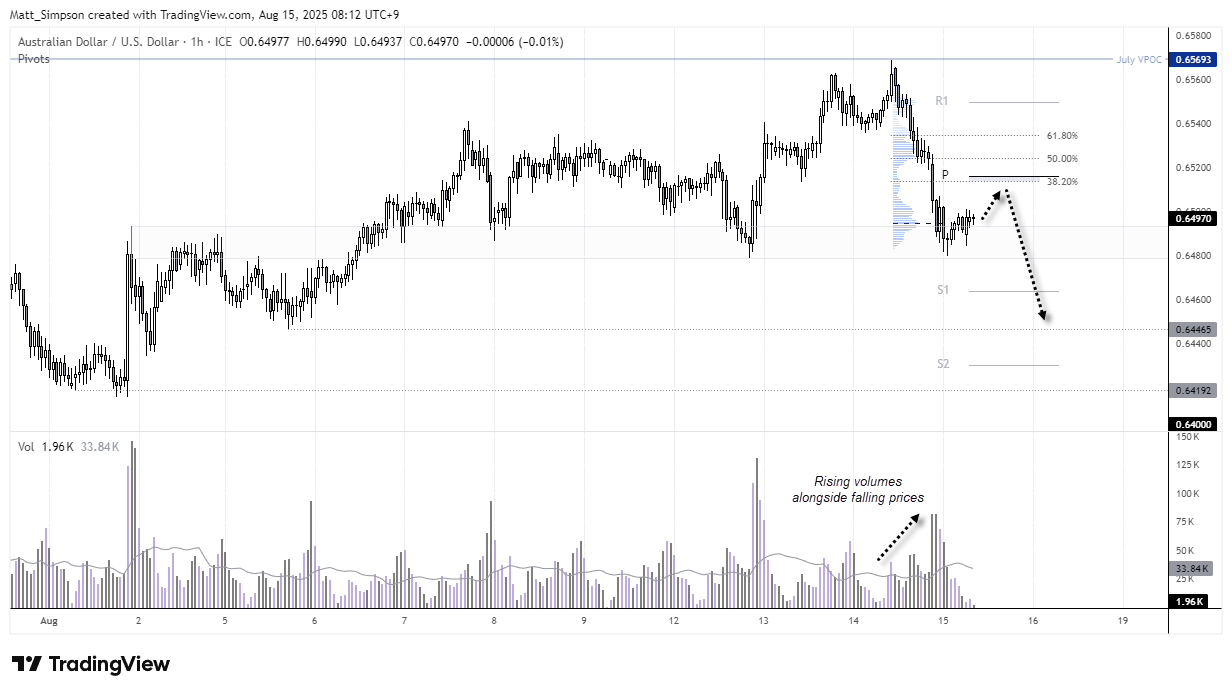
Chart analysis by Matt Simpson - data source: TradingView AUD/USD
EUR/AUD Technical Analysis: Euro vs Australian Dollar
An interesting setup is emerging on the EUR/AUD daily chart. The cross is grinding higher in a slightly haphazard uptrend, and one that I suspect will eventually provide to be corrective and break to new lows. But for now an inverted head and shoulders top pattern suggests EUR/AUD may try to burst higher over the near term.
The 100-day SMA provided support in late July, but more recently prices have bounced from the 50-day SMA. Yesterday’s bounce saw a bullish outside day form at the 50-day SMA.
The 1.8 handle may prove to be tricky to break above, which works the potential reward to risk against the idea. However, should bulls be able to enter within the range of yesterday’s candle, it could improve the potential R/R for at least an anticipated move to 1.80. A break above which brings the 1.9098 high into focus.

Chart analysis by Matt Simpson - data source: TradingView EUR/AUD
Economic Events in Focus (AEST / GMT+10)
08:30 NZD Business NZ PMI (NZD/USD, AUD/NZD, NZD/JPY)
08:45 NZD External Migration & Visitors, FPI, Permanent/Long-Term Migration, Visitor Arrivals (NZD/USD, AUD/NZD, NZD/JPY)
09:50 JPY Foreigner Bond/Stock Purchases, GDP, GDP Capital Expenditure, GDP External Demand, GDP Price Index, GDP Private Consumption (USD/JPY, EUR/JPY, AUD/JPY)
11:00 AUD MI Inflation Expectations (AUD/USD, AUD/JPY, EUR/AUD)
11:30 CNY House Prices (USD/CNH, AUD/CNH, CNH/JPY)
12:00 AUD Thomson Reuters IPSOS PCSI (AUD/USD, AUD/JPY, EUR/AUD)
12:00 JPY Thomson Reuters IPSOS PCSI (USD/JPY, EUR/JPY, AUD/JPY)
12:00 CNY China Thomson Reuters IPSOS PCSI, Fixed Asset Investment, Industrial Production, Industrial Production YTD, Retail Sales, Retail Sales YTD, Unemployment Rate, NBS Press Conference (USD/CNH, AUD/CNH, CNH/JPY)
14:30 JPY Capacity Utilization, Industrial Production (USD/JPY, EUR/JPY, AUD/JPY)
17:00 CHF GDP (USD/CHF, EUR/CHF, CHF/JPY)
17:00 CNY FDI (USD/CNH, AUD/CNH, CNH/JPY)
18:30 HKD GDP (USD/HKD, EUR/HKD, AUD/HKD)
20:00 EUR ECOFIN Meetings, Reserve Assets Total (EUR/USD, EUR/JPY, EUR/GBP)
22:30 USD Core Retail Sales, Export Price Index, Import Price Index, NY Empire State Manufacturing Index, Retail Control, Retail Sales, Retail Sales Ex Gas/Autos (EUR/USD, USD/JPY, GBP/USD)
22:30 CAD Manufacturing Sales, New Motor Vehicle Sales, Wholesale Sales (USD/CAD, EUR/CAD, CAD/JPY)
23:15 USD Capacity Utilization Rate, Industrial Production, Manufacturing Production (EUR/USD, USD/JPY, GBP/USD)
00:00 USD Business Inventories, Michigan Inflation Expectations, Consumer Sentiment (EUR/USD, USD/JPY, GBP/USD)
View the full economic calendar
View the full economic calendar
-- Written by Matt Simpson
Follow Matt on Twitter @cLeverEdge
How to trade with City Index
You can trade with City Index by following these four easy steps:
- Open an account, or log in if you’re already a customer
• Open an account in the UK
• Open an account in Australia
• Open an account in Singapore
- Search for the market you want to trade in our award-winning platform
- Choose your position and size, and your stop and limit levels
- Place the trade
Related tags:
Latest market news



Open an account in minutes
Experience award-winning platforms with fast and secure execution, and enjoy tight spreads from 0.5 pts on FX and 0.3 pts on indices.
Economic calendar
Web Trader platform
Our sophisticated web-based platform is packed with features.
Related articles
British Pound Rallies into CPI as BoE Hike Bets Firm - GBP/USD, GBP/AUD
Sterling rallies ahead of UK inflation as BoE hike bets firm. GBP/USD tests resistance while GBP/AUD forms a potential bullish reversal.
GBP/USD Analysis: Sterling Gains Momentum After Employment Surprise
Over recent trading sessions, the British pound has begun to show a notable recovery. This can be observed in the performance of GBP/USD, which has gained more than 1.3% over the last four sessions, reflecting a consistent improvement in sterling's strength against the U.S. dollar.

US Dollar Price Action Setups: EUR/USD, GBP/USD, USD/JPY, USD/CAD
The US Dollar finished last week with a bearish engulf following a four-week winning streak. But the big question now is whether the Euro can pose any form of a recovery.

This report is intended for general circulation only. It should not be construed as a recommendation, or an offer (or solicitation of an offer) to buy or sell any financial products. The information provided does not take into account your specific investment objectives, financial situation or particular needs. Before you act on any recommendation that may be contained in this report, independent advice ought to be sought from a financial adviser regarding the suitability of the investment product, taking into account your specific investment objectives, financial situation or particular needs.
StoneX Financial Pte. Ltd., may distribute reports produced by its respective foreign entities or affiliates within the StoneX group of companies or third parties pursuant to an arrangement under Regulation 32C of the Financial Advisers Regulations. Where the report is distributed to a person in Singapore who is not an accredited investor, expert investor or an institutional investor (as defined in the Securities Futures Act), StoneX Financial Pte. Ltd. accepts legal responsibility to such persons for the contents of the report only to the extent required by law. Singapore recipients should contact StoneX Financial Pte. Ltd. at 6826 9988 for matters arising from, or in connection with the report.
In the case of all other recipients of this report, to the extent permitted by applicable laws and regulations neither StoneX Financial Pte. Ltd. nor its associated companies will be responsible or liable for any loss or damage incurred arising out of, or in connection with, any use of the information contained in this report and all such liability is hereby expressly disclaimed. No representation or warranty is made, express or implied, that the content of this report is complete or accurate.
StoneX Financial Pte. Ltd. is not under any obligation to update this report.
Trading CFDs carries a high level of risk that may not be suitable for some investors. Consider your investment objectives, level of experience, financial resources, risk appetite and other relevant circumstances carefully. The possibility exists that you could lose some or all of your investments, including your initial deposits. If in doubt, please seek independent expert advice. Visit www.forex.com/en-sg/terms-and-policies for the complete Risk Disclosure Statement.