






EUR/AUD Reversal Risk Builds as Bearish Momentum Aligns With Historical Tops
EUR/AUD may be on the verge of a reversal, with bearish divergence, false breakouts, and technical patterns pointing to potential downside ahead.
Share this:

EUR/AUD may be setting up for another significant reversal, mirroring historical peaks in 2008 and 2020. Recent technical developments—across monthly, weekly, and daily timeframes—point to growing downside risk for the euro against the Australian dollar. With momentum waning, false breakouts fading, and lower volatility paving the way for trend shifts, traders should be alert to potential bearish continuation patterns forming across this key cross.
View related analysis:
View related analysis:
Bearish Technical Signals Strengthen Case for EUR/AUD Reversal
Back in April, I highlighted how the surge in EUR/AUD resembled previous major market tops seen in 2008 and 2020. In both instances, the euro spiked sharply against the Australian dollar before giving up much of those gains by the end of the month—and we saw a similar reversal pattern unfold this April.
I still stand by that view: it seems more likely that EUR/AUD breaks beneath its April low before making a new high. Recent price action on lower timeframes also hints at a possible bearish inflection, with momentum faltering and divergence building.
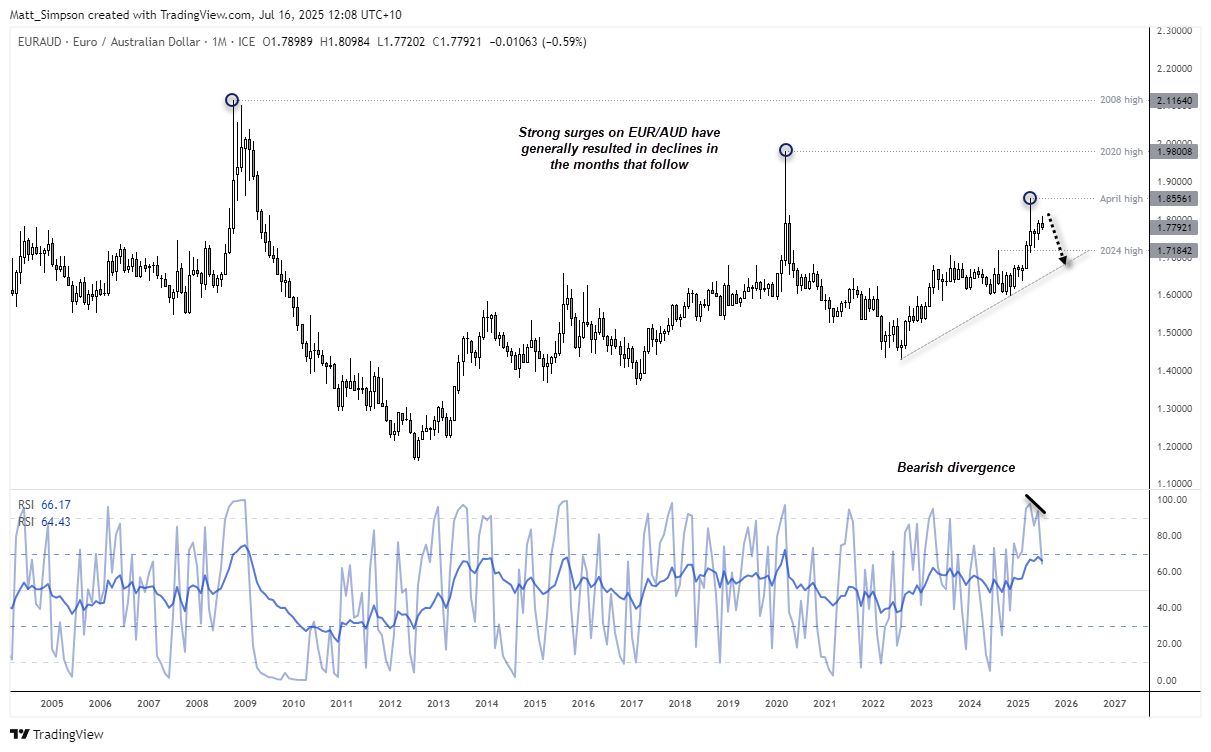
Chart analysis by Matt Simpson - data source: TradingView EUR/AUD
EUR/AUD Technical Analysis: Euro vs Australian Dollar Weekly Chart
The bearish engulfing candle that formed on EUR/AUD last week marked the largest high-to-low range in 10 weeks, suggesting a potential swing high against the Australian dollar. Crucially, this reversal followed a false breakout above the 1.08 handle—a previously flagged bullish target—adding further weight to the developing bearish bias for the euro.
Assuming last week’s price action concludes wave 'B' of an ABC correction, EUR/AUD may now be entering wave 'C'. If wave C mirrors wave A in length, the euro-to-Australian dollar rate could fall towards 1.6800. A more conservative scenario based on a 61.8% projection would target the May low at 1.7248, which also coincides with the 50% Fibonacci retracement level. Even a modest correction toward the 38.2% retracement brings the 1.7568 level into view.

Chart analysis by Matt Simpson - data source: TradingView EUR/AUD
EUR/AUD Technical Analysis: Euro vs Australian Dollar Daily Chart
EUR/AUD is currently consolidating just above the May trendline, and may continue to do so given the currently low levels of market volatility. For now, this range-bound behaviour offers bears two possible setups: fade into rallies towards the 1.7900 level with a stop above 1.8000, or wait for a confirmed break below last week’s low to assume bearish continuation—consistent with the broader bearish outlook from higher timeframes.

Chart analysis by Matt Simpson - data source: TradingView GBP/AUD
View the full economic calendar
View the full economic calendar
-- Written by Matt Simpson
Follow Matt on Twitter @cLeverEdge
How to trade with City Index
You can trade with City Index by following these four easy steps:
- Open an account, or log in if you’re already a customer
• Open an account in the UK
• Open an account in Australia
• Open an account in Singapore
- Search for the market you want to trade in our award-winning platform
- Choose your position and size, and your stop and limit levels
- Place the trade
Related tags:
Latest market news




Open an account in minutes
Experience award-winning platforms with fast and secure execution, and enjoy tight spreads from 0.5 pts on FX and 0.3 pts on indices.
Economic calendar
Web Trader platform
Our sophisticated web-based platform is packed with features.
Related articles
US CPI Preview: Follow the Fed and Look Past the Hot Headline
A 0.6% m/m reading in headline CPI, while scary at first glance, is already expected and presumably discounted into the current market prices. Instead, the “core” reading will be more impactful for the Fed and markets - see what it means for the US dollar!

Japanese Yen Short-term Outlook: USD/JPY Breakout Risk Builds Below 200-Day Average 10 13 2026
USD/JPY is trading in a narrow range beneath major resistance ahead of CPI, with the next breakout likely to set the near-term directional tone.

USD/CAD Forecast: Canadian Dollar Holds Firm as Markets Await U.S. CPI Data
The trading week continues to unfold and, for now, USD/CAD remains trapped in a relatively consistent phase of indecision. The Canadian dollar has managed to hold on to some of its recent strength, which can be seen in the pair's performance over the last two sessions, where it has declined by roughly 0.2%.

This report is intended for general circulation only. It should not be construed as a recommendation, or an offer (or solicitation of an offer) to buy or sell any financial products. The information provided does not take into account your specific investment objectives, financial situation or particular needs. Before you act on any recommendation that may be contained in this report, independent advice ought to be sought from a financial adviser regarding the suitability of the investment product, taking into account your specific investment objectives, financial situation or particular needs.
StoneX Financial Pte. Ltd., may distribute reports produced by its respective foreign entities or affiliates within the StoneX group of companies or third parties pursuant to an arrangement under Regulation 32C of the Financial Advisers Regulations. Where the report is distributed to a person in Singapore who is not an accredited investor, expert investor or an institutional investor (as defined in the Securities Futures Act), StoneX Financial Pte. Ltd. accepts legal responsibility to such persons for the contents of the report only to the extent required by law. Singapore recipients should contact StoneX Financial Pte. Ltd. at 6826 9988 for matters arising from, or in connection with the report.
In the case of all other recipients of this report, to the extent permitted by applicable laws and regulations neither StoneX Financial Pte. Ltd. nor its associated companies will be responsible or liable for any loss or damage incurred arising out of, or in connection with, any use of the information contained in this report and all such liability is hereby expressly disclaimed. No representation or warranty is made, express or implied, that the content of this report is complete or accurate.
StoneX Financial Pte. Ltd. is not under any obligation to update this report.
Trading CFDs carries a high level of risk that may not be suitable for some investors. Consider your investment objectives, level of experience, financial resources, risk appetite and other relevant circumstances carefully. The possibility exists that you could lose some or all of your investments, including your initial deposits. If in doubt, please seek independent expert advice. Visit www.forex.com/en-sg/terms-and-policies for the complete Risk Disclosure Statement.