


Australian Dollar Outlook: AUD/USD Mulls Pullback Despite RBA Hike Bets
AUD strength looks stretched as multiple crosses stall near resistance, leaving AUD/USD vulnerable to a pullback even as markets price an RBA hike.
Share this:

View related analysis:
View related analysis:
Australian Dollar Performance
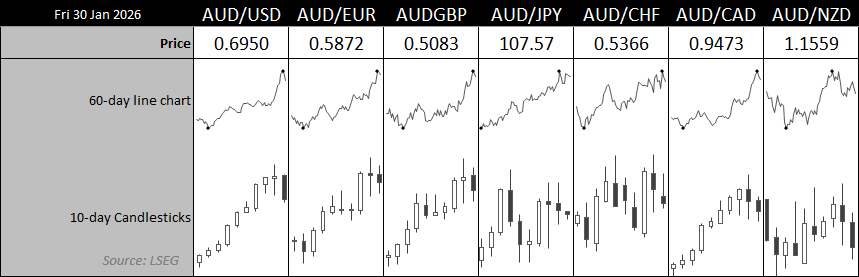
It has been a very strong start to the year for the Australian dollar overall. However, with several AUD crosses at or near resistance — or already retracing — it suggests any hawkish surprise from this week’s RBA meeting may already be priced in.
Source: LSEG
- AUD/USD snapped a nine-day winning streak on Friday, its strongest daily run in nine years
- AUD/CAD printed a weekly shooting star at the 2023 high, warning of potential trend exhaustion
- AUD/JPY formed an inside week and spinning-top doji, signalling hesitancy to break above the 2024 high near the 110 handle
- AUD/NZD retraced for a third consecutive week, though price action still looks corrective rather than a trend reversal
- EUR/AUD suffered its worst monthly decline in 3.5 years as the Aussie rose against the euro for a sixth straight week
- GBP/AUD fell to a 13-month low and closed decisively below 2.00
Australia This Week: Economic Data and Events for AUD/USD Traders
|
Date |
AEDT (GMT +11) |
Event |
|
Mon 2 Feb |
09:00 |
AU PMIs |
|
|
11:30 |
AU ANZ Job Advertisements (Jan) |
|
|
12:45 |
CN Caixin Manufacturing PMI (Jan) |
|
Tue 3 Feb |
01:45 |
US S&P Global Manufacturing PMI (Jan) |
|
|
02:00 |
US ISM Manufacturing Prices (Jan) |
|
|
04:30 |
FOMC Member Bostic Speaks |
|
|
11:30 |
AU Building Consents (MoM) (Dec) |
|
|
14:30 |
RBA Cash Rate Decision (No Change Expected), Monetary Policy Statement |
|
Wed 4 Feb |
00:00 |
FOMC Member Barkin Speaks |
|
|
01:40 |
FOMC Member Bowman Speaks |
|
|
02:00 |
JOLTS Job Openings |
|
|
16:10 |
RBA Assistant Governor Jones Speaks |
|
Thu 5 Feb |
00:15 |
US ADP Nonfarm Employment Change (Jan) |
|
|
02:00 |
US ISM Non-Manufacturing PMI (Jan) |
|
Fri 6 Feb |
00:30 |
Jobless Claims |
|
|
02:50 |
FOMC Member Bostic Speaks |
|
|
09:30 |
RBA Gov Bullock Speaks |
|
Sat 7 Feb |
00:30 |
US Nonfarm Payrolls (Jan) |
|
|
02:00 |
US Michigan Consumer Sentiment, Inflation Expectations (Feb) |
RBA Policy Outlook: Big Four Banks Brace for a Rate Hike
Over the past couple of weeks, Australia’s jobs report has beaten expectations while quarterly inflation landed broadly in line with consensus — the issue being that those estimates were already pitched at a higher inflation outcome. As a result, trimmed mean CPI rose to 3.3% y/y, remaining above the Reserve Bank of Australia’s 2–3% target band. That contrasts with the RBA’s November forecast, which pencilled in a moderation to 2.7% y/y by Q4.
Still, market reaction suggests positioning had leaned toward an even hotter inflation print, with the three-year yield falling 11bp following the release. Even so, economist forecasts and market pricing currently favour a 25bp hike on Tuesday, which would lift the cash rate to 3.85%.
RBA cash rate futures implied a 67% probability of a 25bp hike on Friday, and all Big Four banks have now updated their forecasts to expect tightening. While ANZ view a single 25bp move this week as “insurance” rather than the start of a sustained hiking cycle, NAB also expects a second 25bp hike in May, which would take the cash rate to 4.10%.
I may be left with egg on my face by Tuesday’s close, but my base case is that the RBA holds rates at 3.6% while delivering a clearly hawkish undertone. Even if the RBA does hike this week, it is difficult to see sufficient appetite for another move in May unless inflation re-accelerates in the late-April CPI report.
Take note that the RBA will also release its Monetary Policy Statement, including updated economic and inflation forecasts.


ISM, NFP and FOMC Speakers on Standby
The key risk from this week’s ISM and NFP reports is that they fail to soften enough to revive rate-cut discussions. That leaves markets exposed to upside surprises — and the potential for less-dovish commentary from FOMC members.
That risk is amplified by Friday’s rebound in the US dollar following confirmation that President Trump has nominated Kevin Warsh to replace Jerome Powell as Fed Chair. The dollar sell-off has now lost an important dovish narrative. Markets had assumed Trump would opt for a more rate-cut-friendly replacement, but Warsh has previously argued that the Fed was too loose during Covid.
If US data shows renewed resilience, Warsh could ultimately prove more inclined to keep rates higher for longer than Powell. That leaves the US dollar vulnerable to a broader rebound — a dynamic that could weigh on AUD/USD over the near term.
AUD/USD Futures Positioning | COT Report
Large speculators flipped to net-long exposure for the first time since December 2024. While net longs of 7.1k contracts are not a sentiment extreme, gross long exposure sits just below a nine-year high, warning of near-term crowding risk.
With signs already emerging that the Australian dollar rally is pausing for breath, AUD/USD could be vulnerable to further losses if this week’s RBA hike is viewed as a one-and-done — or if the RBA holds altogether. That said, potential inflection points in precious metals and the US dollar may prove to be the bigger drivers of any near-term retracement, before AUD/USD’s broader bullish trend resumes.
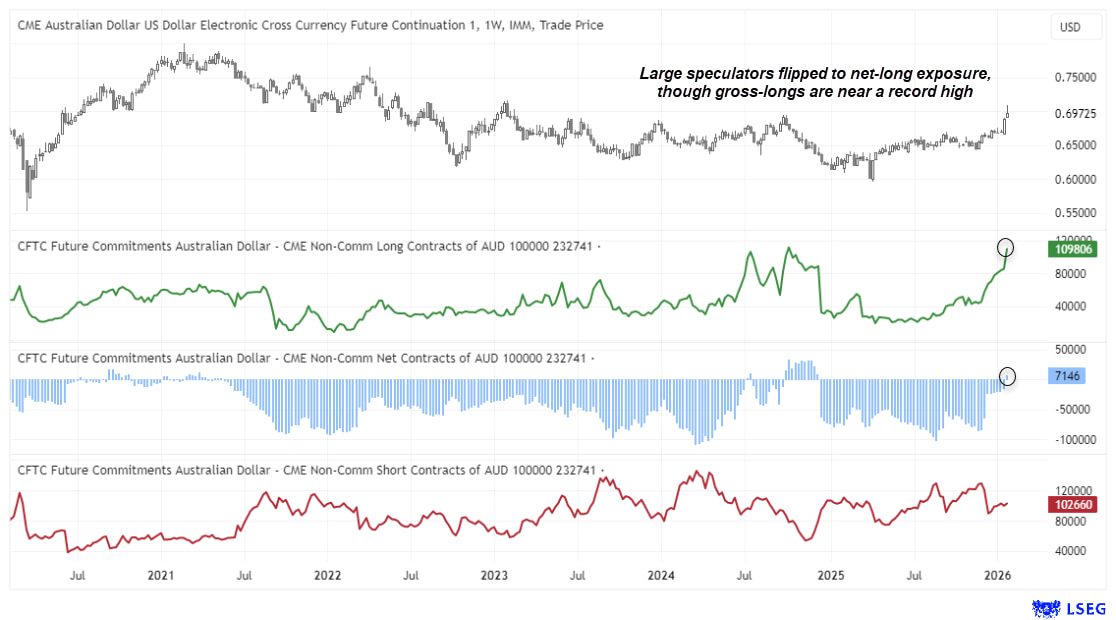
Chart prepared by Matt Simpson - Source: ABS, LSEG
AUD/USD Correlations

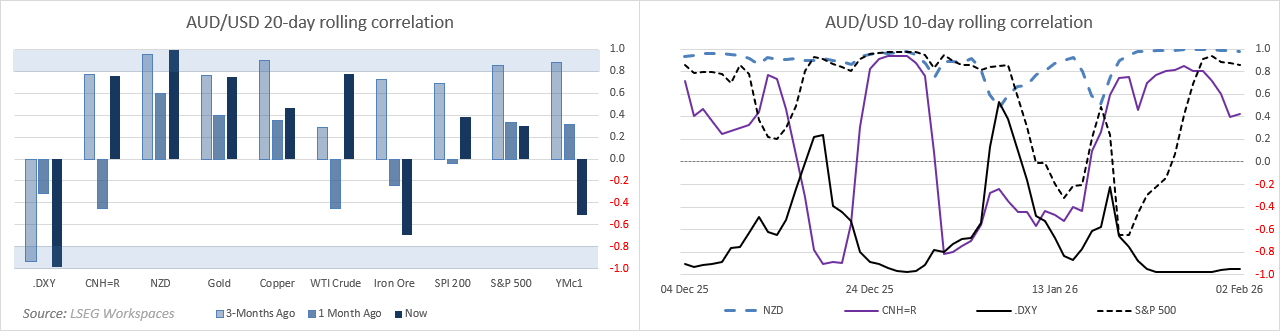
Chart prepared by Matt Simpson - Source: LSEG
AUD/USD Technical Analysis: Australian Dollar vs US Dollar
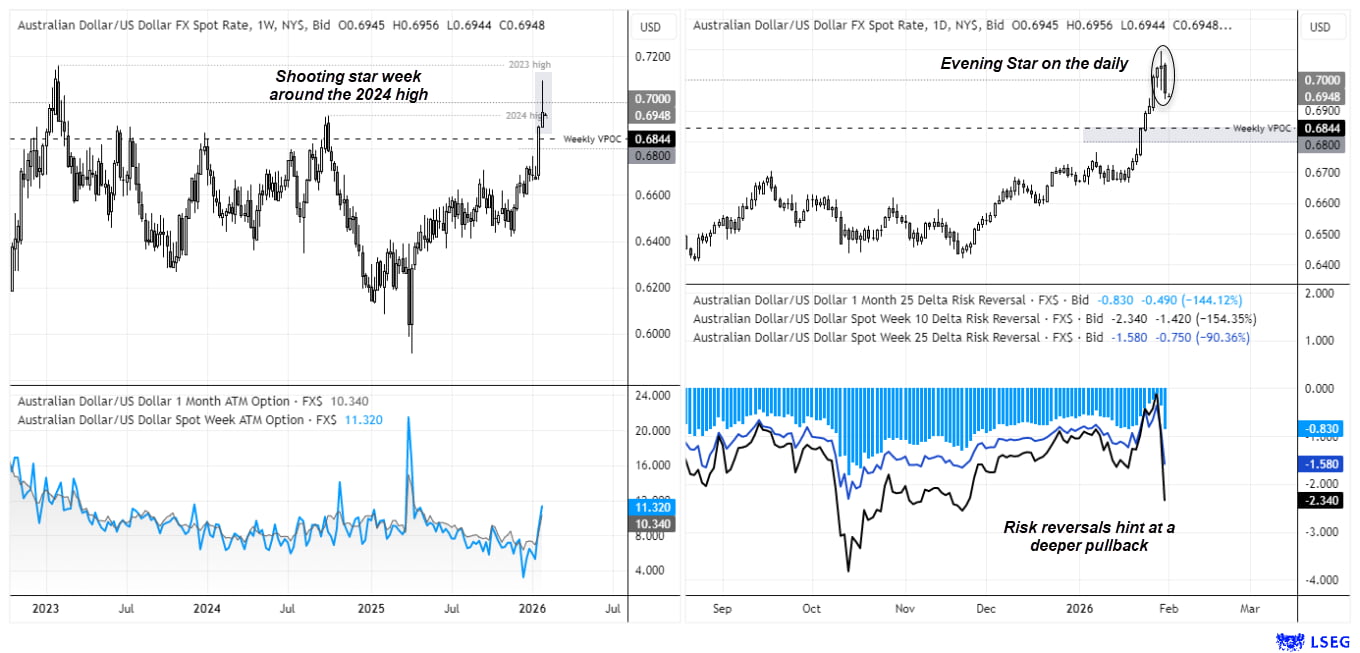
The sharp sell-off in gold and silver, alongside a late-week rebound in the US dollar index, has weighed on the Australian dollar. A shooting star formed on the AUD/USD weekly chart, while an evening star reversal appeared on the daily, with price closing back below 70c. With risk reversals pointing lower — as demand for puts rises relative to calls — a pullback now looks overdue.
The weekly VPOC just above the 68c handle stands out as a potential support zone for a modest near-term retracement. I doubt AUD/USD pushes down to 67c, but even if it did, the broader bullish trend would remain intact.
Ultimately, bulls are likely to view dips as opportunities, with scope for the Australian dollar to challenge 72c in the weeks ahead.
Source: LSEG
View the full economic calendar
View the full economic calendar
-- Written by Matt Simpson
Follow Matt on Twitter @cLeverEdge
How to trade with City Index
You can trade with City Index by following these four easy steps:
- Open an account, or log in if you’re already a customer
• Open an account in the UK
• Open an account in Australia
• Open an account in Singapore
- Search for the market you want to trade in our award-winning platform
- Choose your position and size, and your stop and limit levels
- Place the trade
Related tags:



Open an account in minutes
Experience award-winning platforms with fast and secure execution, and enjoy tight spreads from 0.5 pts on FX and 0.3 pts on indices.
Economic calendar
Web Trader platform
Our sophisticated web-based platform is packed with features.
Related articles
Australian Dollar Outlook: AUD/USD Screams Sentiment Extreme Into Fed, CPI
AUD/USD rebounds despite record bearish futures positioning, with Australian Q3 CPI and the Fed meeting threatening to trigger another short squeeze.

EUR/USD weekly outlook: FOMC and ECB to set the tone
The current backdrop is modestly bearish. On Friday, the EUR/USD closed modestly lower, down for the third consecutive day. The pair also posted a weekly decline after staging a modest recovery attempt in the previous week. Out of the past 8 weeks, the EUR/USD has fallen on 6 occasions. There is not much supporting factors for the single currency right now. So, the upside remains capped.


USD/JPY Forecast: Is Rising Japanese Inflation Supporting the Yen?
As the trading week comes to an end, one of the most relevant developments in the FX market has been the renewed strength of the Japanese yen. This can be seen in the recent performance of USD/JPY, which has fallen nearly 1.0% over the last two trading sessions, highlighting a meaningful recovery in the Japanese currency against the U.S. dollar.

This report is intended for general circulation only. It should not be construed as a recommendation, or an offer (or solicitation of an offer) to buy or sell any financial products. The information provided does not take into account your specific investment objectives, financial situation or particular needs. Before you act on any recommendation that may be contained in this report, independent advice ought to be sought from a financial adviser regarding the suitability of the investment product, taking into account your specific investment objectives, financial situation or particular needs.
StoneX Financial Pte. Ltd., may distribute reports produced by its respective foreign entities or affiliates within the StoneX group of companies or third parties pursuant to an arrangement under Regulation 32C of the Financial Advisers Regulations. Where the report is distributed to a person in Singapore who is not an accredited investor, expert investor or an institutional investor (as defined in the Securities Futures Act), StoneX Financial Pte. Ltd. accepts legal responsibility to such persons for the contents of the report only to the extent required by law. Singapore recipients should contact StoneX Financial Pte. Ltd. at 6826 9988 for matters arising from, or in connection with the report.
In the case of all other recipients of this report, to the extent permitted by applicable laws and regulations neither StoneX Financial Pte. Ltd. nor its associated companies will be responsible or liable for any loss or damage incurred arising out of, or in connection with, any use of the information contained in this report and all such liability is hereby expressly disclaimed. No representation or warranty is made, express or implied, that the content of this report is complete or accurate.
StoneX Financial Pte. Ltd. is not under any obligation to update this report.
Trading CFDs carries a high level of risk that may not be suitable for some investors. Consider your investment objectives, level of experience, financial resources, risk appetite and other relevant circumstances carefully. The possibility exists that you could lose some or all of your investments, including your initial deposits. If in doubt, please seek independent expert advice. Visit www.forex.com/en-sg/terms-and-policies for the complete Risk Disclosure Statement.