


The US Dollar’s Demise Could Just Be Getting Started
The US dollar is sliding into key support. While a short-term bounce is possible, structure and positioning point to a deeper breakdown ahead.
Share this:

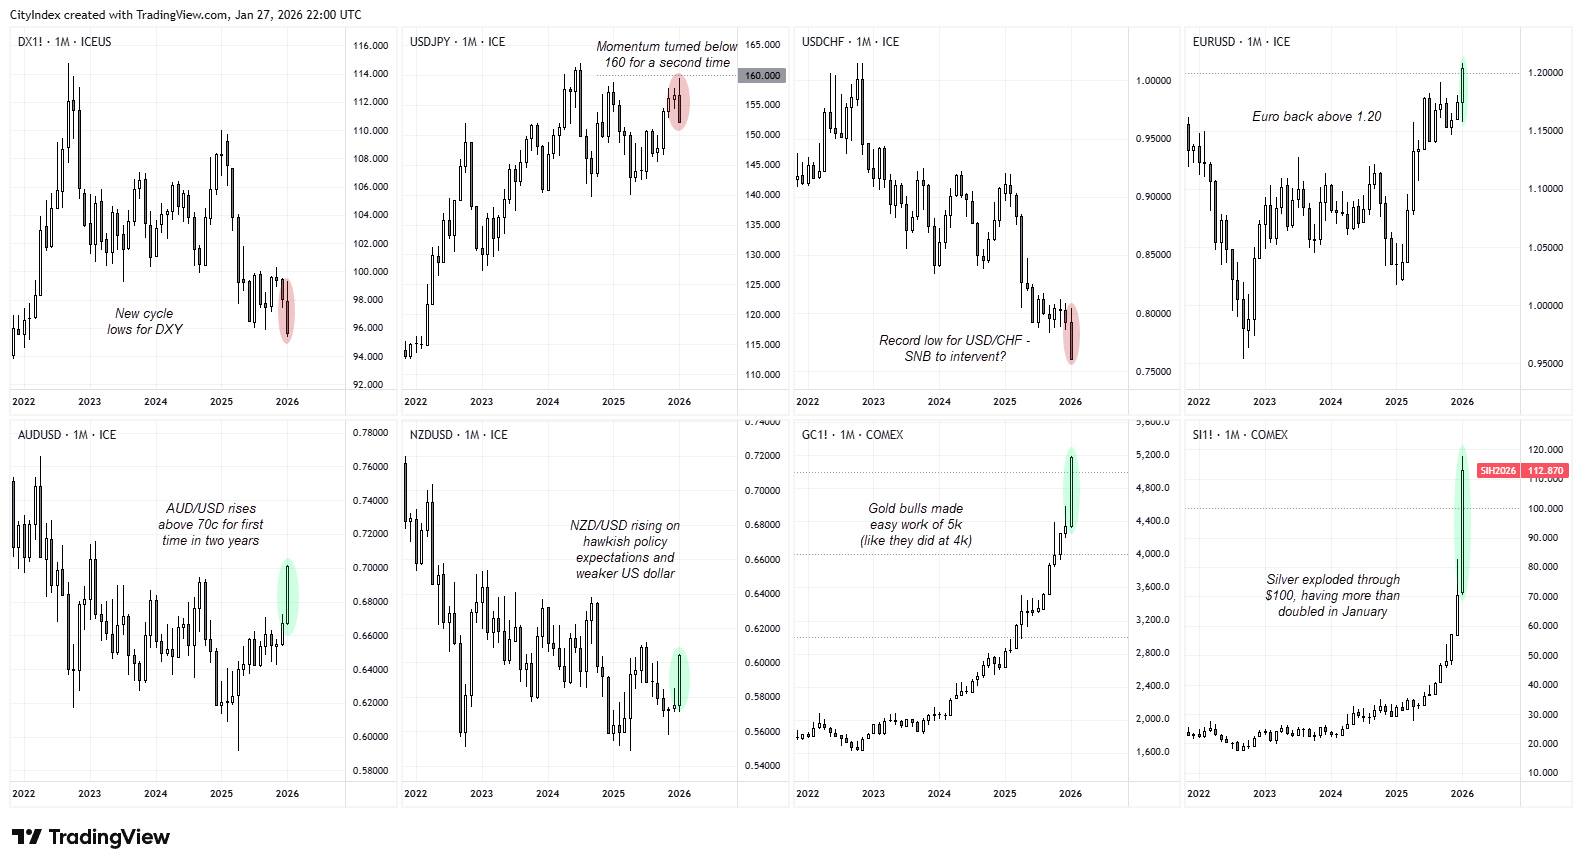
Anyone expecting a calm start to the year has been in for a surprise. The US dollar is on track for its third consecutive monthly decline, with a high-to-low range of nearly 4% — its most volatile month in six. Inflation expectations have remained firm while growth momentum has softened, preventing a meaningful lift in real yields despite higher nominal rates. With markets increasingly questioning how long the Fed can remain restrictive, the foundations of US growth exceptionalism are eroding rapidly.
View related analysis:
- US Dollar Rebound Appears Corrective, EUR/USD And GBPUSD Set To Bounce?
- Silver Outlook: Volatility Tests Bulls in Early 2026
- Australian Dollar Outlook: AUD/USD Surges as Risk Appetite Returns Ahead of AU CPI
Source: TradingView, ICE, COMEX
- Gold has broken above $5,000 and is up 18.5% for the month at the time of writing, though that pales in comparison to silver’s 56% rally over the same period.
- USD/JPY has sharply reversed from its highs before it could test the elusive 160 handle, fuelling speculation around currency intervention, although this has not been backed up by data.
- The Swiss franc is trading near a record low, down 5.4% from January’s high, potentially leaving it vulnerable to intervention from the SNB.
- EUR/USD is on track for its best month in seven and is trading above 1.12.
However, it is the antipodean commodity currencies that are leading the pack this month, with both the Australian and New Zealand dollars up around 5% against the US dollar. Pressure on the RBA to hike is rising, and some reports suggest the RBNZ could hike as early as May. While a weaker US dollar and shifting monetary policy expectations have been key drivers behind the strength in AUD/USD and NZD/USD, the rally in base metals has also provided support.


Why the US Dollar’s Breakdown Has Been Years in the Making
US Dollar Breakdown Signals Were Years in the Making
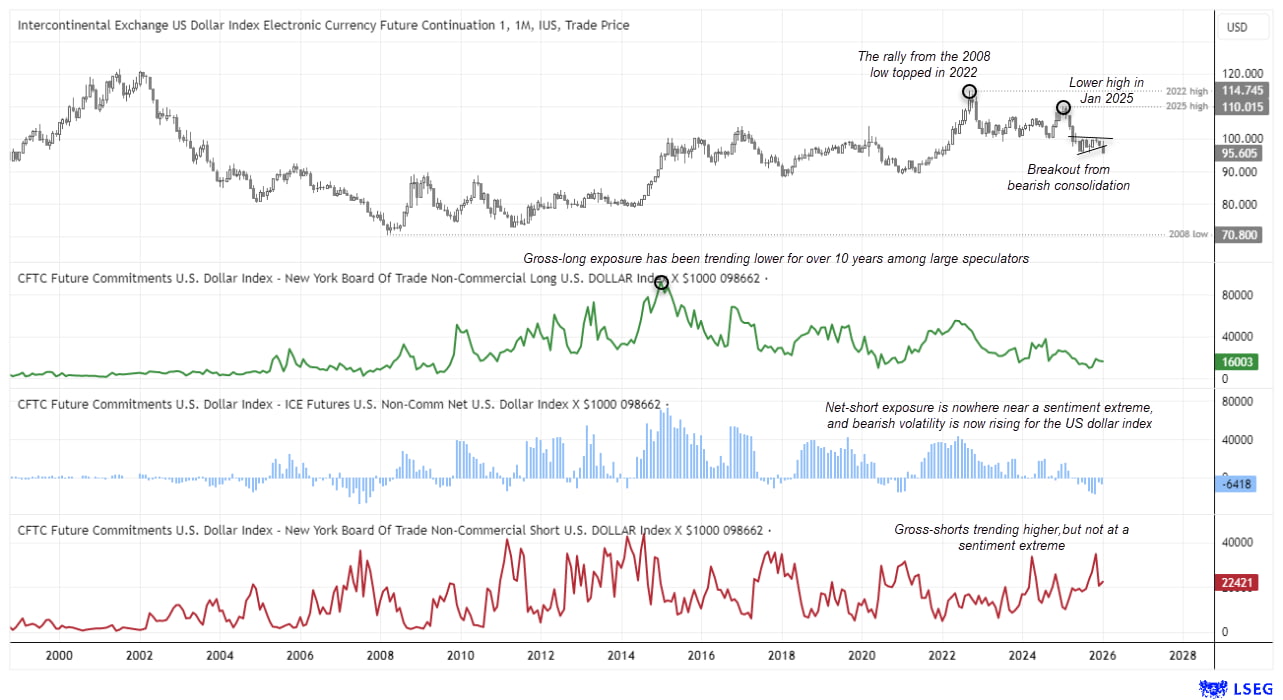
I have been warning of a breakdown in the US dollar for several months, based predominantly on technical factors. I argued that the dollar’s multi-year rally from the 2008 low topped in 2022, and that the sharp sell-off from the January 2025 high was an impulsive move that realigned momentum with the broader bear trend from the 2022 peak. As a result, the rebound from the June lows was viewed as a bearish correction, and prices have now broken lower from that structure, placing the dollar on the brink of multi-year lows.
Source: CFTC, IMM, CME, LSEG
Net-Long USD Exposure Has Been Unwinding Since 2014
The slide in the US dollar has also not occurred without warning from market positioning. Net-long exposure has been trending lower since peaking in 2014, driven primarily by a steady reduction in gross-long positions. Traders have been net-short for several weeks without reaching a sentiment extreme, while gross-short exposure continues to build.
Politics and Policy Bias Favour a Weaker US Dollar
So while the US dollar may appear oversold on lower timeframes, I suspect there is considerably more downside ahead. Positioning is not stretched, it has been signalling a fading bullish appetite for years, and President Trump likely wants — and may ultimately get — a weaker US dollar alongside a more dovish Federal Reserve. This sell-off could have much further to run, with attention now turning to a decisive break below the June low.


US Dollar Index (DXY) Technical Analysis
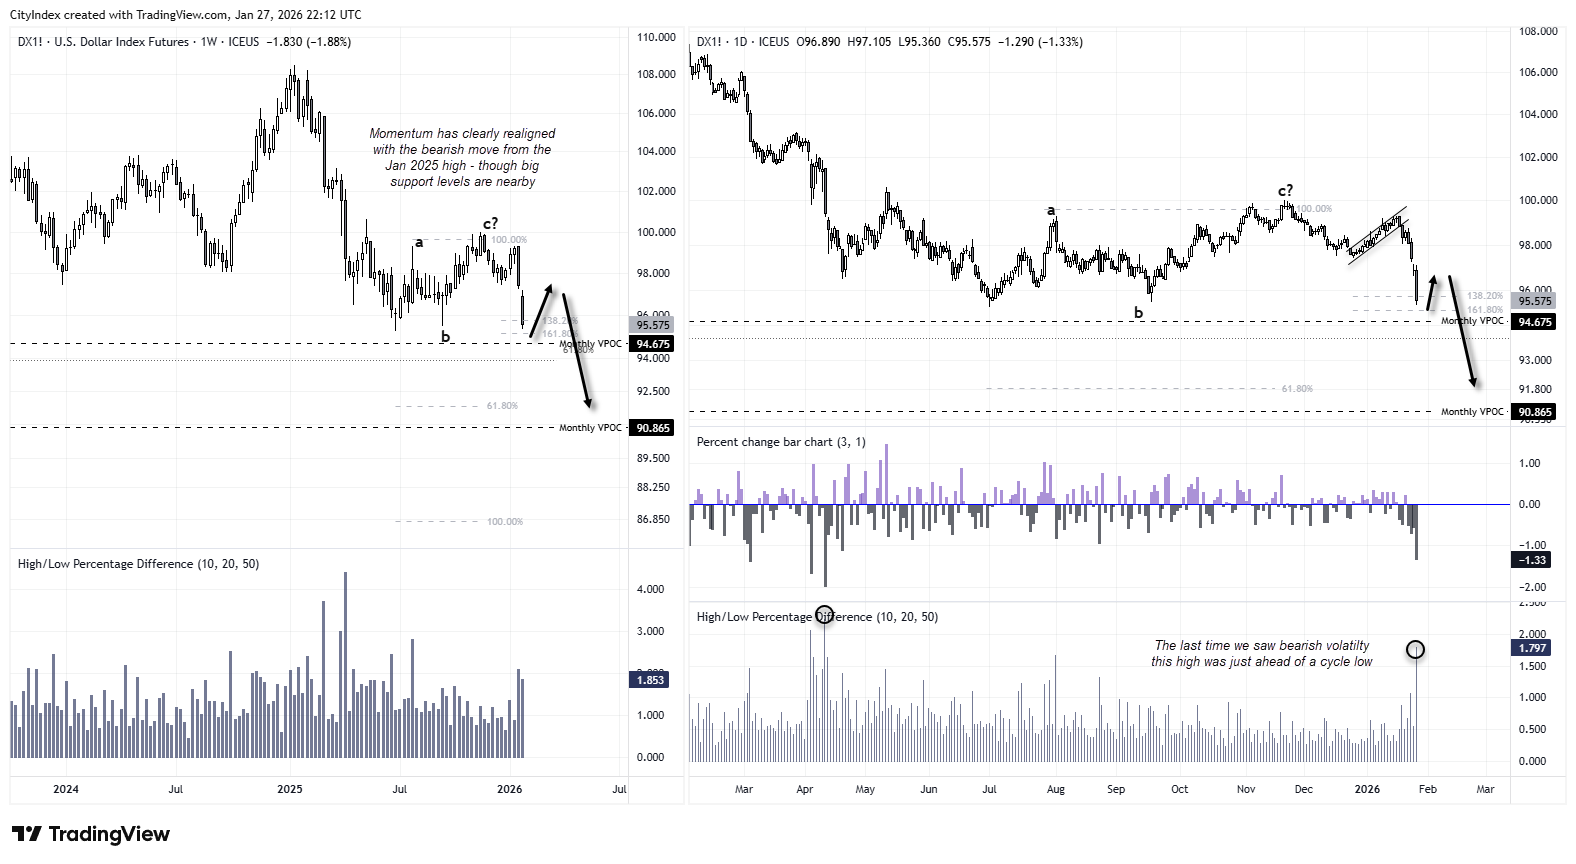
The US dollar index could be heading towards 90 at a minimum, given the recent pickup in bearish volatility. A monthly VPOC sits at 90.86, with the 61.8% Fibonacci projection at 91.81. If the wheels truly come off, the 100% projection lies at 86.85, with the 138.2% extension just below 82.
However, bears should tread carefully given the heavy support clustered around 94, including the long-term 38.2% Fibonacci retracement, a monthly VPOC at 94.67, and the June low. Also note on the daily chart that the last time bearish volatility reached similar levels, a swing low soon followed before losses resumed. Tuesday’s low also landed between the 138.2% and 161.8% Fibonacci projections, reinforcing the risk of near-term two-way volatility.
That said, any bounce is likely to be viewed as a selling opportunity, with bears expected to fade rallies and ultimately push the US dollar index below 94.
Source: ICE, TradingView
View the full economic calendar
View the full economic calendar
-- Written by Matt Simpson
Follow Matt on Twitter @cLeverEdge
How to trade with City Index
You can trade with City Index by following these four easy steps:
- Open an account, or log in if you’re already a customer
• Open an account in the UK
• Open an account in Australia
• Open an account in Singapore
- Search for the market you want to trade in our award-winning platform
- Choose your position and size, and your stop and limit levels
- Place the trade
Related tags:



Open an account in minutes
Experience award-winning platforms with fast and secure execution, and enjoy tight spreads from 0.5 pts on FX and 0.3 pts on indices.
Economic calendar
Web Trader platform
Our sophisticated web-based platform is packed with features.
Related articles
Australian Dollar Outlook: AUD/USD Screams Sentiment Extreme Into Fed, CPI
AUD/USD rebounds despite record bearish futures positioning, with Australian Q3 CPI and the Fed meeting threatening to trigger another short squeeze.

EUR/USD weekly outlook: FOMC and ECB to set the tone
The current backdrop is modestly bearish. On Friday, the EUR/USD closed modestly lower, down for the third consecutive day. The pair also posted a weekly decline after staging a modest recovery attempt in the previous week. Out of the past 8 weeks, the EUR/USD has fallen on 6 occasions. There is not much supporting factors for the single currency right now. So, the upside remains capped.


USD/JPY Forecast: Is Rising Japanese Inflation Supporting the Yen?
As the trading week comes to an end, one of the most relevant developments in the FX market has been the renewed strength of the Japanese yen. This can be seen in the recent performance of USD/JPY, which has fallen nearly 1.0% over the last two trading sessions, highlighting a meaningful recovery in the Japanese currency against the U.S. dollar.

This report is intended for general circulation only. It should not be construed as a recommendation, or an offer (or solicitation of an offer) to buy or sell any financial products. The information provided does not take into account your specific investment objectives, financial situation or particular needs. Before you act on any recommendation that may be contained in this report, independent advice ought to be sought from a financial adviser regarding the suitability of the investment product, taking into account your specific investment objectives, financial situation or particular needs.
StoneX Financial Pte. Ltd., may distribute reports produced by its respective foreign entities or affiliates within the StoneX group of companies or third parties pursuant to an arrangement under Regulation 32C of the Financial Advisers Regulations. Where the report is distributed to a person in Singapore who is not an accredited investor, expert investor or an institutional investor (as defined in the Securities Futures Act), StoneX Financial Pte. Ltd. accepts legal responsibility to such persons for the contents of the report only to the extent required by law. Singapore recipients should contact StoneX Financial Pte. Ltd. at 6826 9988 for matters arising from, or in connection with the report.
In the case of all other recipients of this report, to the extent permitted by applicable laws and regulations neither StoneX Financial Pte. Ltd. nor its associated companies will be responsible or liable for any loss or damage incurred arising out of, or in connection with, any use of the information contained in this report and all such liability is hereby expressly disclaimed. No representation or warranty is made, express or implied, that the content of this report is complete or accurate.
StoneX Financial Pte. Ltd. is not under any obligation to update this report.
Trading CFDs carries a high level of risk that may not be suitable for some investors. Consider your investment objectives, level of experience, financial resources, risk appetite and other relevant circumstances carefully. The possibility exists that you could lose some or all of your investments, including your initial deposits. If in doubt, please seek independent expert advice. Visit www.forex.com/en-sg/terms-and-policies for the complete Risk Disclosure Statement.