


US Dollar Rebound Appears Corrective, EUR/USD And GBPUSD Set To Bounce?
The US dollar’s rebound looks corrective, with positioning still net short while EUR/USD and GBP/USD approach key support levels hinting at near-term upside.
Share this:

The US dollar’s rebound continues to look corrective rather than a new uptrend. Commitment of Traders (COT) data shows large speculators and asset managers remain net short, with limited evidence of fresh buying. Meanwhile, EUR/USD and GBP/USD are testing key technical supports, raising the odds of near-term bounces as the greenback’s momentum stalls near resistance around 100.
View related analysis:
View related analysis:
US Dollar Rebound Appears Corrective, EUR/USD and GBP/USD Eye Upside Reversal
If we stand back to view the bigger picture for the US dollar, the weekly chart shows that the current ‘rebound’ is dwarfed by the sell-off that preceded it. That said, the 12.1% decline from the January high to the June low was due a pause for breath, given it marked the dollar’s largest fall since the 2022 peak.
My base case is for inflation to continue tapering and for employment data (once it becomes available again) to soften further, allowing the Fed to maintain its easing cycle into 2026. I’m not anticipating a hard landing, but that scenario could still be enough to keep dollar rallies capped, see momentum turn lower again, and support a Wall Street recovery into at least Q1 or Q2.
I suspect we’re witnessing the wave ‘C’ of an ABC correction and its high should peter out below 100. Should this rally extend, perhaps the dollar could be headed for 102 before bearish momentum truly returns.
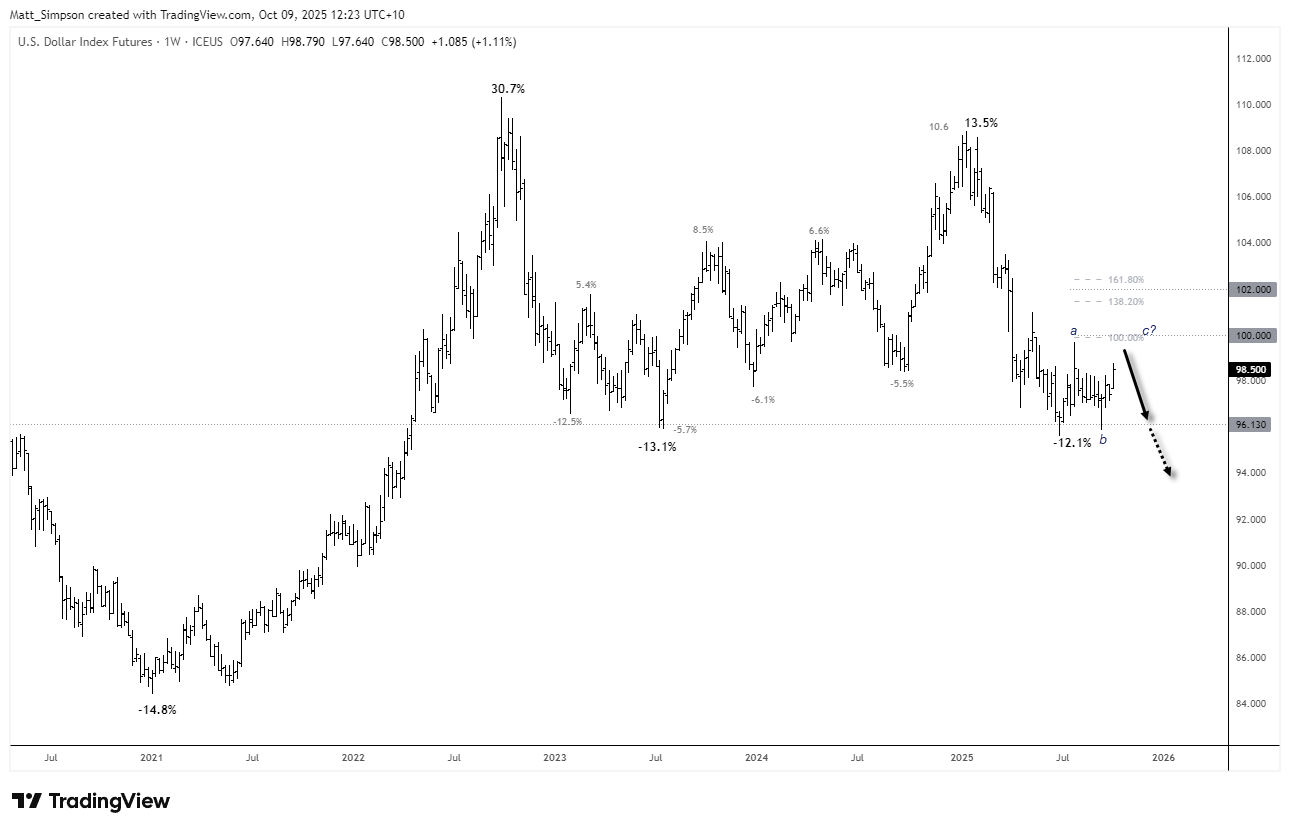
Chart analysis by Matt Simpson - data source: TradingView U.S. Dollar Index Futures


US Dollar Positioning (IMM Data): Weekly COT Report Analysis
While momentum for the US dollar index points higher, it has not been fully backed by market positioning in the latest Commitment of Traders (COT) report. Large speculators and managed funds remain net short, and recent weeks have actually seen them increase their gross-short exposure — not the behaviour typically seen during a genuine rebound.
Moreover, gross-long positions remain subdued. Asset managers were long by just 2k contracts, while large speculators added +1.5k contracts (12.4%) to reach 14k — still low by historical standards.
The dollar’s rise appears to be driven by short-covering as the government shutdown limits new economic data and prompts the unwinding of bearish bets. Until we see a meaningful pickup in fresh buying, USD bears may simply be waiting to reload at higher levels.
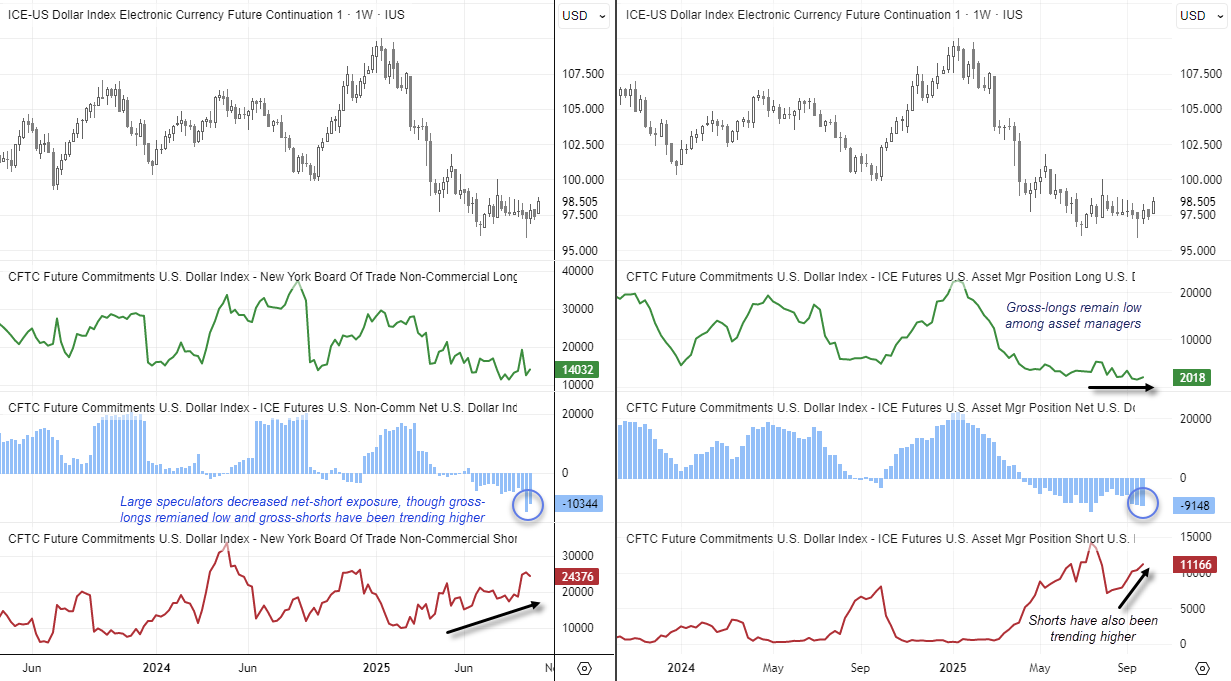
Chart analysis by Matt Simpson - data source: TradingView
US Dollar Index (DXY) Technical Analysis
The daily chart shows that the dollar’s rally has stalled around the 61.8% Fibonacci projection level. The daily RSI (2) reached overbought territory at yesterday’s close, signalling the potential for a near-term cycle high. However, with the RSI (14) trending higher alongside price and showing no bearish divergence, dips in the US dollar are likely to find buyers for now.
I’ll reassess the potential for a cycle high if the rally approaches the key resistance zone around 100.00, which aligns with the August swing high and the 100% projection level.
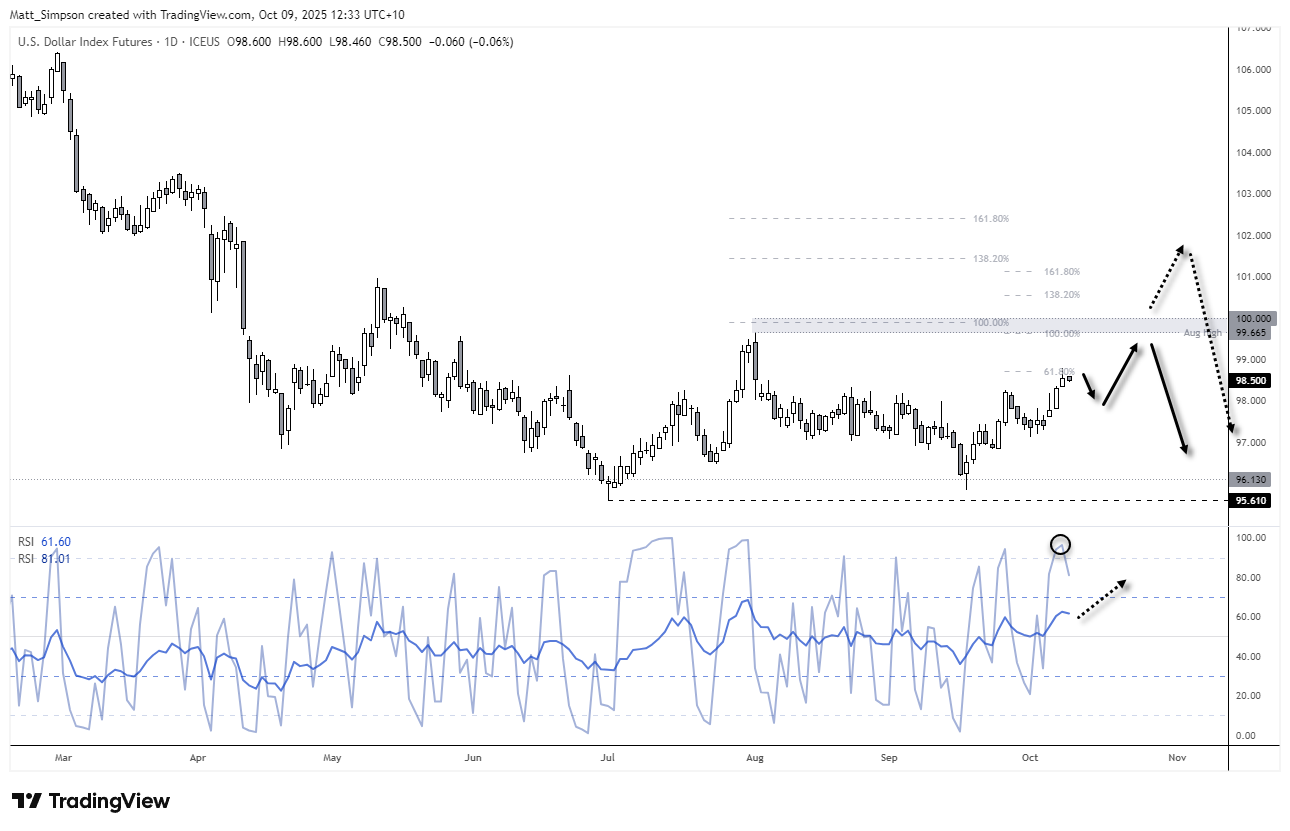
Chart analysis by Matt Simpson - data source: TradingView U.S. Dollar Index Futures


EUR/USD, GBP/USD Technical Analysis
We can’t really discuss the US dollar without mentioning EUR/USD, given the euro accounts for just under 60% of the USD Index weighting. It’s therefore worth noting that EUR/USD has so far held above 1.1160, though even a break beneath it could see prices find support and stage a bounce from the 100-day EMA and weekly VPOC near 1.1572. The daily RSI (2) also closed in oversold territory yesterday, hinting that a rebound could be near.
The British pound is also nearing a key support zone just above 1.3300. GBP/USD has formed two prominent swing lows in September, with price now attempting to hold above the June–July low around 1.3370. Given the potential for the US dollar’s rebound to pause, I suspect risks are tilted to the upside for both EUR/USD and GBP/USD in the near term.

Chart analysis by Matt Simpson - data source: TradingView EUR/USD, GBP/USD
View the full economic calendar
View the full economic calendar
-- Written by Matt Simpson
Follow Matt on Twitter @cLeverEdge
How to trade with City Index
You can trade with City Index by following these four easy steps:
- Open an account, or log in if you’re already a customer
• Open an account in the UK
• Open an account in Australia
• Open an account in Singapore
- Search for the market you want to trade in our award-winning platform
- Choose your position and size, and your stop and limit levels
- Place the trade
Related tags:
Latest market news




Open an account in minutes
Experience award-winning platforms with fast and secure execution, and enjoy tight spreads from 0.5 pts on FX and 0.3 pts on indices.
Economic calendar
Web Trader platform
Our sophisticated web-based platform is packed with features.
Related articles
US Dollar Bulls Hold Firm, but Euro Warns of Squeeze Risk | COT Report
US dollar bulls remain firmly positioned, but record euro shorts have failed to break EUR/USD support, raising the risk of a short-covering rally.
USD/CAD reversal risk builds as central bank showdown looms
USD/CAD has delivered a bullish reversal signal from established support, just as traders prepare for Fed and BoC decisions. Aggressive Canadian rate hike expectations and conflicting momentum signals make the coming session important.

Australian Dollar Outlook: AUD/USD Screams Sentiment Extreme Into Fed, CPI
AUD/USD rebounds despite record bearish futures positioning, with Australian Q3 CPI and the Fed meeting threatening to trigger another short squeeze.
This report is intended for general circulation only. It should not be construed as a recommendation, or an offer (or solicitation of an offer) to buy or sell any financial products. The information provided does not take into account your specific investment objectives, financial situation or particular needs. Before you act on any recommendation that may be contained in this report, independent advice ought to be sought from a financial adviser regarding the suitability of the investment product, taking into account your specific investment objectives, financial situation or particular needs.
StoneX Financial Pte. Ltd., may distribute reports produced by its respective foreign entities or affiliates within the StoneX group of companies or third parties pursuant to an arrangement under Regulation 32C of the Financial Advisers Regulations. Where the report is distributed to a person in Singapore who is not an accredited investor, expert investor or an institutional investor (as defined in the Securities Futures Act), StoneX Financial Pte. Ltd. accepts legal responsibility to such persons for the contents of the report only to the extent required by law. Singapore recipients should contact StoneX Financial Pte. Ltd. at 6826 9988 for matters arising from, or in connection with the report.
In the case of all other recipients of this report, to the extent permitted by applicable laws and regulations neither StoneX Financial Pte. Ltd. nor its associated companies will be responsible or liable for any loss or damage incurred arising out of, or in connection with, any use of the information contained in this report and all such liability is hereby expressly disclaimed. No representation or warranty is made, express or implied, that the content of this report is complete or accurate.
StoneX Financial Pte. Ltd. is not under any obligation to update this report.
Trading CFDs carries a high level of risk that may not be suitable for some investors. Consider your investment objectives, level of experience, financial resources, risk appetite and other relevant circumstances carefully. The possibility exists that you could lose some or all of your investments, including your initial deposits. If in doubt, please seek independent expert advice. Visit www.forex.com/en-sg/terms-and-policies for the complete Risk Disclosure Statement.