



US Dollar Price Action Setups: EUR/USD, USD/JPY
The US Dollar broke out to a fresh yearly high after the CPI report, and that Dollar strength was on full view in pretty much all major pairings with a particular push in EUR/USD.
Share this:

US Dollar Talking Points:
- The US Dollar hit a fresh yearly high last week as stronger CPI drove higher expectations for US rate hikes.
- EUR/USD looked to be in meltdown mode and USD/JPY is bristling for another breakout around the 160.00 level. Perhaps one of the more bearish factors for the USD is the prospect of pullback in USD/JPY produced by intervention threats, but actual interventions at this stage don’t seem to make as much sense so those drives would probably be more pullback-related than reversal.
- I looked into each of these markets in the Tuesday webinar and below I look at updated charts after another few days of price action.
I covered this in-depth in the Tuesday webinar and I even started off the chart analysis with the weekly chart of the USD, as it’s from this view that you can get great perspective on big picture themes. And while sellers had an open door to make a push in the Greenback over the past few weeks, starting with a bearish engulf formation five weeks ago and then four consecutive weeks of testing at the 101.80 support level, bulls simply would not let go. And as pullbacks were bid, that bearish drive around the Dollar simply lost its momentum until this week brought a strong slingshot move into the mix.
US Dollar Weekly Chart – Bearish Failure, Bullish Run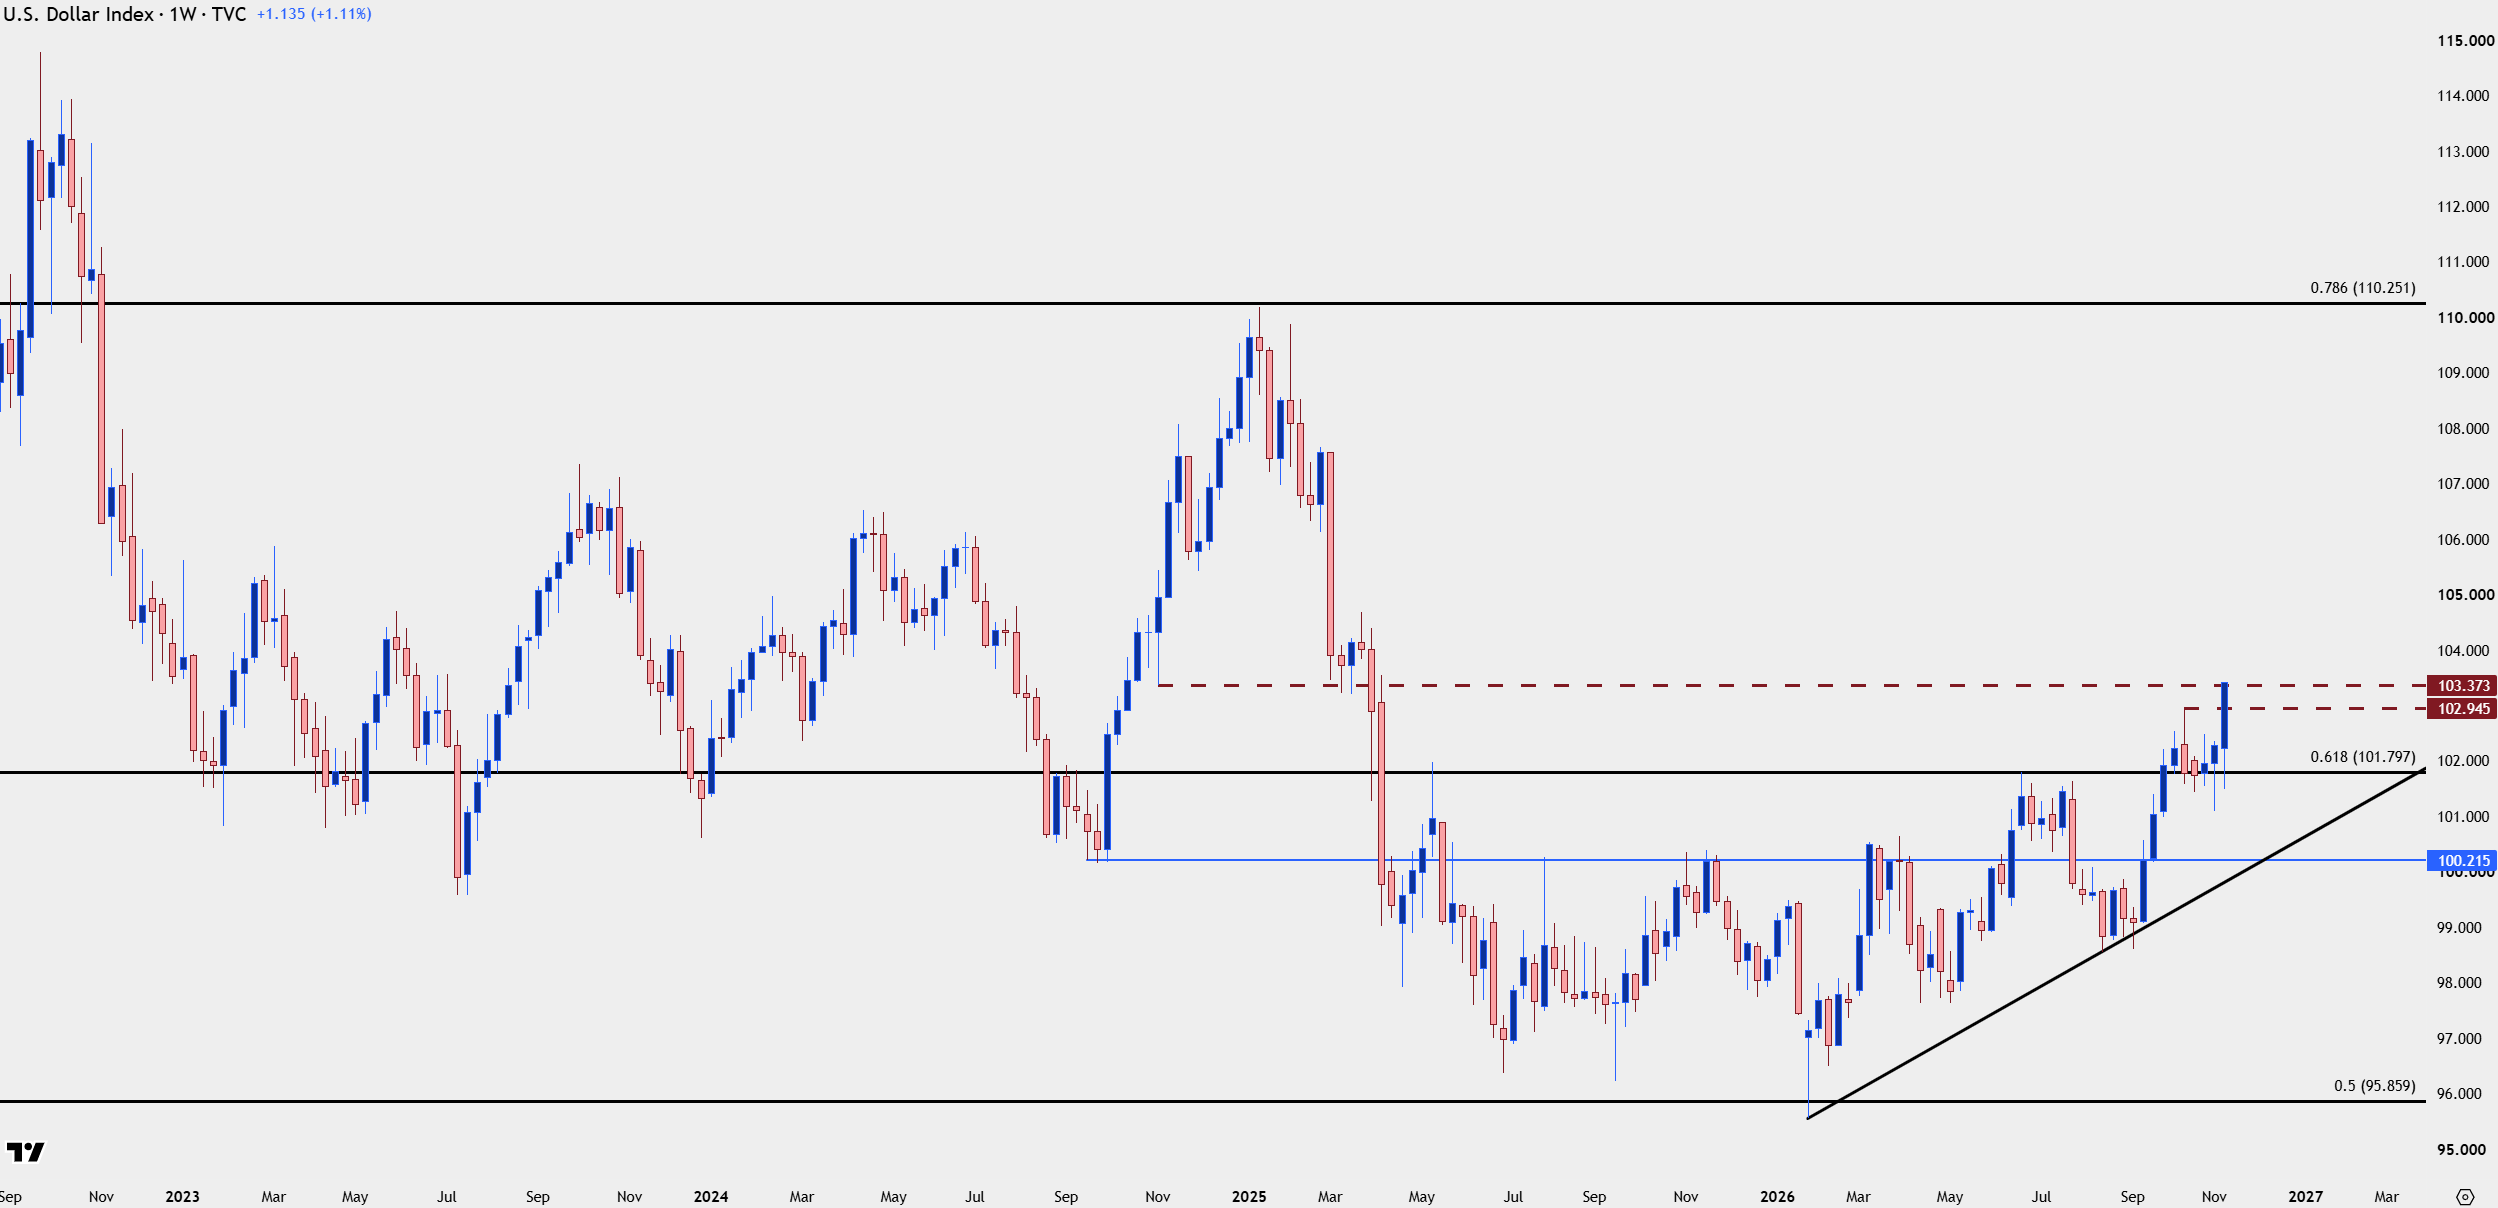
Chart prepared by James Stanley; data derived from Tradingview
USD Daily
With four consecutive days of strong gains the currency now rests just above a longer-term resistance level as looked at above. Prior resistance now sets the stage for higher-low support potential, taken from around the 102.95 level, with the 102.50 level below that. And if both levels are taken out, then likely something has shifted in the backdrop and from this point, my guess would be a bearish move in USD/JPY driving larger capital flows through the FX market.
US Dollar Daily Price Chart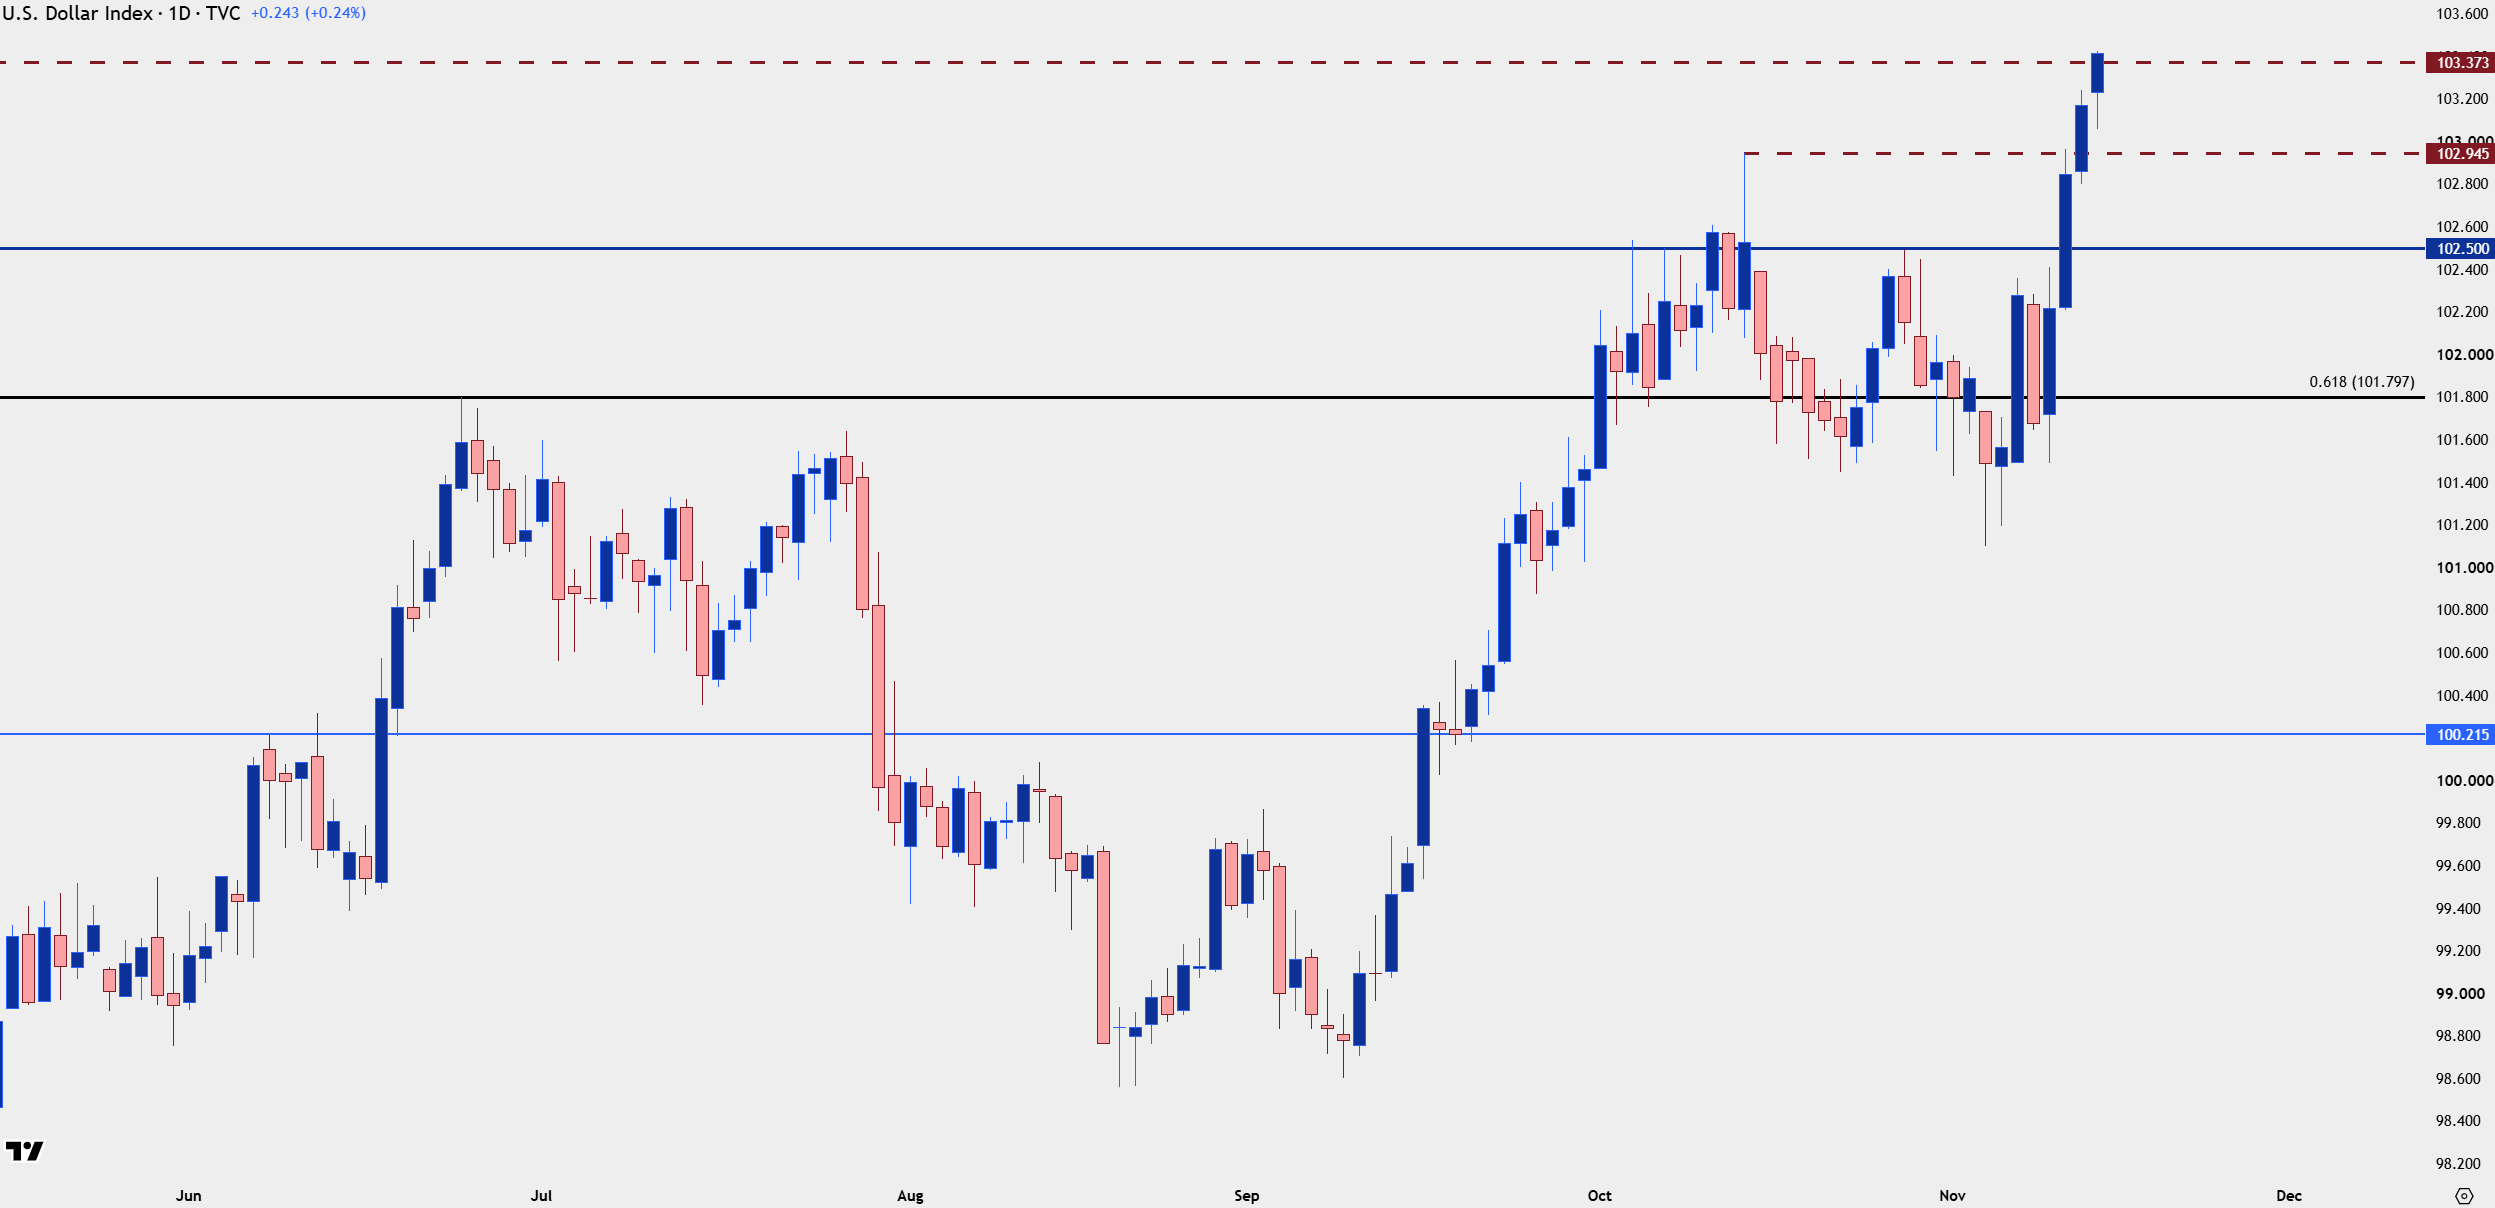
Chart prepared by James Stanley; data derived from Tradingview
EUR/USD
Again drawing back to the weekly chart we can get a great view of the bigger picture motive in the world’s largest currency pair. Bulls had an open door to make a push for the past five weeks and seemingly failed to do so. This was a centerpiece of the Tuesday webinar, as I highlighted the 1.1000 level as the next major level lower, with the 1.0943 level below that.
The move has materialized quite quickly since then.
EUR/USD Weekly Price Chart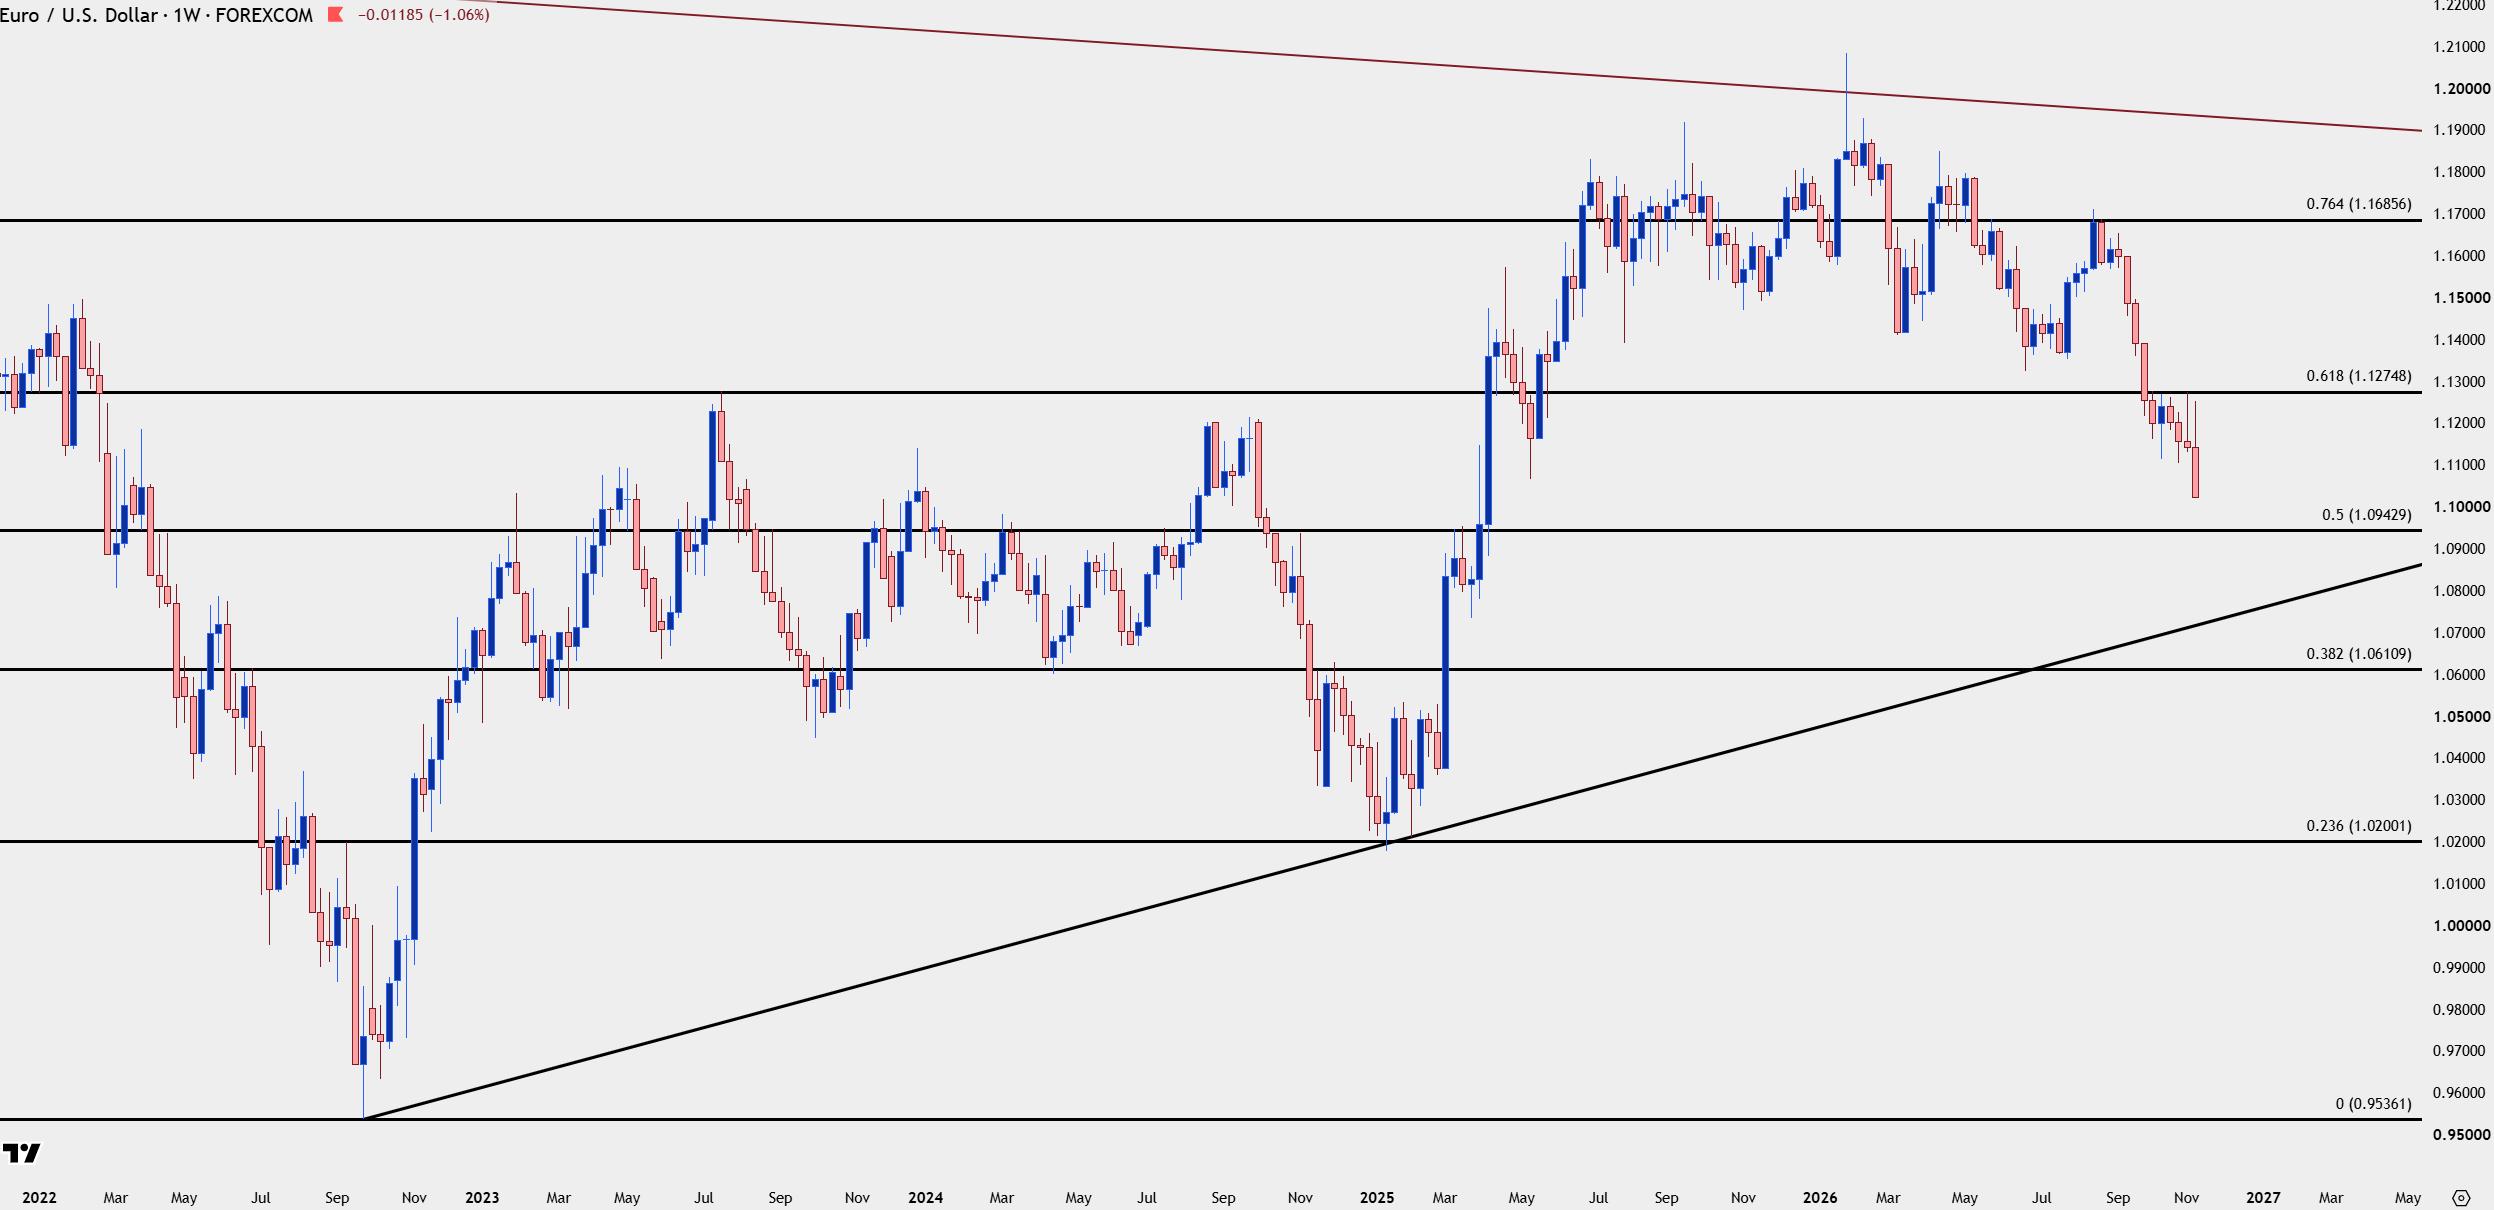
Chart prepared by James Stanley; data derived from Tradingview
EUR/USD Daily
With the 1.1000 now already nearby, it’s the prior support at 1.1113 that stands out for lower-high potential on pullbacks in EUR/USD. Above that, it’s rather messy, but the Fibonacci level at 1.1275 level that stands out as this was prior resistance and, thus, can serve as a form of invalidation for bearish trends.
EUR/USD Daily Chart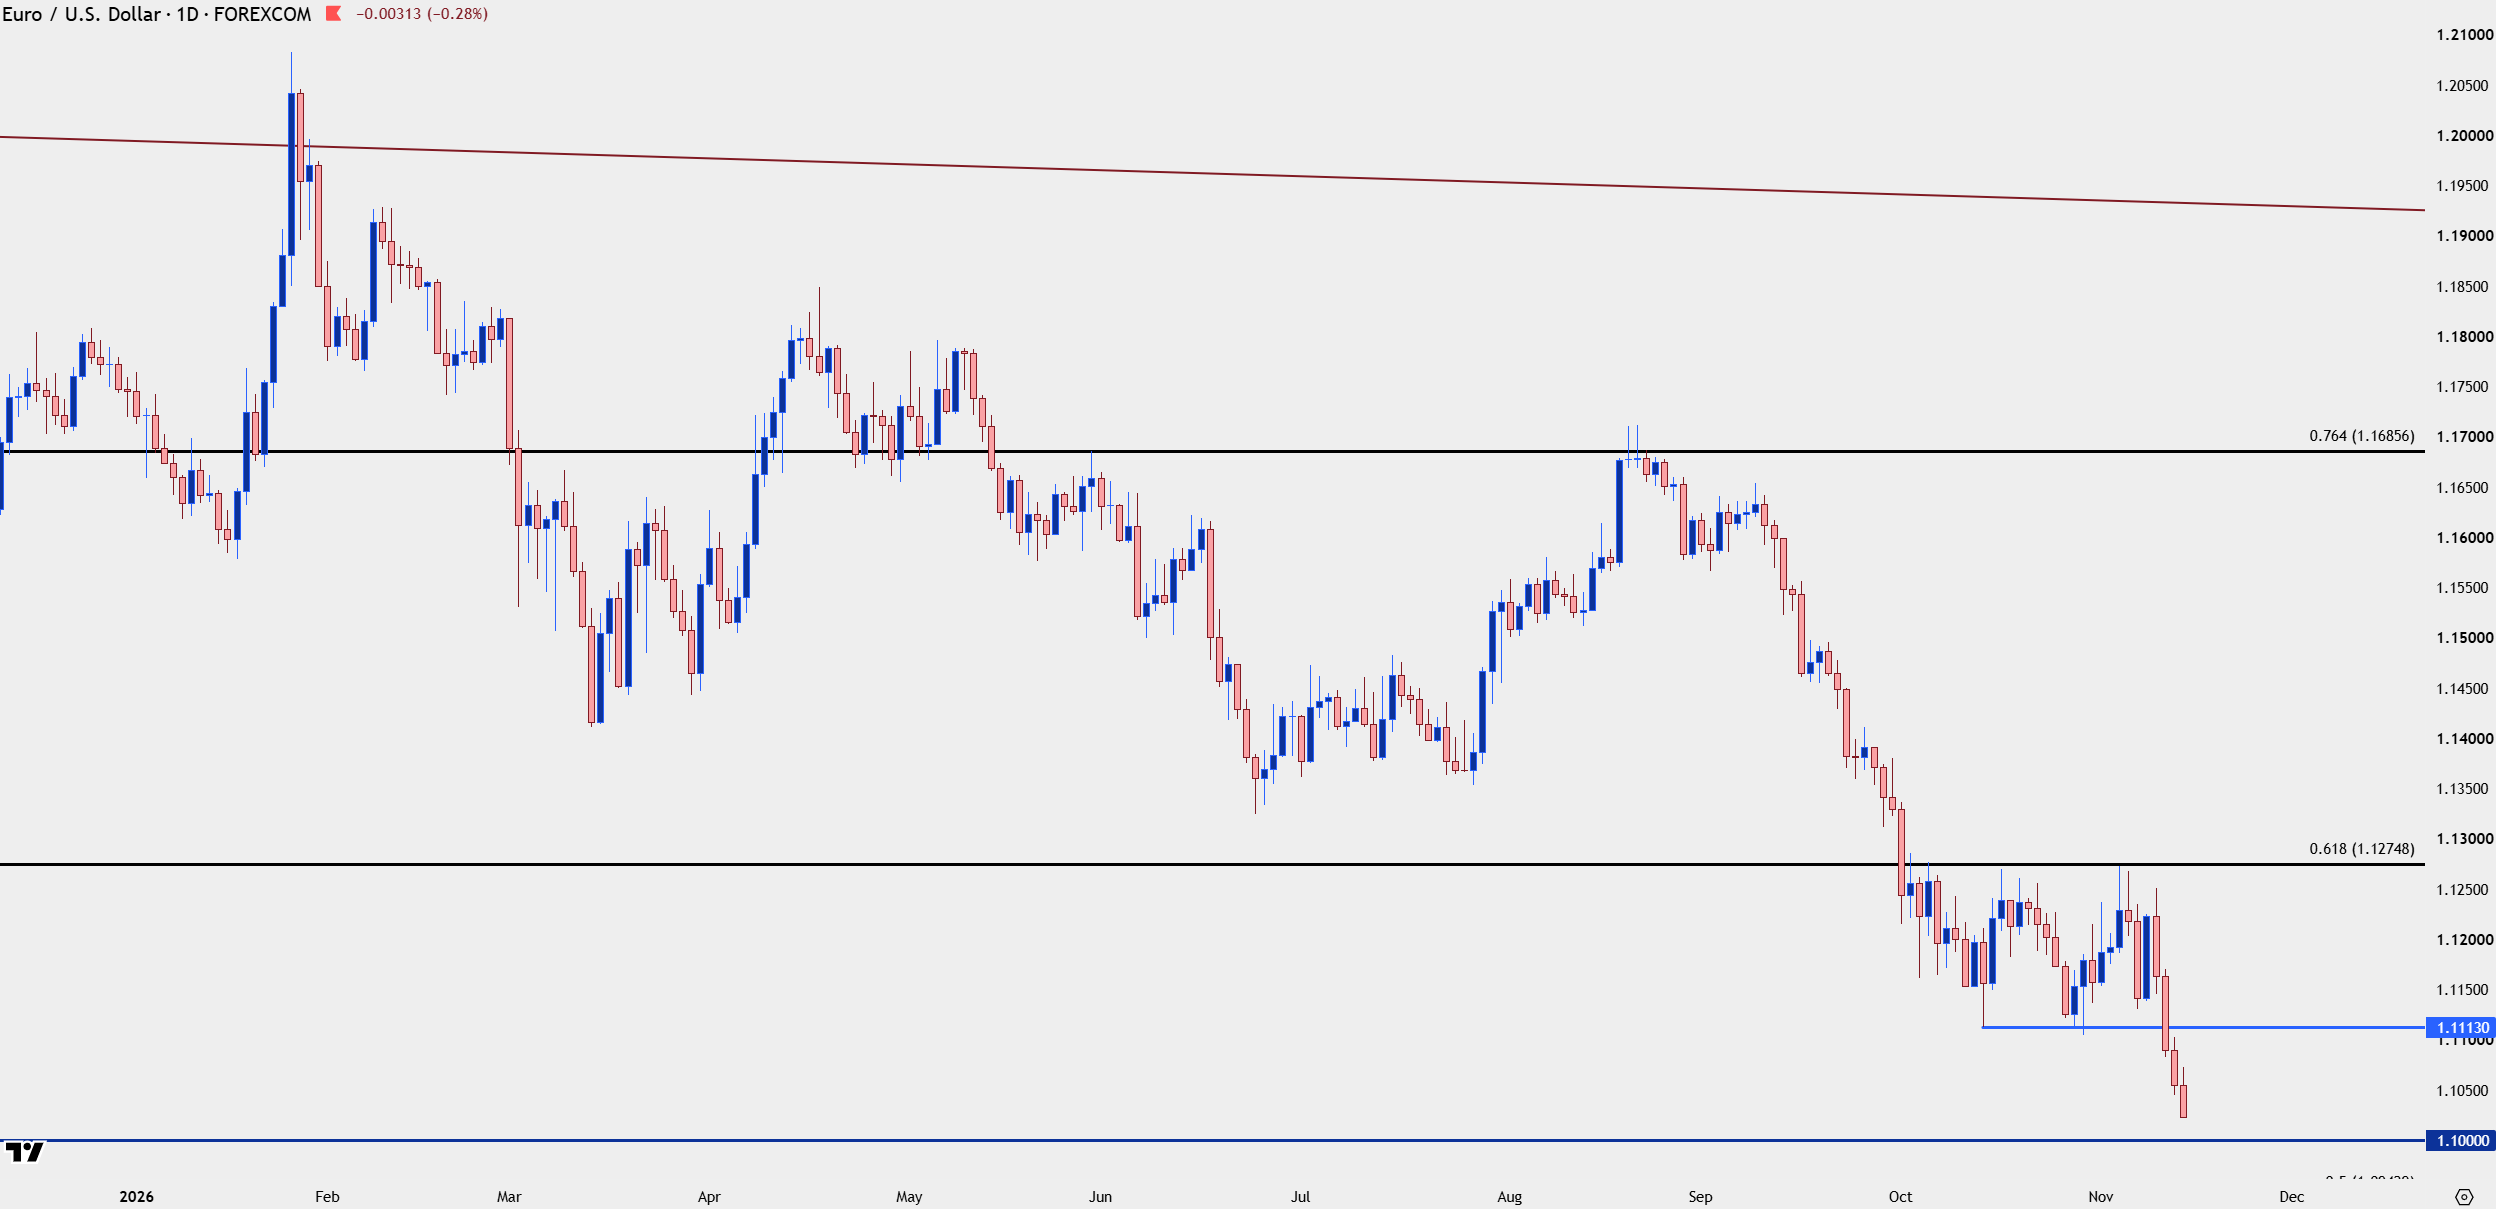
Chart prepared by James Stanley; data derived from Tradingview
USD/JPY
The fundamental bias remains decisively tilted to the long side of USD/JPY and this week only furthered that, as stronger US inflation has brought upon expectation for even more rate hikes from the Fed. Meanwhile, in Japan, the BoJ has hiked rates even though inflation is below their 2% target and markets have seemed to see through that as the pair remains above the levels it was at around that September rate hike.
At this point, the one bearish item that could send this lower seems to be intervention, or perhaps more to the point, the threat of intervention. This is what sent the pair spiraling lower back in July and then again in early-September, well before the rate hike. But it was right around when US Treasury Secretary Scott Bessent warned against betting against him that the pair carved out its low around the 153.00 level on its way back to the 160.00 handle.
That 160.00 level traded over the past week and, notably, bulls have continued to bid pullbacks. With more testing, a breakout seems imminent unless a policymaker steps in to try to coerce prices back-down. And if they do, there’s the possibility of collateral damage if the run lasts for long, similar to what showed back in July of 2024. An actual intervention would be non-ideal as both Japan and the US are in positions where capital reserves should not be wasted, given rising yields in both economies. So this does present a true quandary and, from a fundamental perspective, it would seem the path of least resistance – is through resistance at 160.00.
The one option that we may see play soon is an intervention threat, designed to scare traders out of long positions and very similar to what happened back at the 160.00 level. But, like most other verbal threats, if it’s not backed by action the market may simply continue to test the boundary until action is forced.
USD/JPY Daily Price Chart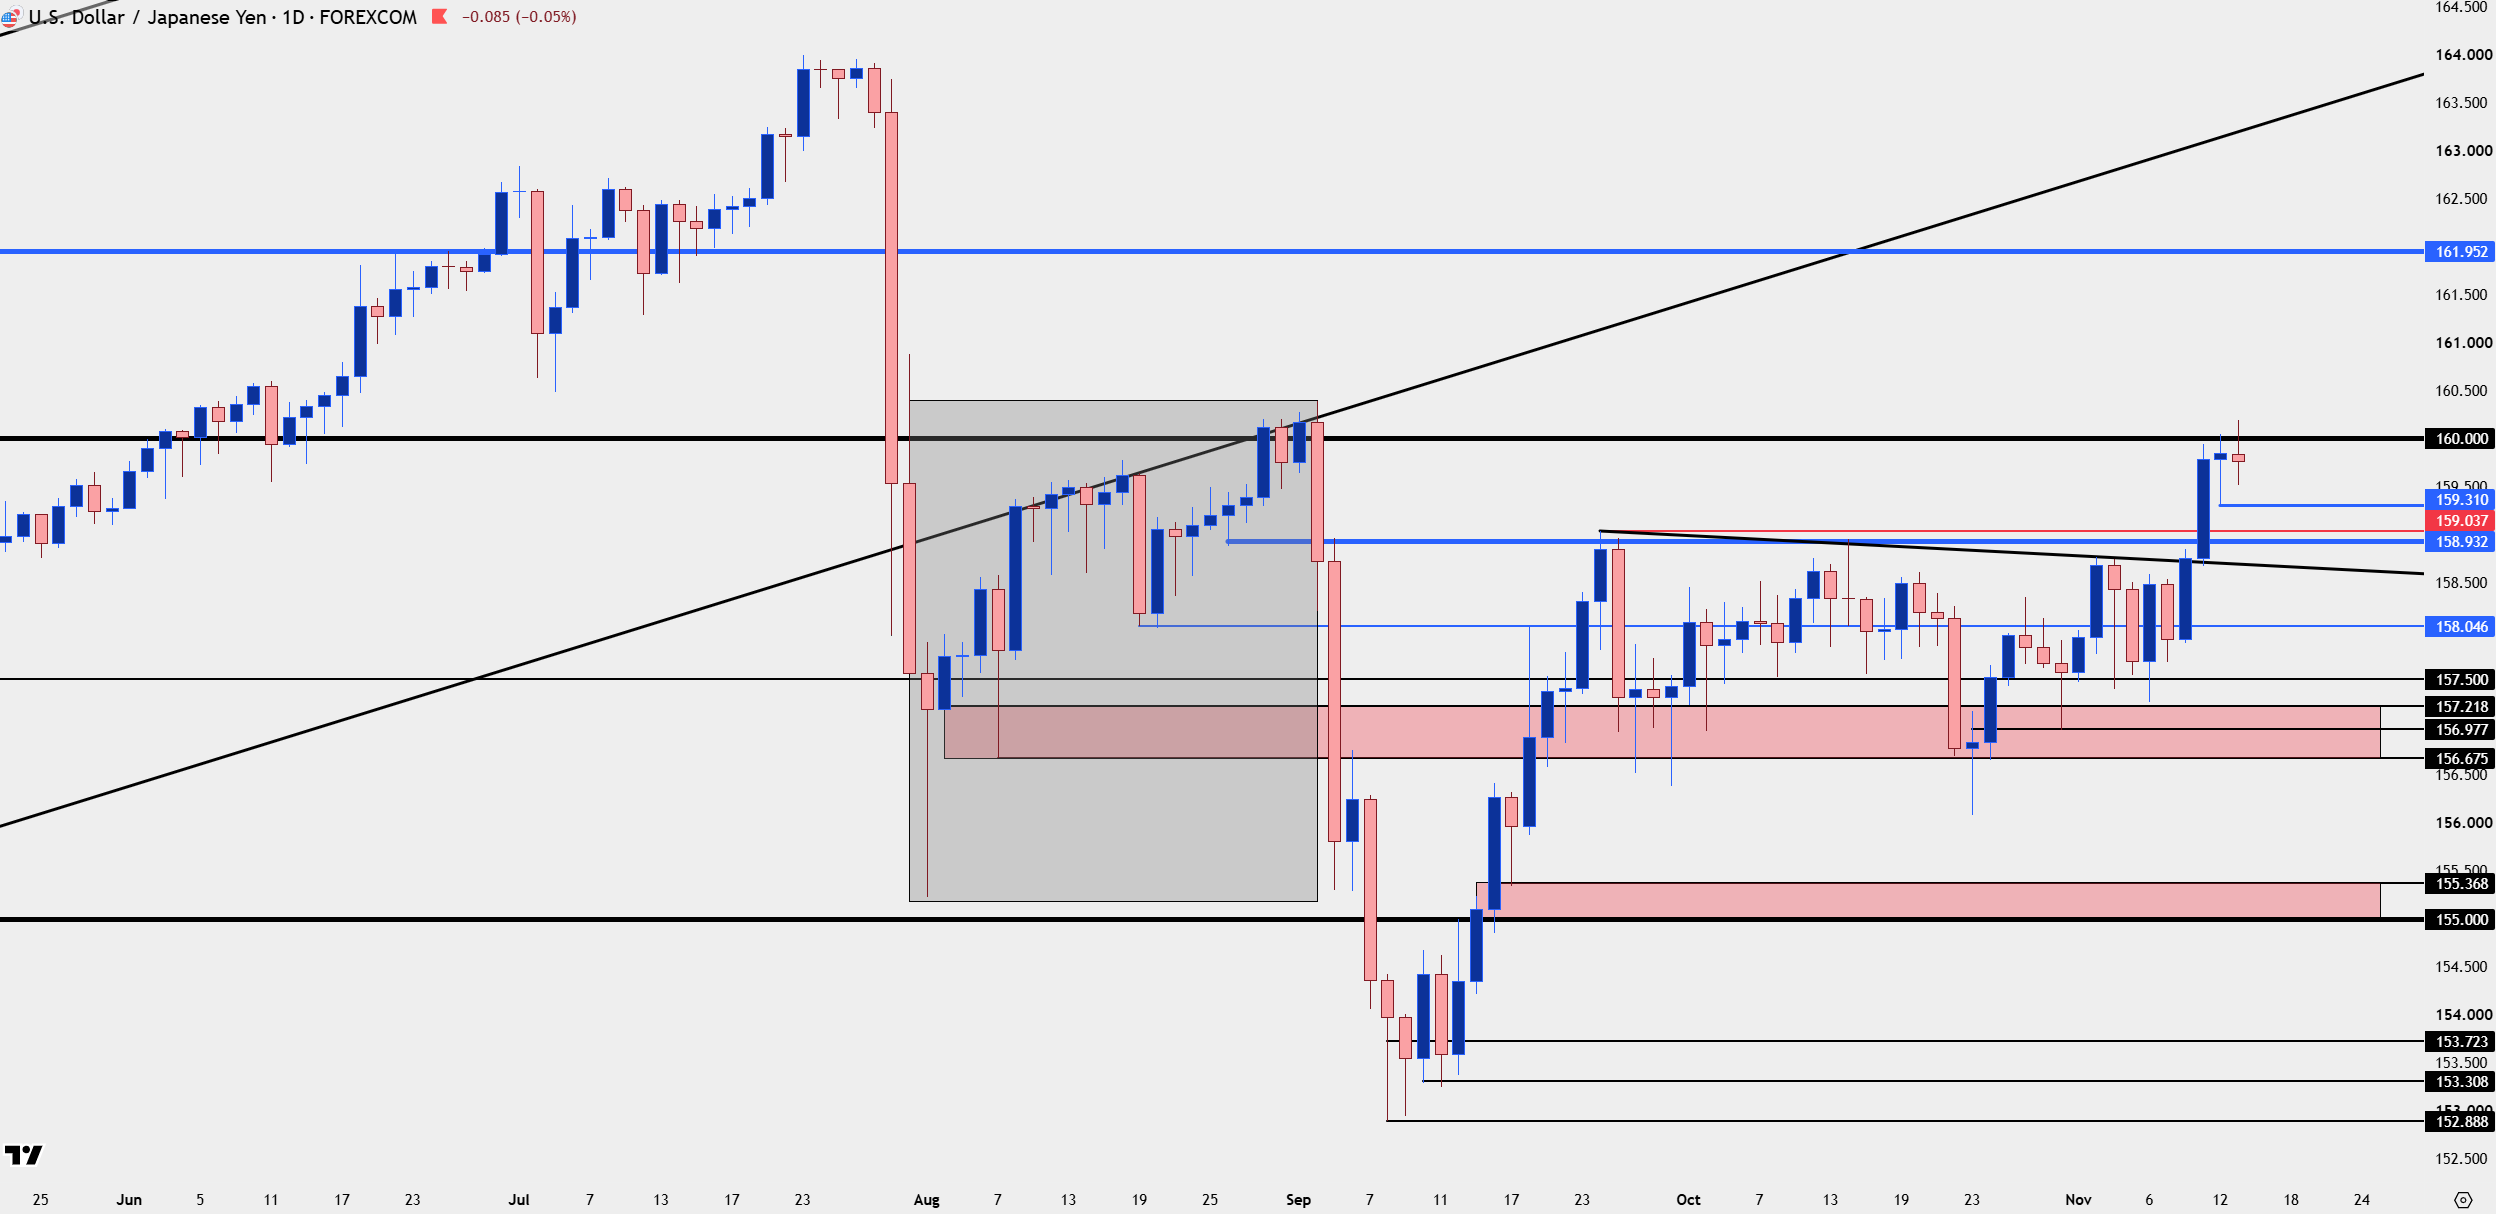
Chart prepared by James Stanley; data derived from Tradingview
--- written by James Stanley, Senior Market Analyst, Global Macro
Related tags:
Latest market news




Open an account in minutes
Experience award-winning platforms with fast and secure execution, and enjoy tight spreads from 0.5 pts on FX and 0.3 pts on indices.
Economic calendar
Web Trader platform
Our sophisticated web-based platform is packed with features.
Related articles

US Dollar Price Action Setups: EUR/USD, USD/JPY
The US Dollar broke out to a fresh yearly high after the CPI report, and that Dollar strength was on full view in pretty much all major pairings with a particular push in EUR/USD.
US dollar forecast: USD/JPY and USD/CHF in focus | Forex Friday
Sticky US inflation and a hawkish Fed have kept the dollar firm across the majors, with USD/JPY pressing on the 160 handle. Here are the levels that matter on USD/JPY and USD/CHF as next week's retail sales, Nvidia results and FOMC minutes approach.

Swiss Franc Forecast: USD/CHF 3% Rally Threatens Multi-Year Downtrend 11 13 2026
USD/CHF has erased its October losses, but bulls still need a decisive weekly close above key resistance to confirm a larger bullish reversal.

This report is intended for general circulation only. It should not be construed as a recommendation, or an offer (or solicitation of an offer) to buy or sell any financial products. The information provided does not take into account your specific investment objectives, financial situation or particular needs. Before you act on any recommendation that may be contained in this report, independent advice ought to be sought from a financial adviser regarding the suitability of the investment product, taking into account your specific investment objectives, financial situation or particular needs.
StoneX Financial Pte. Ltd., may distribute reports produced by its respective foreign entities or affiliates within the StoneX group of companies or third parties pursuant to an arrangement under Regulation 32C of the Financial Advisers Regulations. Where the report is distributed to a person in Singapore who is not an accredited investor, expert investor or an institutional investor (as defined in the Securities Futures Act), StoneX Financial Pte. Ltd. accepts legal responsibility to such persons for the contents of the report only to the extent required by law. Singapore recipients should contact StoneX Financial Pte. Ltd. at 6826 9988 for matters arising from, or in connection with the report.
In the case of all other recipients of this report, to the extent permitted by applicable laws and regulations neither StoneX Financial Pte. Ltd. nor its associated companies will be responsible or liable for any loss or damage incurred arising out of, or in connection with, any use of the information contained in this report and all such liability is hereby expressly disclaimed. No representation or warranty is made, express or implied, that the content of this report is complete or accurate.
StoneX Financial Pte. Ltd. is not under any obligation to update this report.
Trading CFDs carries a high level of risk that may not be suitable for some investors. Consider your investment objectives, level of experience, financial resources, risk appetite and other relevant circumstances carefully. The possibility exists that you could lose some or all of your investments, including your initial deposits. If in doubt, please seek independent expert advice. Visit www.forex.com/en-sg/terms-and-policies for the complete Risk Disclosure Statement.