



US Dollar Price Action Setups: USD/JPY, USD/CAD, EUR/USD, GBP/USD
The US Dollar has an open door for a breakout test but whether that theme pushes through likely revolves back to the USD/JPY breakout setup, even with EUR/USD set up for a breakdown.
Share this:

US Dollar Talking Points:
- US inflation remains hot and rate expectations are high for more hikes through next year.
- This has helped to keep the Dollar in a bullish spot and as looked at from the weekly chart, bulls have an open door to make a move here.
- USD/JPY remains central to the USD-strength theme and the fundamentals are decisively tilted to the long side of the pair.
US Dollar
The USD weekly chart is set up for breakout. Bears had an open door for the past four weeks to run a breakdown and they continually failed to push through, and following a strong reaction to the earlier CPI report on the morning, with the daily chart working on a bullish engulf, there’s now an open door for a breakout test with the 103.00 level looming large overhead.
US Dollar Weekly Price Chart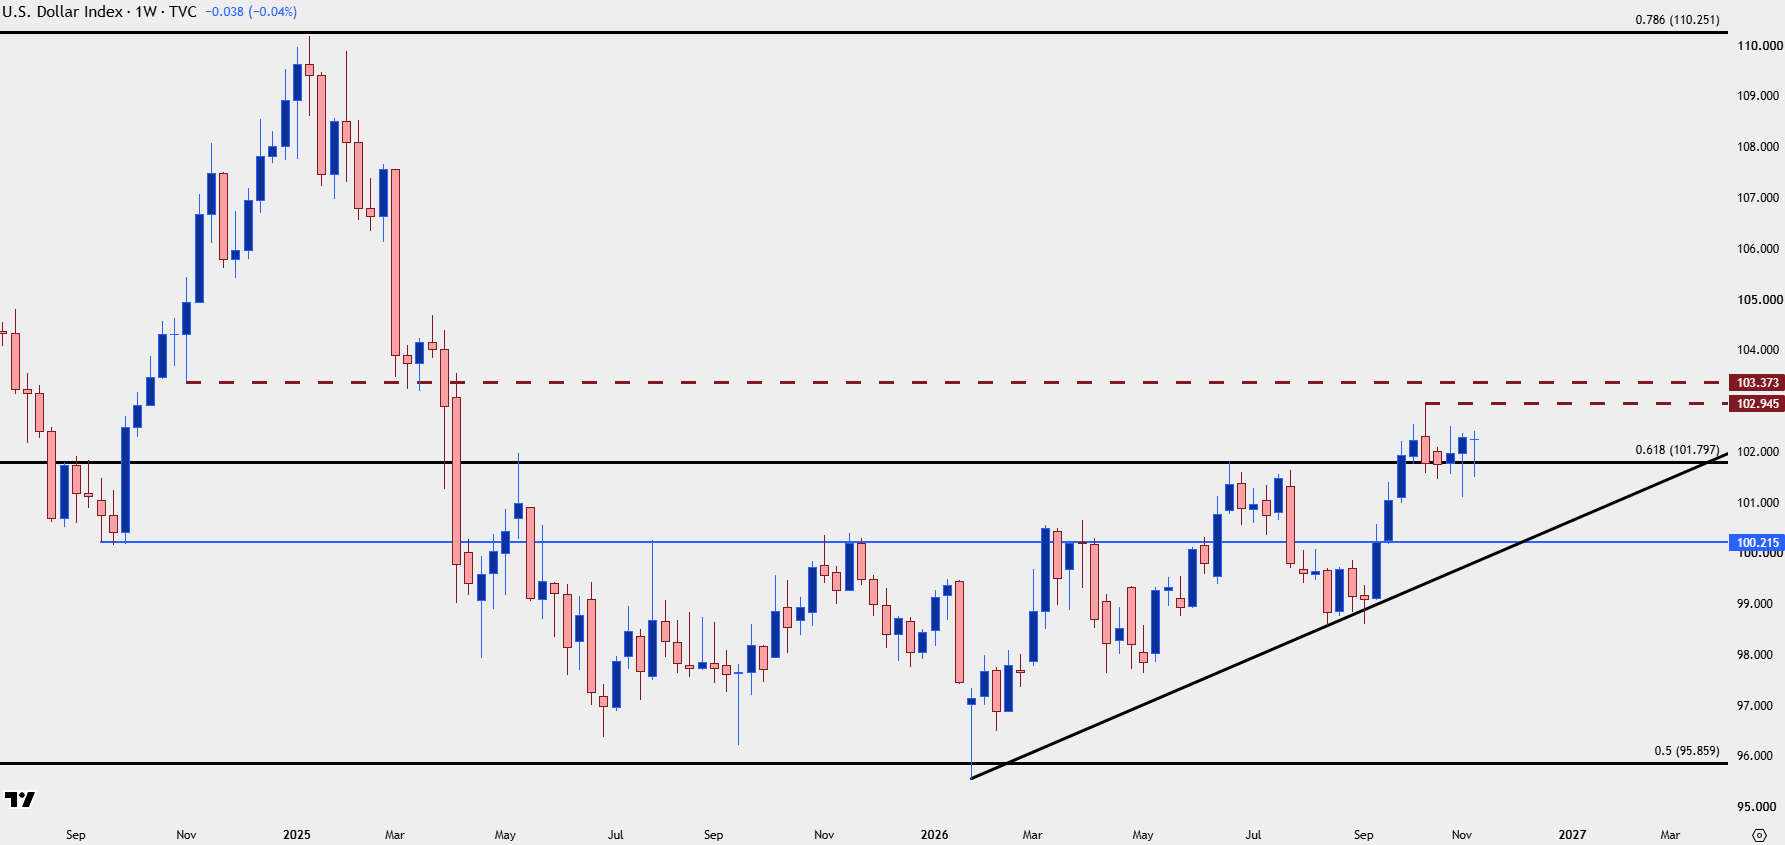
Chart prepared by James Stanley; data derived from Tradingview
USD/JPY
I covered this in the USD/JPY article yesterday but USD/JPY remains a key component of the Dollar strength theme, as it’s been the continued fundamental divergence between the two economies that’s helped to keep both markets bid. To this date, there’s still positive rollover on the long side of the pair and negative on the short side, so there’s a built-in incetivization for buyers to hold and punishment for bears. Thus this provides a bit of motive and while governments on both sides have tried to influence the pair lower, they haven’t been able to turn the tides of economic growth and that’s why the pair continues to flirt with breakouts.
The question at this point is whether buyers have the resolve to test the heavy hand of intervention. The dual intervention from July hit at the 164 level, obviously trying to defend a 165 test. Subsequently intervention threats showed after a test of 160 and that’s led to a lower-high at 159.
But even as I said back in July, given fundamentals, the pair remains attractive on pullbacks and that’s helped to produce a series of support hits and, more recently, higher-lows. The CPI report this morning only further reinforces that fundamental dilemma and the demographic quandary of Japan only exacerbates the problem.
Also of note, and spoken to at length in the latter part of the webinar, is the fact that a hard case of carry unwind threatens to create a massive global de-leveraging event, similar to what showed briefly back in July of 2024.
At this point, much like the USD above, the technical backdrop for USD/JPY is open for breakout potential.
USD/JPY Daily Price Chart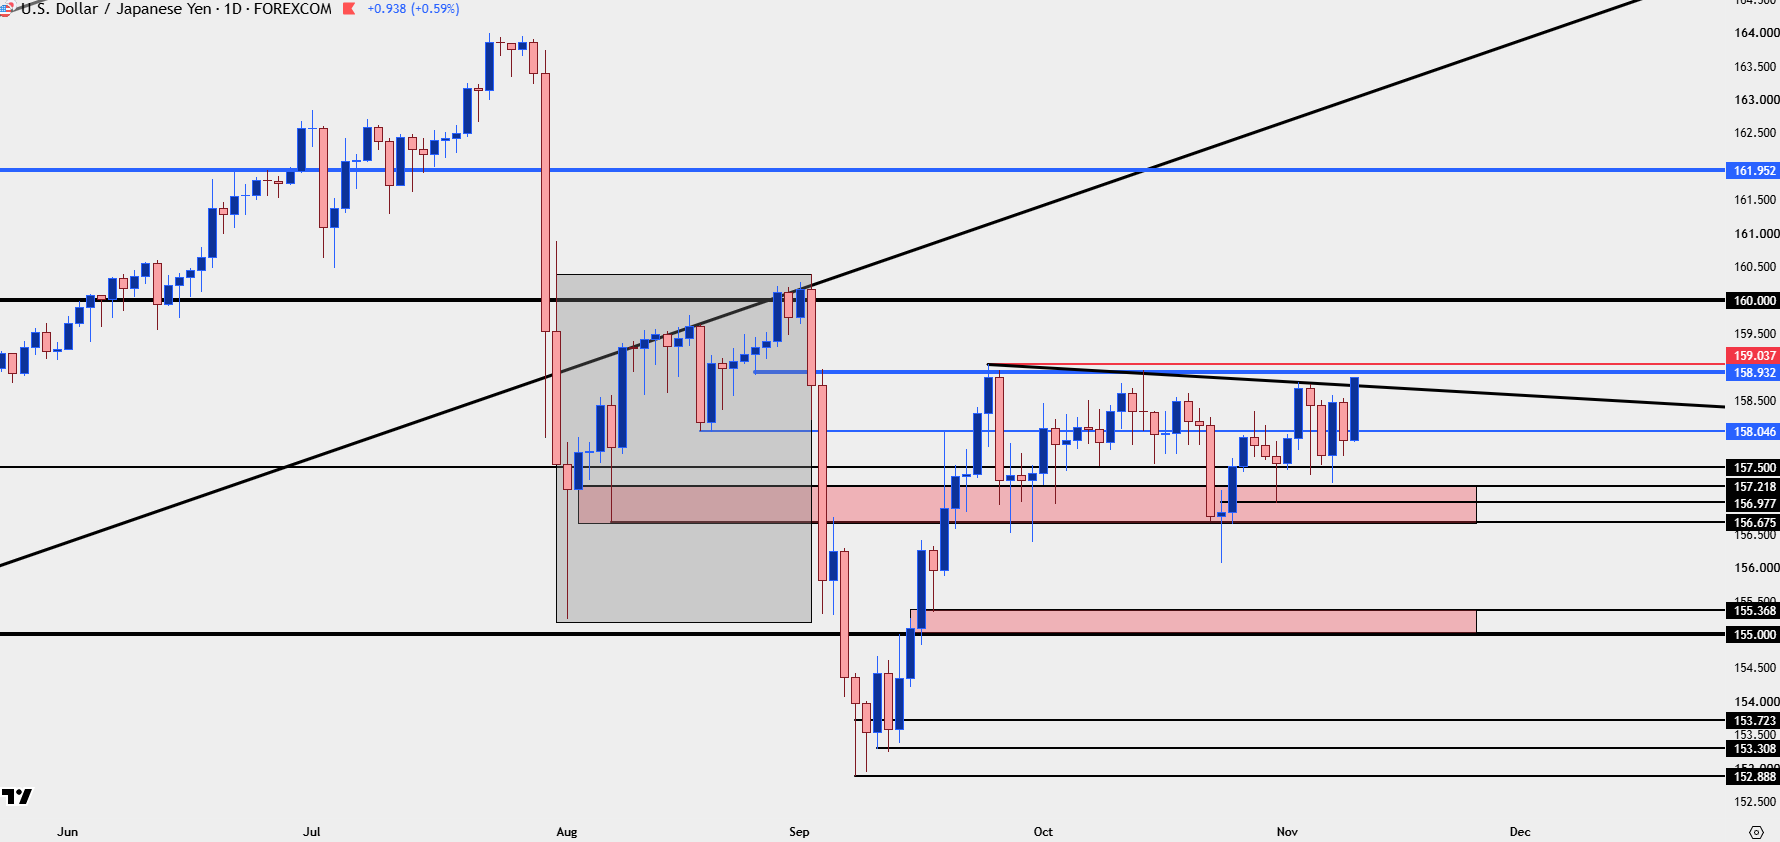
Chart prepared by James Stanley; data derived from Tradingview
USD/CAD
USD/CAD is another pair set up for USD-strength and there was a clean show of support around 1.3950 after five consecutive days of grind. Chasing at this point can prove problematic, particularly given the resistance test from prior support, but there’s now higher-low support potential around 1.4151 and then 1.4069-1.4078, after which the 1.4000 level comes back into the picture.
USD/CAD Daily Chart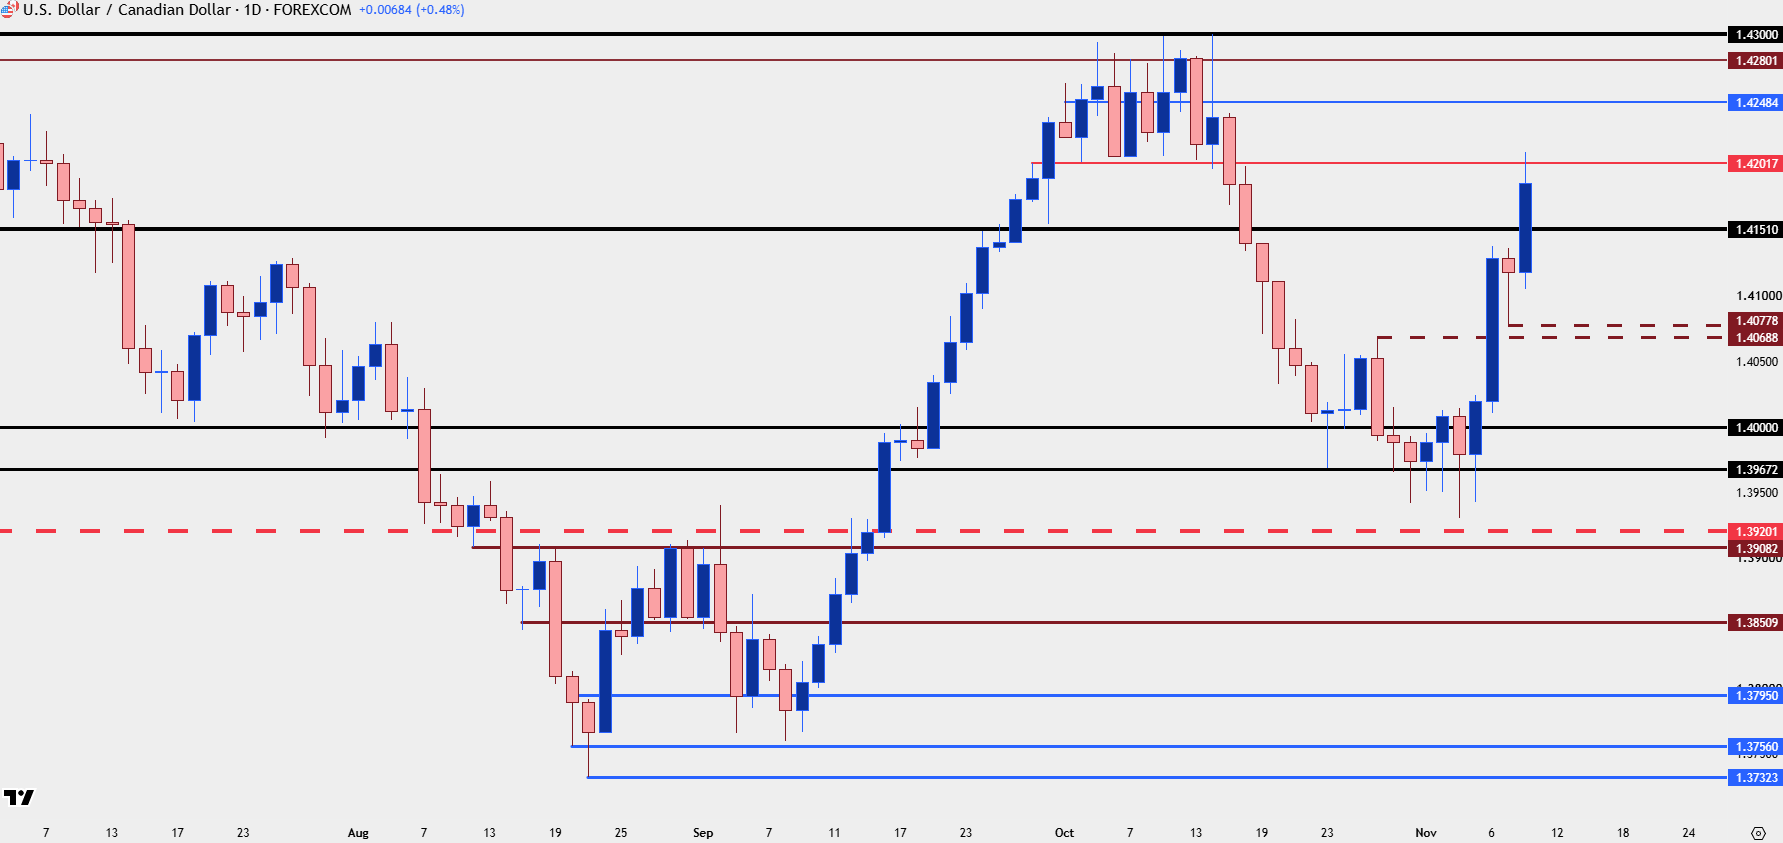
Chart prepared by James Stanley; data derived from Tradingview
GBP/USD
GBP/USD has been my bearish USD setup for a while now but given that rush of USD strength last week, combined with a failed test at the 1.3500 level, GBP/USD has folded back aggressively. As shown in the webinar, this feels like a falling knife, and a show of support would first be needed to get the idea that bullish resumption is attractive again. For that, I’m tracking a familiar zone of 1.3275-1.3300.
GBP/USD Daily Price Chart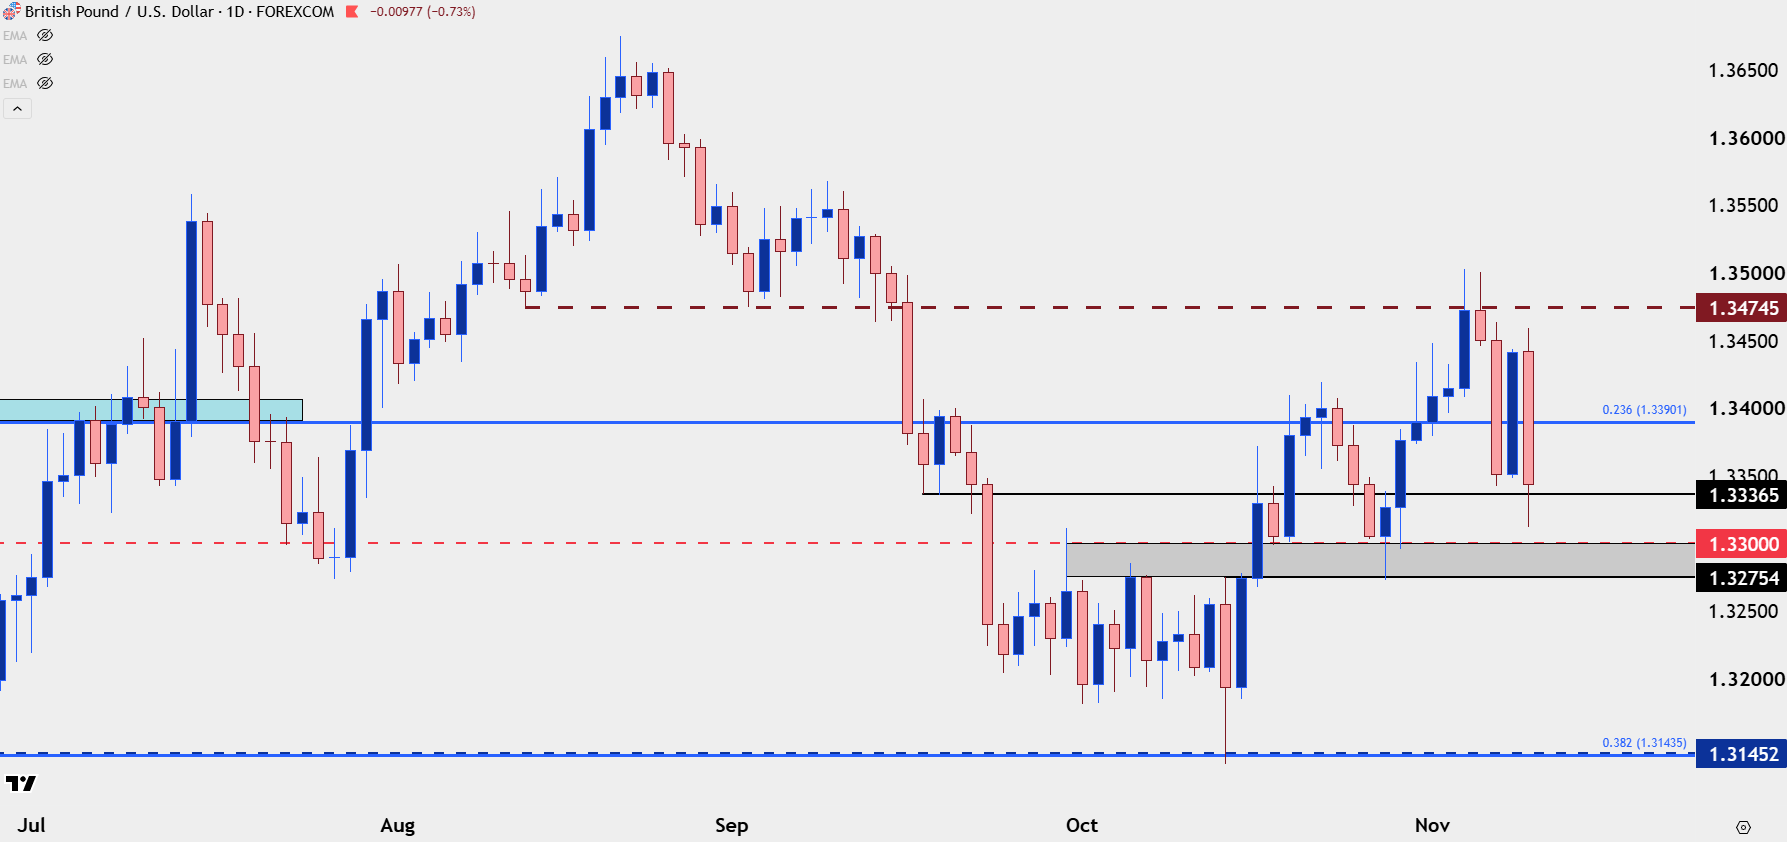
Chart prepared by James Stanley; data derived from Tradingview
EUR/USD
EUR/USD just has not been able to hold a bid and last week saw yet another failure at the 1.1263/1.1275 area, and from the weekly below there’s a mirror image of the USD setup above, where there’s breakout potential following a month of digestion.
In EUR/USD, it’s the 1.1000 level below that looms large, with the 1.0943 Fibonacci level below that.
EUR/USD Daily Chart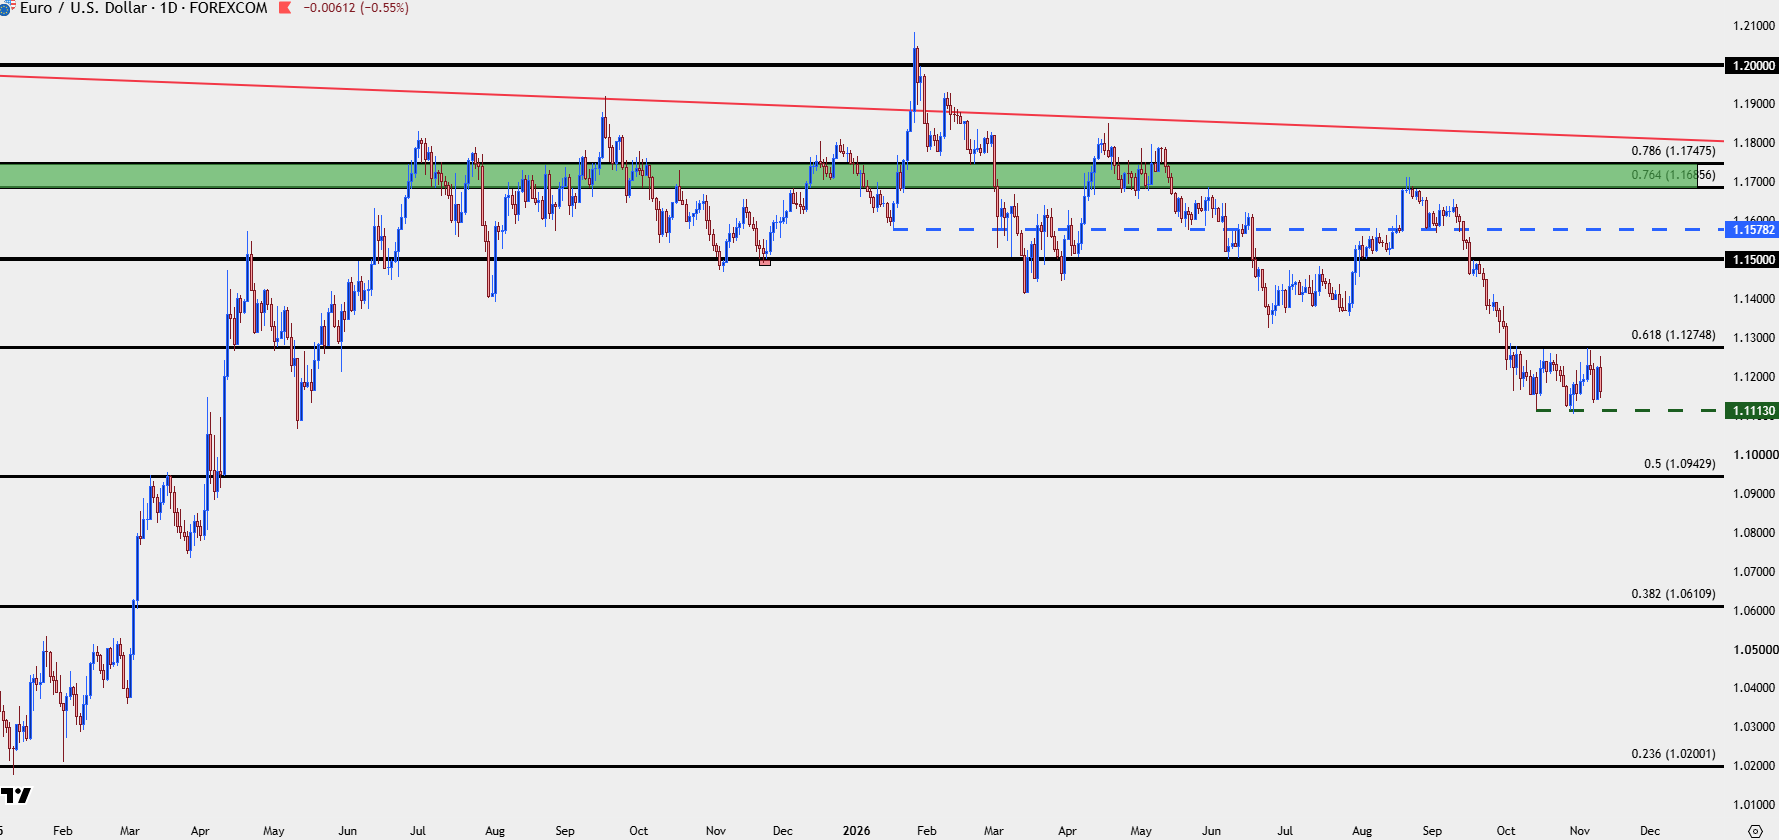
Chart prepared by James Stanley; data derived from Tradingview
--- written by James Stanley, Senior Market Analyst, Global Macro


Open an account in minutes
Experience award-winning platforms with fast and secure execution, and enjoy tight spreads from 0.5 pts on FX and 0.3 pts on indices.
Economic calendar
Web Trader platform
Our sophisticated web-based platform is packed with features.
Related articles

USD/JPY, USD/CAD Outlook: Fed hawks put dollar bulls on alert
Hotter US inflation and hawkish Fed commentary have triggered a sharp repricing of interest rate expectations. USD/JPY and USD/CAD are in focus as the dollar's sensitivity to Fed policy strengthens.


US Dollar Price Action Setups: USD/JPY, USD/CAD, EUR/USD, GBP/USD
The US Dollar has an open door for a breakout test but whether that theme pushes through likely revolves back to the USD/JPY breakout setup, even with EUR/USD set up for a breakdown.

US Dollar Technical Forecast: DXY Bulls Target Yearly Highs After Hot CPI 11 10 2026
The Dollar is attempting a third straight weekly gain, but bearish momentum divergence warns the recovery may be vulnerable at major resistance.

This report is intended for general circulation only. It should not be construed as a recommendation, or an offer (or solicitation of an offer) to buy or sell any financial products. The information provided does not take into account your specific investment objectives, financial situation or particular needs. Before you act on any recommendation that may be contained in this report, independent advice ought to be sought from a financial adviser regarding the suitability of the investment product, taking into account your specific investment objectives, financial situation or particular needs.
StoneX Financial Pte. Ltd., may distribute reports produced by its respective foreign entities or affiliates within the StoneX group of companies or third parties pursuant to an arrangement under Regulation 32C of the Financial Advisers Regulations. Where the report is distributed to a person in Singapore who is not an accredited investor, expert investor or an institutional investor (as defined in the Securities Futures Act), StoneX Financial Pte. Ltd. accepts legal responsibility to such persons for the contents of the report only to the extent required by law. Singapore recipients should contact StoneX Financial Pte. Ltd. at 6826 9988 for matters arising from, or in connection with the report.
In the case of all other recipients of this report, to the extent permitted by applicable laws and regulations neither StoneX Financial Pte. Ltd. nor its associated companies will be responsible or liable for any loss or damage incurred arising out of, or in connection with, any use of the information contained in this report and all such liability is hereby expressly disclaimed. No representation or warranty is made, express or implied, that the content of this report is complete or accurate.
StoneX Financial Pte. Ltd. is not under any obligation to update this report.
Trading CFDs carries a high level of risk that may not be suitable for some investors. Consider your investment objectives, level of experience, financial resources, risk appetite and other relevant circumstances carefully. The possibility exists that you could lose some or all of your investments, including your initial deposits. If in doubt, please seek independent expert advice. Visit www.forex.com/en-sg/terms-and-policies for the complete Risk Disclosure Statement.