



USD/JPY Coiled for CPI
It’s been a range-bound backdrop for USD/JPY after the excitement of the rally followed by the intervention-fueled reversal, and that can make it easy for traders to get lulled to sleep at a time when markets are prone to shots of volatility.
Share this:

USD/JPY Talking Points:
- A sizable sell-off in the Nikkei has so far left USD/JPY unscathed as the pair has coiled tighter into a range over the past eight weeks.
- Inside of that range is an inverse head and shoulders pattern, which keeps the door open to breakouts.
- The big question at this point is whether or when we might see another intervention threat, as the USD/JPY pair hasn’t re-tested the 160.00 level since the early-September sell-off and even the 159.00 level has been able to hold buyers at bay.
It’s perhaps unfortunate that fundamentals aren’t a perfect push point for price. If they were, matters would probably be simpler for the trader but there would also probably be less profit potential, as lower levels of volatility wouldn’t allow for large moves and, realistically, institutions with greater access to faster information would hold a constant edge or everyone else. But, for better or worse, positioning plays a larger role than just news or headlines or fundamentals, as the only legitimate matter that can push price in either direction is actual buying and selling. And if any and everyone in a market wanting to be long already is, well, it doesn’t matter how bright the headlines might be; there’s simply nobody left to buy.
This adage can be applied in a variety of ways, and with USD/JPY, the 164.00 and to a lesser degree, the 160.00 levels have played a similar role. After the dual intervention in July market participants haven’t dared re-test the same level that evoked the ire of Treasury Secretary Scott Bessent and Finance Minister Satsuki Katayama. After all, if buying at 163 but risking a ride down to 159 or perhaps even lower, the risk-reward is simply difficult to justify.
That line in the sand was so pronounced that another line developed below that, around the 160.00 level, and while that price did actually trade for a few days into September, a similar threat of the heavy hand of intervention fueled another sell-off.
That was, essentially, a one-sided market unwinding as the perceived risk-reward on the long side of the pair grew less attractive. It didn’t shift the fundamentals, of course, as that’s what’s kept buyers hitting bids on pullbacks, and for the past almost two months that two-sided dilemma has pushed USD/JPY into a coiling setup that can pop in either direction. And one of the larger drivers for the pair, historically speaking, is set for release tomorrow with the US CPI report.
USD/JPY Daily Price Chart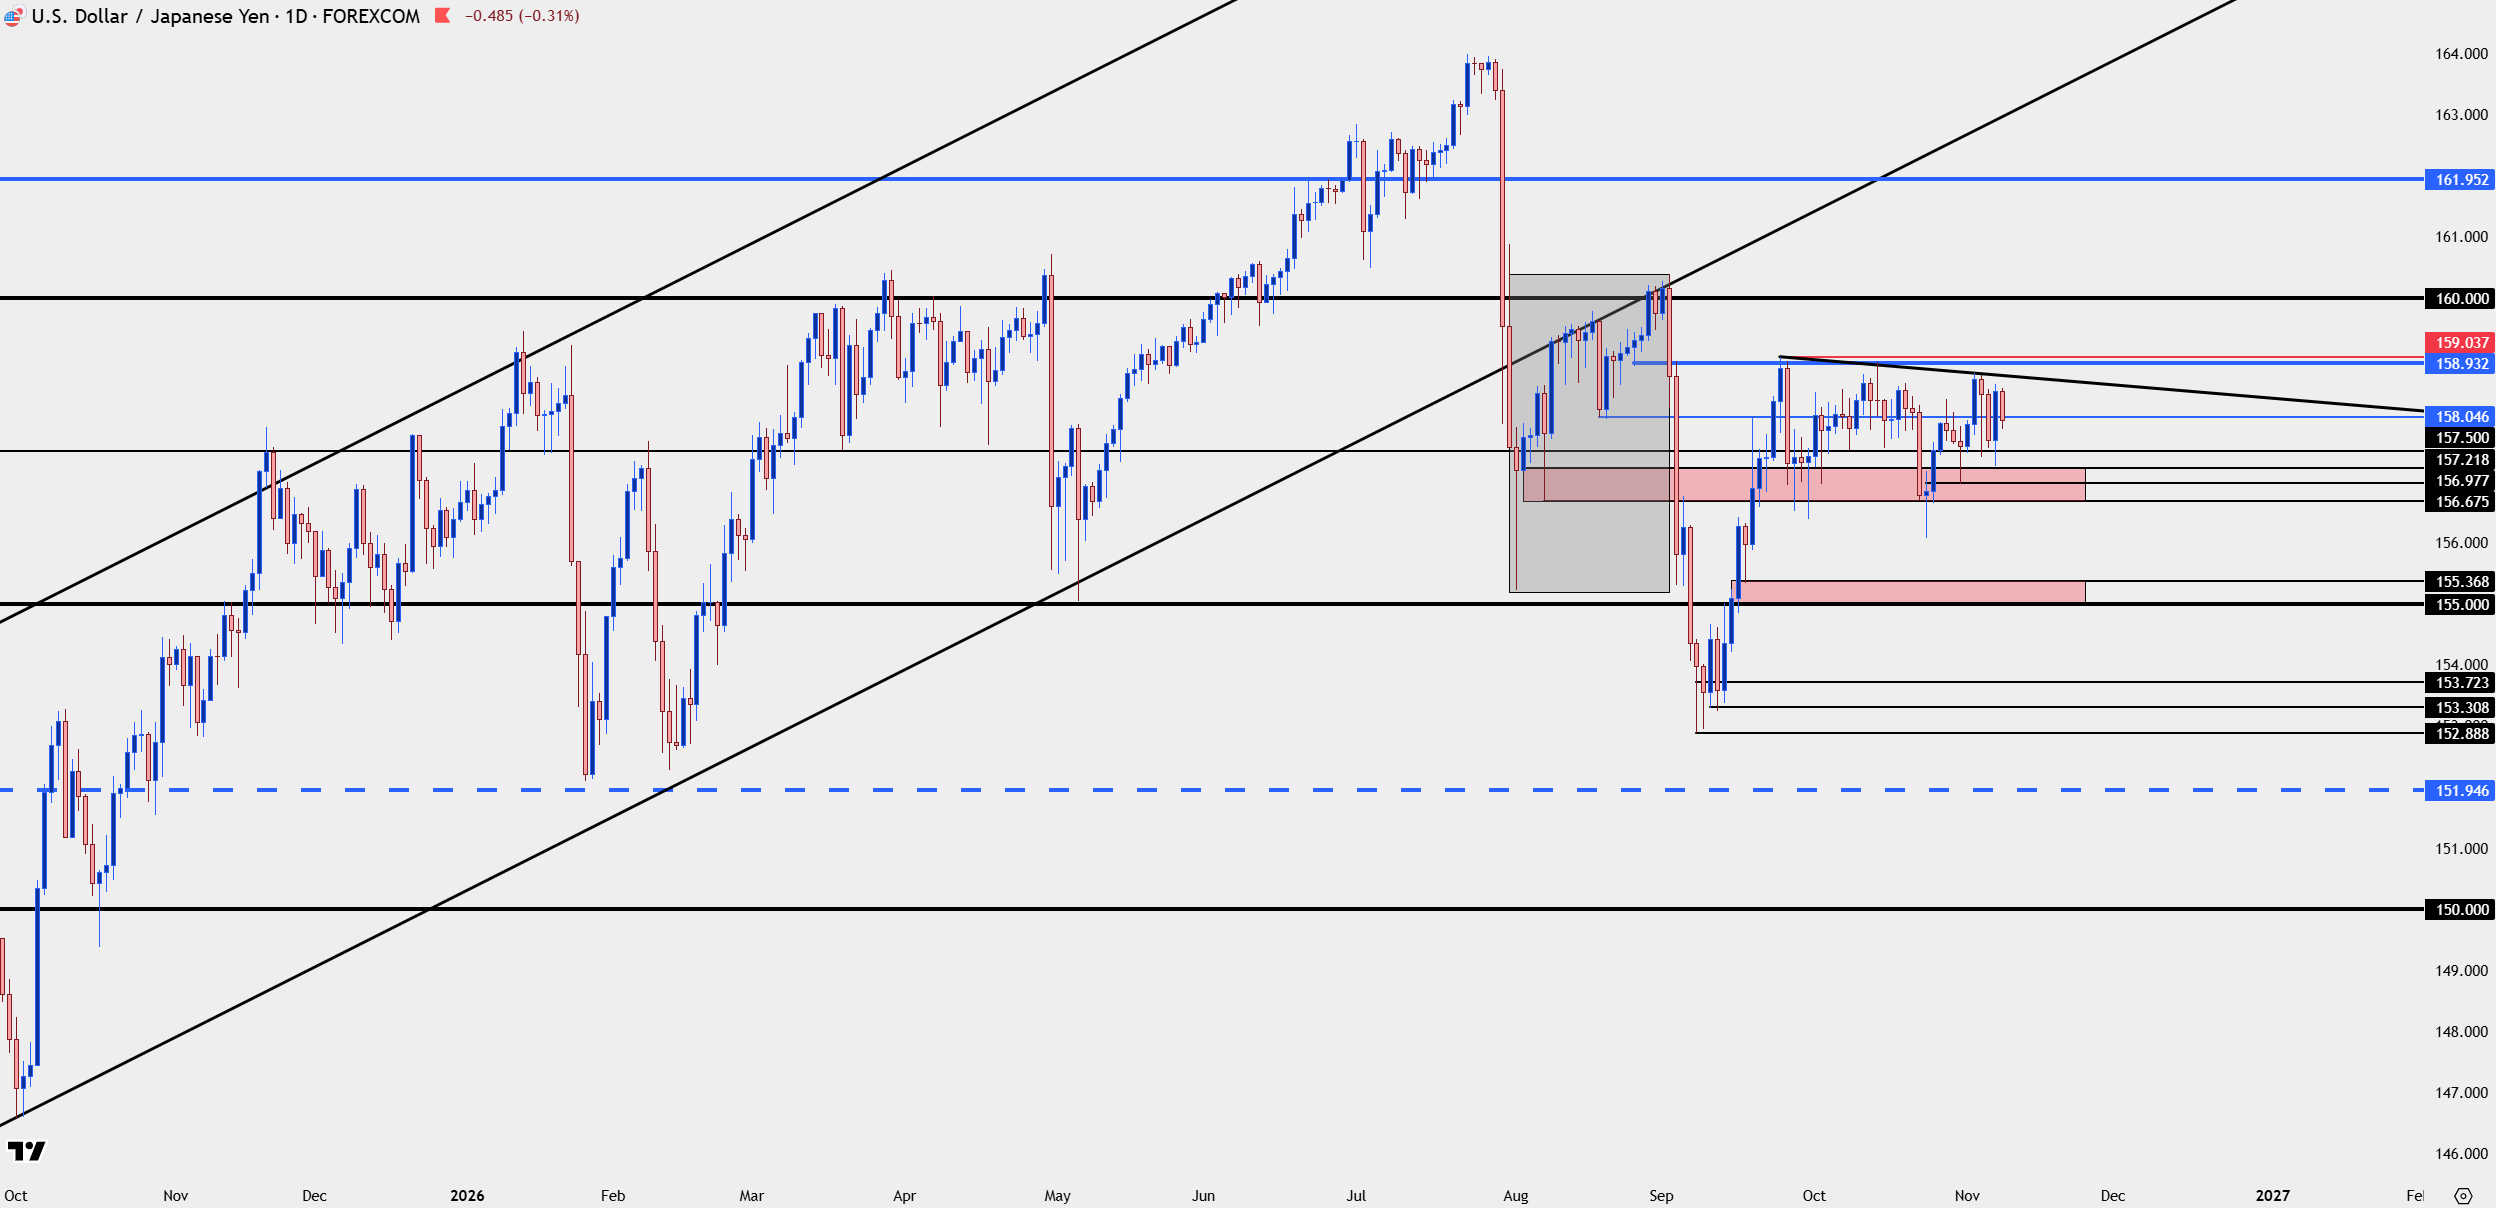
Chart prepared by James Stanley; data derived from Tradingview
USD/JPY Retracements
To be sure, this isn’t the first time we’ve seen such a scenario in USD/JPY. After all, the carry trade has been going for more than five years now, with USD/JPY starting to rally even before the Fed started to hike rates back in 2022. And these were some amazing conditions for FX traders, as a clean and heavy one-sided bias in the pair, backed by a Central Bank aggressively hiking rates in the US while the Bank of Japan did nothing.
The one buffer to that trend was the fear from Japan of losing control of their currency, as a persistent slide threatens to stoke inflation, which would then put the Central Bank in the unenviable position of needing to hike regardless of growth. That helped to pause the rally around the 150 level in 2022 and 2023, and then at 160.00 in 2024. Interventions were used to keep the market in check but for actual reversals, there needed to be some form of fear that would compel longs to close, and that’s where CPI came in.
It was in November of 2022 and 2023 when a below-expected CPI report threatened to tighten rate differentials between the two countries. And, once again, this wasn’t necessarily a fundamental shift as much as it was the fear of a possible shift in the future. But this is where that one-sided positioning was on full display as a sizable sell-off developed in each of those months as longs were pushed out of the pair.
In 2024, we saw this on both sides of the pair, as USD/JPY rallied up to the same high that held in the prior two years, and in April, with a strong US CPI print, bulls forced a breakout that quickly ran up to 160.00.
Again, the BoJ was forced to intervene but this time, that intervention produced a move that only lasted for about a week, as buyers simply jumped in after the pullback and drove right back up to 160.00. But, in July, the BoJ stood ready and this time they intervened on the morning of a US CPI print, and that one came in below expected and suddenly we had the one-sided pair getting shaken by both an intervention and the threat of narrowing rate differentials.
This also brought collateral damage of spiraling equity markets as the leverage produced by the carry trade was quickly taken out of the global system.
USD/JPY Weekly Chart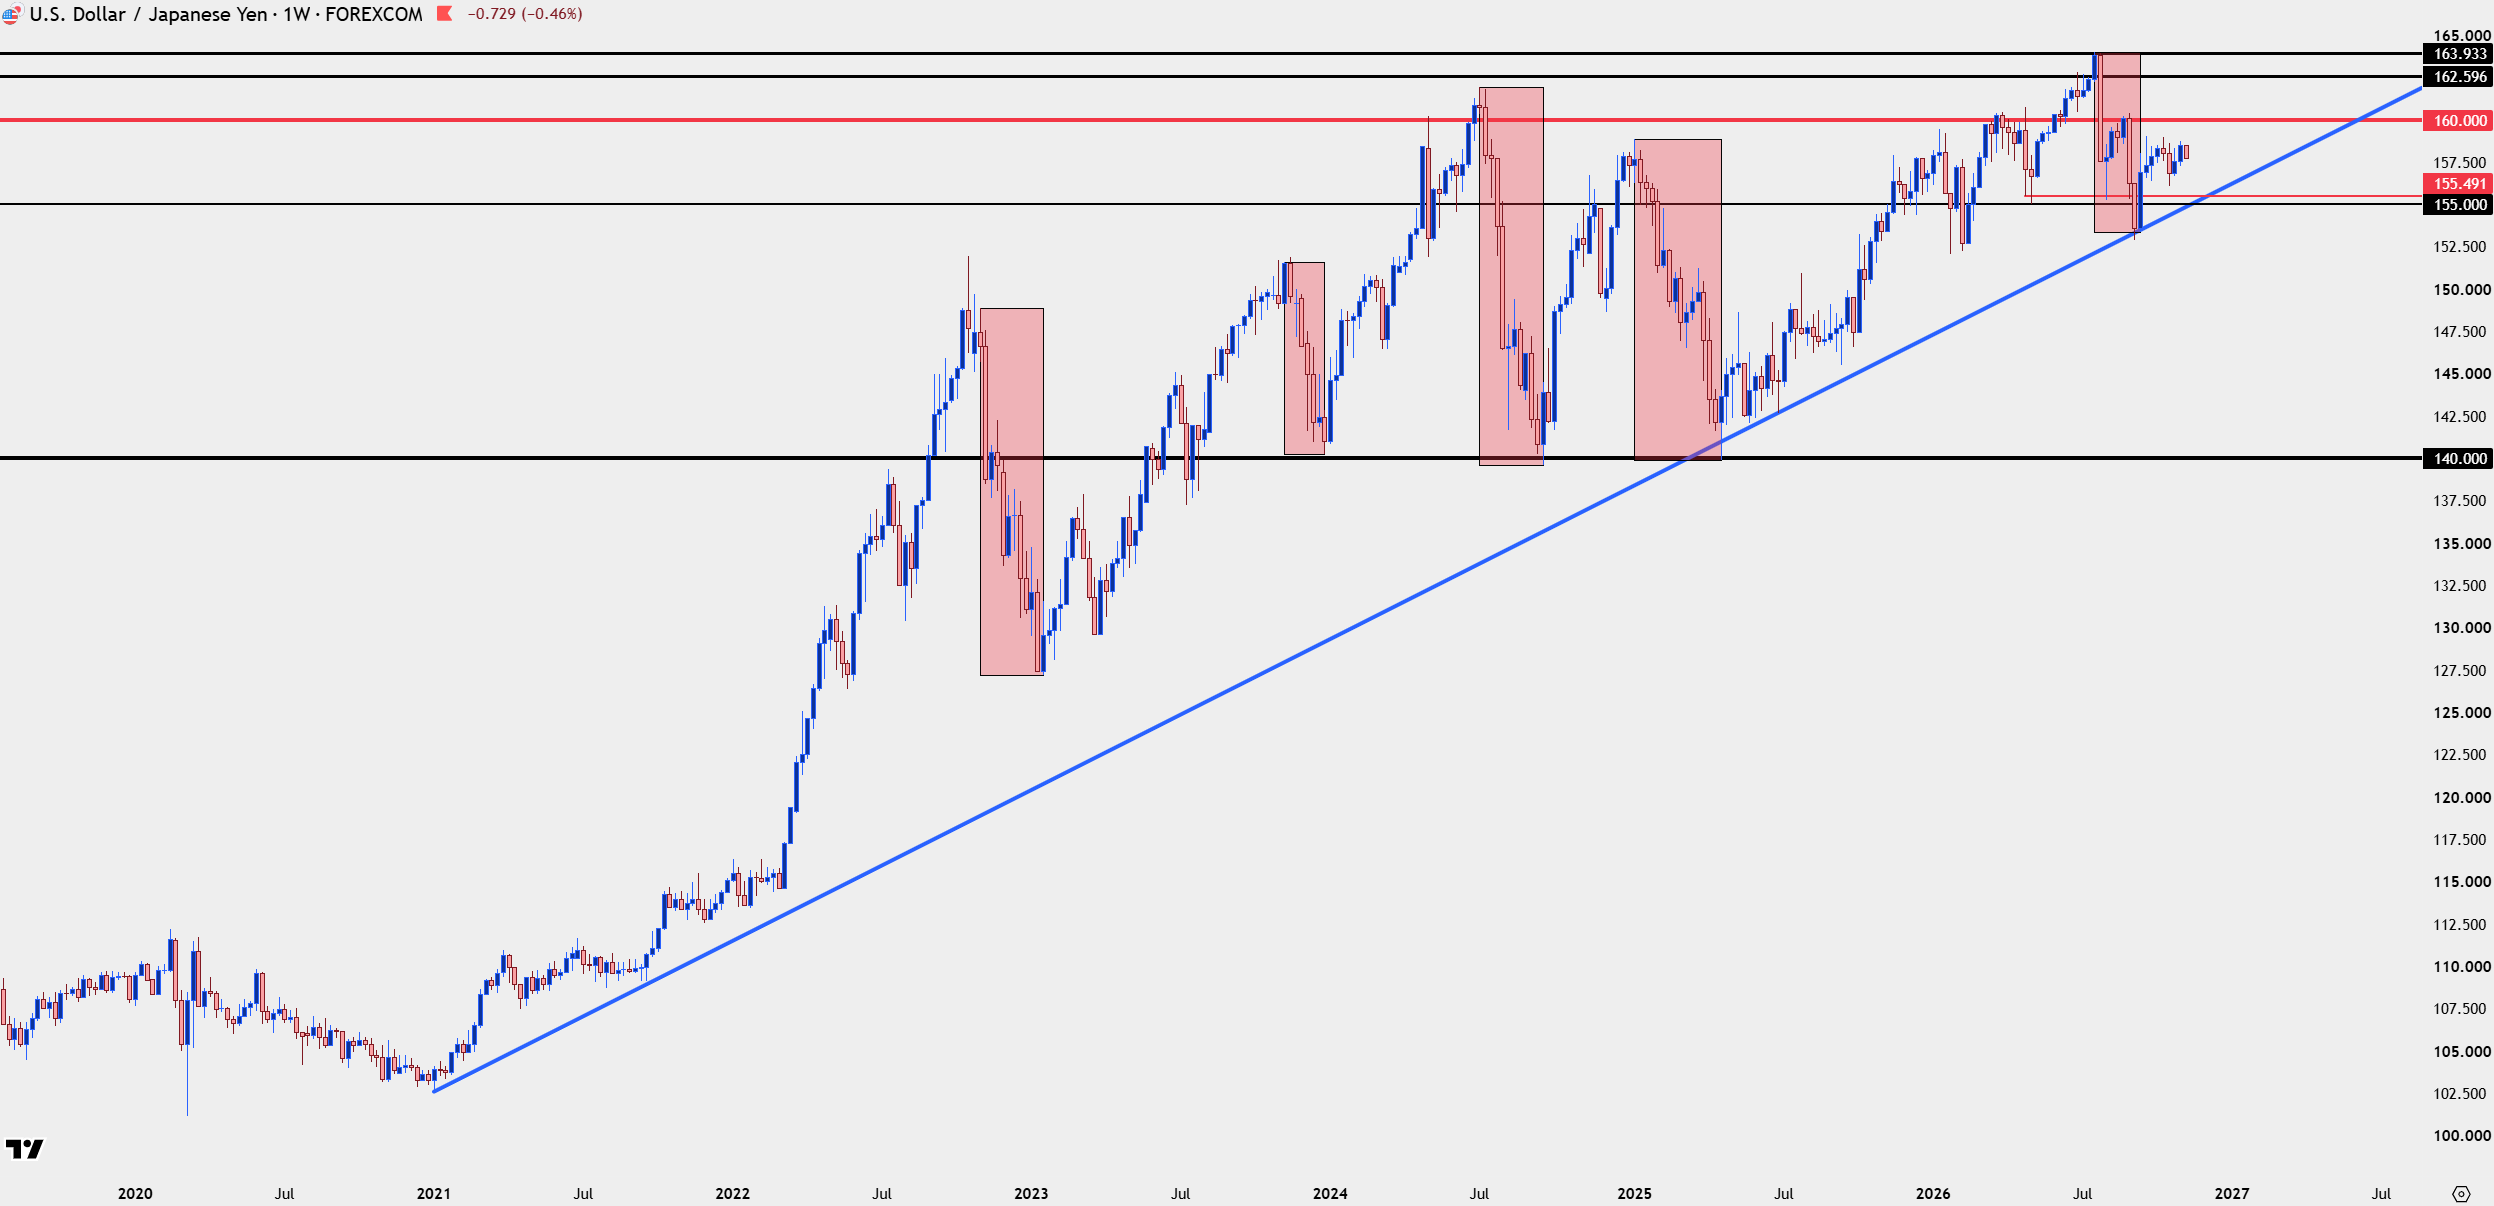
Chart prepared by James Stanley; data derived from Tradingview
USD/JPY: The Coil
With that line in the sand at 164 and then 160, there’s been a build of resistance tests at that area while, at the same time, buyers have continued to come in to support dips. That thesis remains and for the past few months, this has been one of my favored backdrops for USD-strength.
With US CPI dominating the calendar tomorrow this puts the pair in the spotlight, as a below-expected print could deliver a pullback, which then could be attractive given that the carry remains tilted to the long side of the pair. But, if we do see higher-than-expected inflation, we may see bulls take a step forward with another 159.00 or possibly even a 160.00 test.
At this point, the four-hour chart shows an inverse head and shoulders pattern and this is a bullish breakout setup. The neckline for the formation is around that 159.00 level, and there’s approximately 300 pips down to the bottom of the head. This would imply a possible move up to 162.00 if that neckline does break and this, of course, would go into the ‘danger zone’ for intervention.
USD/JPY Four-Hour Chart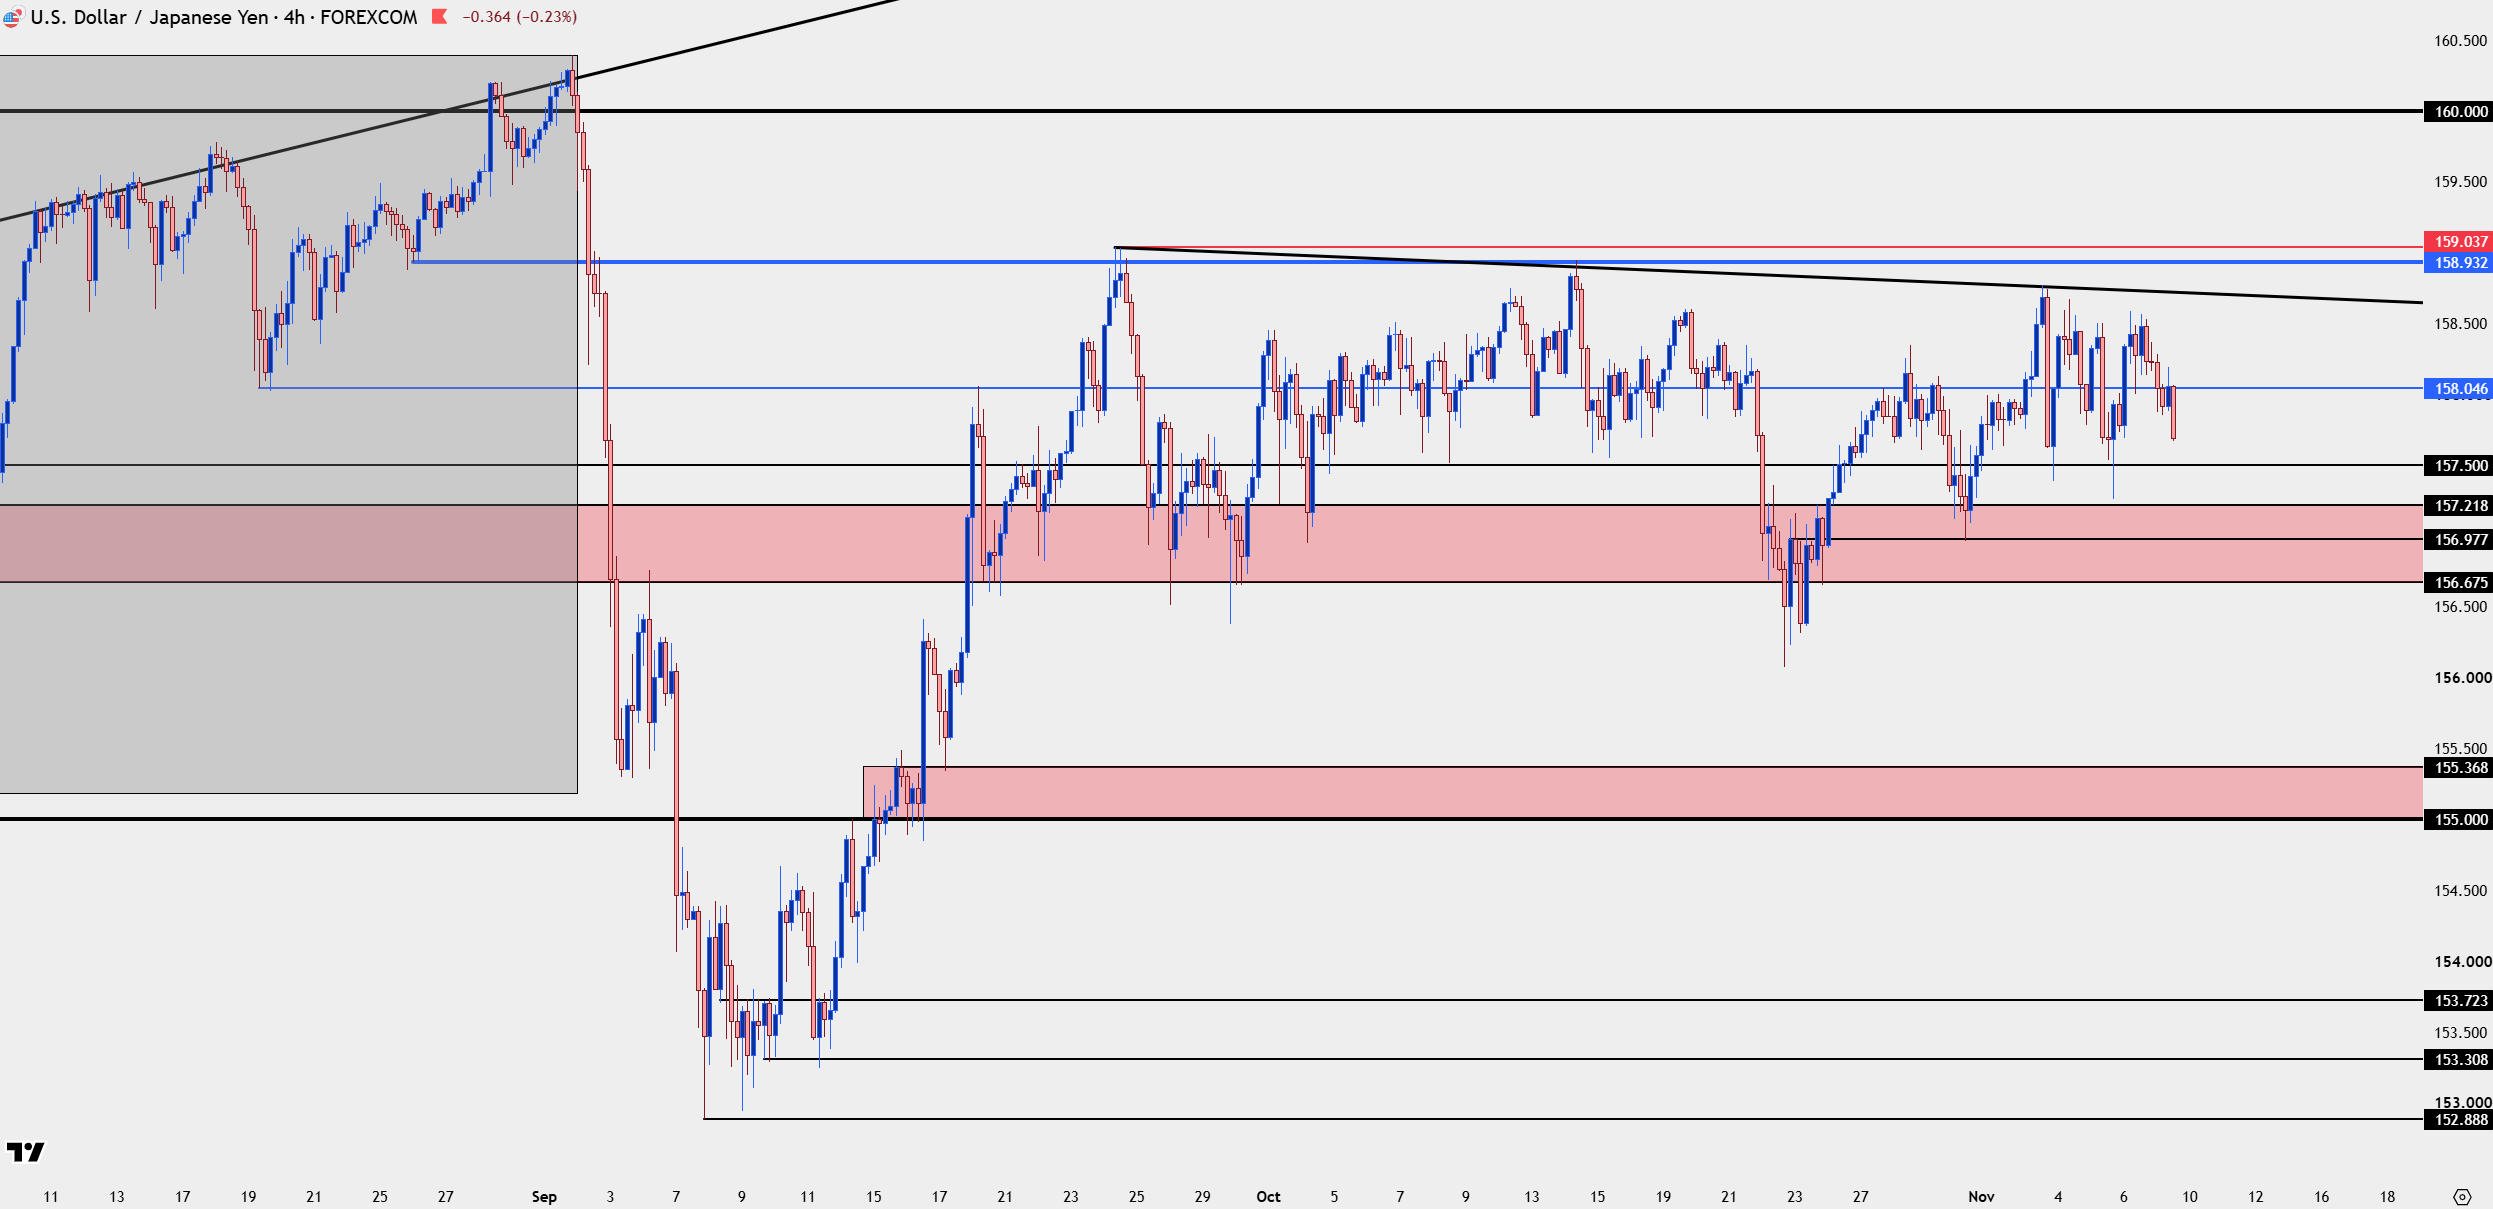
Chart prepared by James Stanley; data derived from Tradingview
--- written by James Stanley, Senior Market Analyst, Global Macro
Related tags:



Open an account in minutes
Experience award-winning platforms with fast and secure execution, and enjoy tight spreads from 0.5 pts on FX and 0.3 pts on indices.
Economic calendar
Web Trader platform
Our sophisticated web-based platform is packed with features.
Related articles

USD/JPY Coiled for CPI
It’s been a range-bound backdrop for USD/JPY after the excitement of the rally followed by the intervention-fueled reversal, and that can make it easy for traders to get lulled to sleep at a time when markets are prone to shots of volatility.

Nasdaq, NVDA Go Oversold for the First Time Since April 2025 Lows
It’s been a brutal backdrop in stocks and that started even before the election. And, notably, the day after last week’s election results saw a vigorous bounce, indicating that there’s something else behind the bearish push.

US Dollar Bears Lose Their Grip Ahead of NFP, USD/JPY Vols Elevated
US dollar selling pressure fades ahead of NFP as Fed hike bets retreat. USD/JPY stands out with a 141-pip implied move as FX volatility takes centre stage.

This report is intended for general circulation only. It should not be construed as a recommendation, or an offer (or solicitation of an offer) to buy or sell any financial products. The information provided does not take into account your specific investment objectives, financial situation or particular needs. Before you act on any recommendation that may be contained in this report, independent advice ought to be sought from a financial adviser regarding the suitability of the investment product, taking into account your specific investment objectives, financial situation or particular needs.
StoneX Financial Pte. Ltd., may distribute reports produced by its respective foreign entities or affiliates within the StoneX group of companies or third parties pursuant to an arrangement under Regulation 32C of the Financial Advisers Regulations. Where the report is distributed to a person in Singapore who is not an accredited investor, expert investor or an institutional investor (as defined in the Securities Futures Act), StoneX Financial Pte. Ltd. accepts legal responsibility to such persons for the contents of the report only to the extent required by law. Singapore recipients should contact StoneX Financial Pte. Ltd. at 6826 9988 for matters arising from, or in connection with the report.
In the case of all other recipients of this report, to the extent permitted by applicable laws and regulations neither StoneX Financial Pte. Ltd. nor its associated companies will be responsible or liable for any loss or damage incurred arising out of, or in connection with, any use of the information contained in this report and all such liability is hereby expressly disclaimed. No representation or warranty is made, express or implied, that the content of this report is complete or accurate.
StoneX Financial Pte. Ltd. is not under any obligation to update this report.
Trading CFDs carries a high level of risk that may not be suitable for some investors. Consider your investment objectives, level of experience, financial resources, risk appetite and other relevant circumstances carefully. The possibility exists that you could lose some or all of your investments, including your initial deposits. If in doubt, please seek independent expert advice. Visit www.forex.com/en-sg/terms-and-policies for the complete Risk Disclosure Statement.