



US Dollar Dominates as Bears Run for Cover, Yields Surge
US dollar surges as GDP and inflation revisions lift yields, forcing shorts to cover. DXY rebound, COT data, and key FX moves shape trader sentiment.
Share this:

The final GDP release rarely moves markets, but Thursday’s Q2 US growth figures proved an exception — much to the delight of US dollar bulls. GDP was revised up to 3.8% y/y from 3.3%, its strongest pace since Q3 2023. Consumer spending rose to 2.5% from 1.6%, while sales were revised up to 7.5% from 6.8%. Inflation also ticked higher in Q2, with PCE prices revised to 2.1%, core PCE at 2.6%, and super-core at 2.4%.
This has traders questioning the Fed’s rate-cut path. Fed funds futures still price an 85% chance of a November cut, but that’s down from near-certainty earlier this week. The odds of a December cut have slipped to 60%, while expectations of further cuts into 2026 have faded. Yields pushed higher across the curve, with the 2-year rising 7.3bp to 3.6% (more than double its 1-year daily average move of 3.5bp). The 10-year climbed 9.3bp and the 30-year added 9.5bp.
View related analysis:
View related analysis:

Chart analysis by Matt Simpson - data source: TradingView
US Dollar Rally Fueled by Rising Yields and Short Covering
The US dollar was the strongest major, driven by a mix of short-covering and fresh long positions.
- The Japanese yen weakened for a second day, allowing USD/JPY to finally break out of its 38-day range, with bulls eyeing a move above 150
- USD/CHF rose for a second day, nearing 0.80. While the SNB kept rates on hold and is unlikely to return to negative rates, it reiterated its willingness to intervene in FX markets, providing support for USD/CHF
- EUR/USD slid back below 1.17, logging a second straight ~0.6% loss
- GBP/USD underperformed the euro, sending sterling to a 36-day low and EUR/GBP to a 44-day high
- The New Zealand dollar was the weakest major, with NZD/USD breaking below 0.58 to a 5-month low as RBNZ cut expectations resurfaced
- AUD/USD fell in line with my bearish bias from yesterday, hitting the 50-day averages. A break lower would bring 0.65 into play for bears
- USD/CAD gained for a fourth day, reaching an 18-week high


US Dollar Index (DXY) Technical Analysis
The 96 handle continues to provide solid demand for the US dollar index, having produced a key low in 2023 and twice again in 2025. A countertrend move now looks underway, but the question is how far it can extend. With the Fed unlikely to consider hikes at this stage, a full 6% rebound seems unlikely. Still, with traders net-short, the US dollar has scope for further upside in the near term.
A multi-week bullish divergence on the RSI (2) signalled the potential bounce, with two gravestone doji candles marking a double bottom around 96. While the RSI (2) has already pushed into overbought territory, bulls may prefer tighter stops, though the RSI (14) is curling higher and supports the case for a move towards the 50-week EMA (99.87).
A 100% projection of wave a from wave b lands near the recent cycle high and the 50-week EMA, creating a resistance cluster just below 100. A break higher would expose the 50-week SMA and the 138.2% Fibonacci projection near 102.
Given political pressure from the Trump administration for cuts, and the Fed’s reluctance to entertain hikes, the base case remains that any dollar gains are corrective rather than the start of a new uptrend.
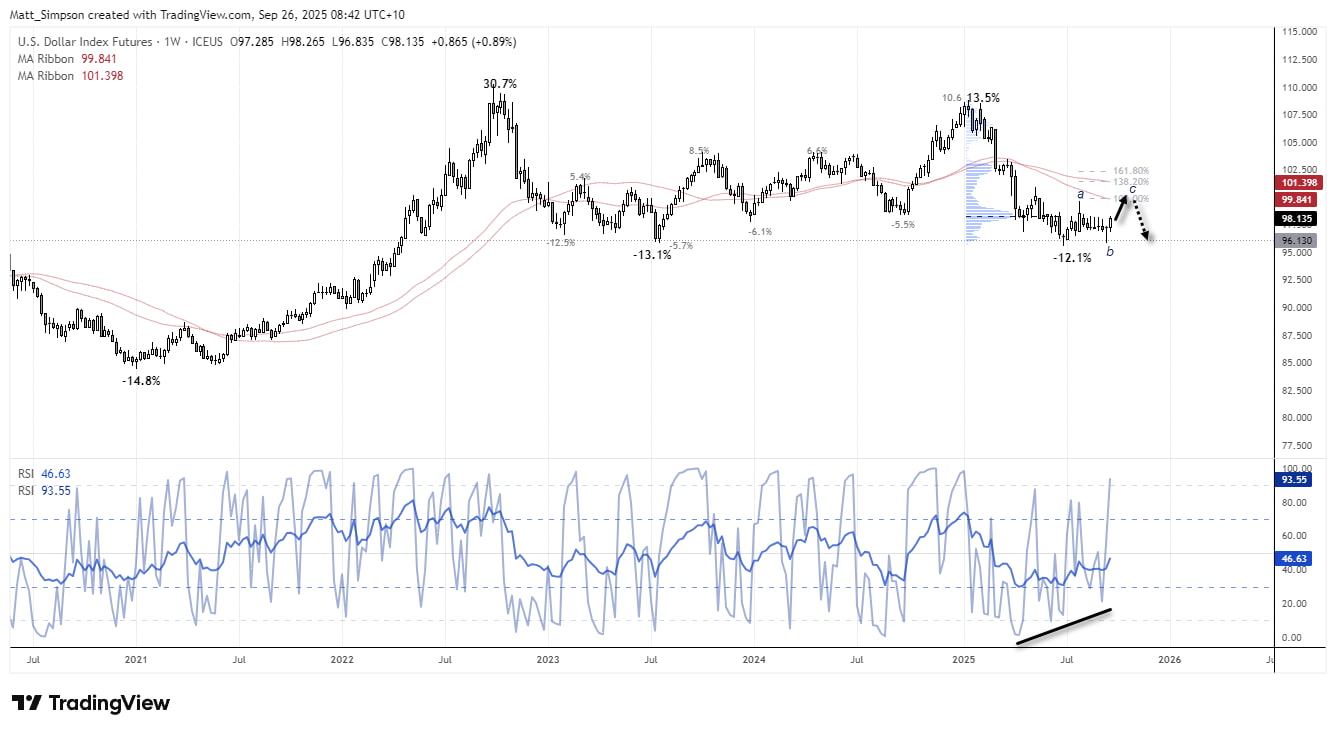
Chart analysis by Matt Simpson - data source: TradingView U.S. Dollar Index Futures
US Dollar Positioning (IMM Data): Weekly COT Report Analysis
The latest Commitment of Traders (COT) report shows that traders remain net-short on US dollar index (DXY) futures. Large speculators more than doubled their net-short exposure last week, largely due to heavy long liquidation, taking bearish positioning to a four-year high. Asset managers were also net-short by -8.8k contracts, close to a record level. Both groups appear on the wrong side of the trade, with Fed cut expectations being pared back and the US dollar staging a countertrend rebound.
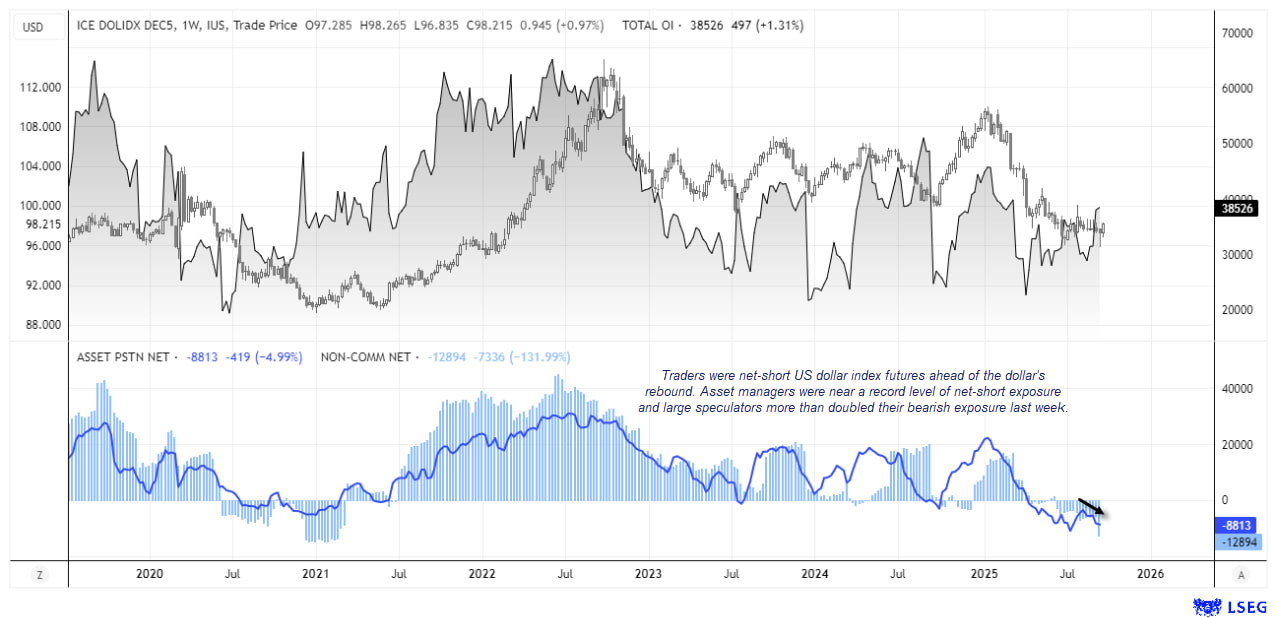
Chart analysis by Matt Simpson - data source: IMM, CME, LSEG


Key Economic Events for Traders (AEST / GMT+10)
09:30 JPY CPI, Tokyo Core CPI, Tokyo CPI, CPI Tokyo Ex Food and Energy, Unemployment Rate (Sep) (USD/JPY, EUR/JPY, Nikkei 225)
09:50 JPY Foreign Bonds Buying, Foreign Investments in Japanese Stocks (USD/JPY, EUR/JPY, Nikkei 225)
15:00 SGD Industrial Production (Aug) (USD/SGD, EUR/SGD, STI Index)
15:30 JPY BoJ Board Member Noguchi Speaks (USD/JPY, EUR/JPY, Nikkei 225)
17:00 EUR Spanish GDP (Q2) (EUR/USD, EUR/GBP, DAX)
19:30 EUR ECB President Lagarde Speaks (EUR/USD, EUR/JPY, DAX)
20:00 EUR France Jobseekers Total (Aug) (EUR/USD, EUR/GBP, CAC 40)
22:30 USD Core PCE Price Index, PCE Price Index, Personal Income, Personal Spending, Real Personal Consumption (Aug) (S&P 500, Nasdaq 100, USD/JPY, Gold, Crude Oil)
22:30 CAD GDP, Wholesale Sales (Jul/Aug) (USD/CAD, EUR/CAD, CAD/JPY)
23:00 USD Dallas Fed PCE (Aug), FOMC Member Barkin Speaks (S&P 500, Nasdaq 100, USD/JPY)
00:00 USD Michigan 1-Year Inflation Expectations, Michigan 5-Year Inflation Expectations, Michigan Consumer Expectations, Michigan Consumer Sentiment, Michigan Current Conditions (Sep) (S&P 500, Nasdaq 100, USD/JPY)
01:00 CAD Budget Balance (Jul) (USD/CAD, EUR/CAD, CAD/JPY)
01:30 USD Atlanta Fed GDPNow (Q3) (S&P 500, Nasdaq 100, USD/JPY)
View the full economic calendar
View the full economic calendar
-- Written by Matt Simpson
Follow Matt on Twitter @cLeverEdge
How to trade with City Index
You can trade with City Index by following these four easy steps:
- Open an account, or log in if you’re already a customer
• Open an account in the UK
• Open an account in Australia
• Open an account in Singapore
- Search for the market you want to trade in our award-winning platform
- Choose your position and size, and your stop and limit levels
- Place the trade
Related tags:
Latest market news




Open an account in minutes
Experience award-winning platforms with fast and secure execution, and enjoy tight spreads from 0.5 pts on FX and 0.3 pts on indices.
Economic calendar
Web Trader platform
Our sophisticated web-based platform is packed with features.
Related articles
USD/JPY Weekly Outlook: Volatility Has Left the Building
The yen has ignored broad dollar weakness, falling Treasury yields and renewed market turbulence. Yet its relationship with US interest rates remains intact. So why is USD/JPY going absolutely nowhere fast?
Swiss Franc Forecast: USD/CHF Seven-Week Rally Reverses From Yearly Highs 10 16 2026
A sharp rejection from fresh highs has shifted momentum in favor of USD/CHF bears, raising the stakes for a critical support test.


AUD/USD Bulls Fight Back After Australian Jobs Shock
AUD/USD has been hit by another ugly Australian employment report, sending RBA rate hike expectations sharply lower. Yet the relationships driving the currency have shifted since quarter-end, and improving risk appetite could provide the fuel for a recovery.
This report is intended for general circulation only. It should not be construed as a recommendation, or an offer (or solicitation of an offer) to buy or sell any financial products. The information provided does not take into account your specific investment objectives, financial situation or particular needs. Before you act on any recommendation that may be contained in this report, independent advice ought to be sought from a financial adviser regarding the suitability of the investment product, taking into account your specific investment objectives, financial situation or particular needs.
StoneX Financial Pte. Ltd., may distribute reports produced by its respective foreign entities or affiliates within the StoneX group of companies or third parties pursuant to an arrangement under Regulation 32C of the Financial Advisers Regulations. Where the report is distributed to a person in Singapore who is not an accredited investor, expert investor or an institutional investor (as defined in the Securities Futures Act), StoneX Financial Pte. Ltd. accepts legal responsibility to such persons for the contents of the report only to the extent required by law. Singapore recipients should contact StoneX Financial Pte. Ltd. at 6826 9988 for matters arising from, or in connection with the report.
In the case of all other recipients of this report, to the extent permitted by applicable laws and regulations neither StoneX Financial Pte. Ltd. nor its associated companies will be responsible or liable for any loss or damage incurred arising out of, or in connection with, any use of the information contained in this report and all such liability is hereby expressly disclaimed. No representation or warranty is made, express or implied, that the content of this report is complete or accurate.
StoneX Financial Pte. Ltd. is not under any obligation to update this report.
Trading CFDs carries a high level of risk that may not be suitable for some investors. Consider your investment objectives, level of experience, financial resources, risk appetite and other relevant circumstances carefully. The possibility exists that you could lose some or all of your investments, including your initial deposits. If in doubt, please seek independent expert advice. Visit www.forex.com/en-sg/terms-and-policies for the complete Risk Disclosure Statement.