



Australian Dollar Outlook: AUD/USD Under Pressure Ahead of CPI and PMIs
AUD/USD extends losses as traders await Australia’s CPI and PMIs, with falling volatility, rising bearish bets, and a stronger US dollar shaping the outlook.
Share this:

The Australian dollar is under pressure, with AUD/USD falling for a third day after the Federal Reserve’s less-dovish stance triggered renewed strength in the US dollar. Risk reversals show bearish bets building against the Aussie, while implied volatility continues to drift lower. This week’s spotlight is on Australia’s CPI and flash PMIs, alongside US PCE inflation, all of which could determine whether AUD/USD extends its retreat or finds support.
View related analysis:
View related analysis:
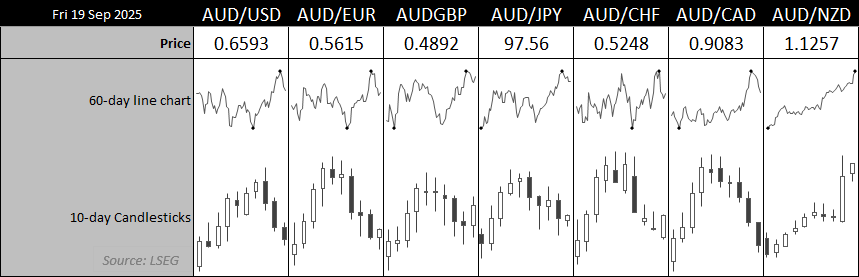
Chart prepared by Matt Simpson - data source: LSEG
- AUD/USD extended losses for a third straight day after a less-dovish-than-expected FOMC meeting, with risk reversals showing a rise in bearish bets over bullish ones.
- Implied volatility continues to trend lower for the Australian dollar.
- Wednesday’s inflation report will be key to determining whether last month’s rise was driven mainly by temporary factors or broader price pressures.
- Flash PMIs and US PCE data are additional events to watch.


Australian PMIs Signal Expansion Ahead of Inflation Data
Australia’s flash PMIs for September are due on Tuesday. While they are not usually a major market mover, they continue to show the economy in expansionary territory. July’s services report highlighted the steepest increase in activity in more than three years, alongside gains in employment, business activity, exports, and the forward-looking future activity index. Domestic and external demand are both improving.
Price pressures remained elevated in July but showed signs of easing. If this trend is repeated in the August data, it could raise hopes for a softer CPI reading in Wednesday’s monthly inflation release. That said, last month’s inflation surprise to the upside leaves open the question of whether it was a temporary blip or the start of a new inflationary phase.
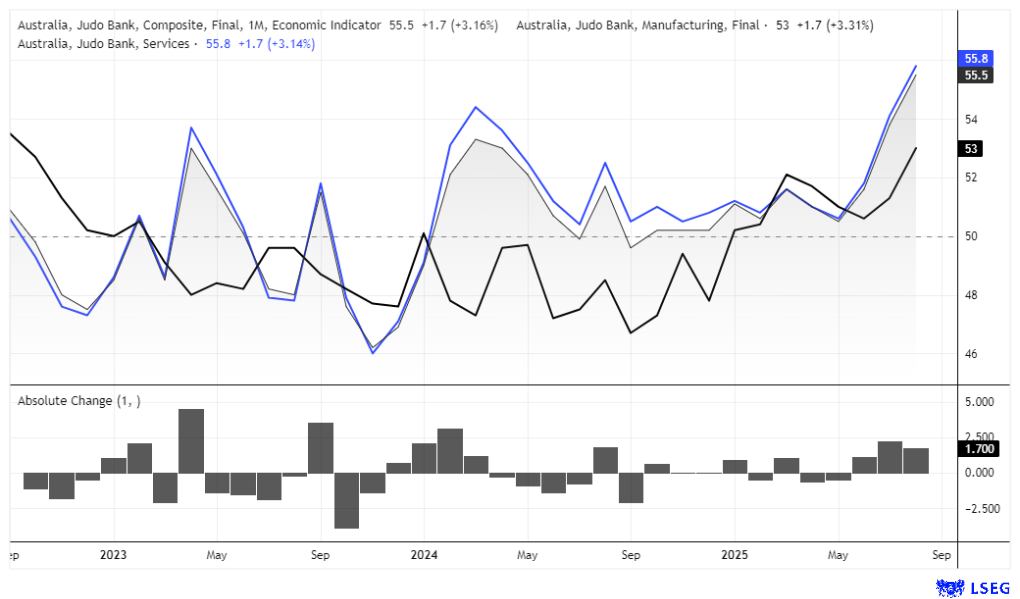
Chart analysis by Matt Simpson - data source: S&P Global, LSEG
Australian Inflation in Focus as RBA Rate Cut Bets Shift
Wednesday’s inflation report will be closely watched to determine whether July’s sharp CPI rise was mainly due to the expiry of electricity subsidies, or if price pressures were more broadly spread. Trimmed mean CPI rose 0.6 percentage points in July, though this measure excludes the top 15% of volatile items, suggesting the reflation may have been subsidy-driven.
If inflation remains elevated or accelerates further, expectations for RBA rate cuts could be pushed well into next year. To gain confidence that July’s spike was temporary, traders would likely want to see annual trimmed mean inflation fall by at least 0.6 percentage points.
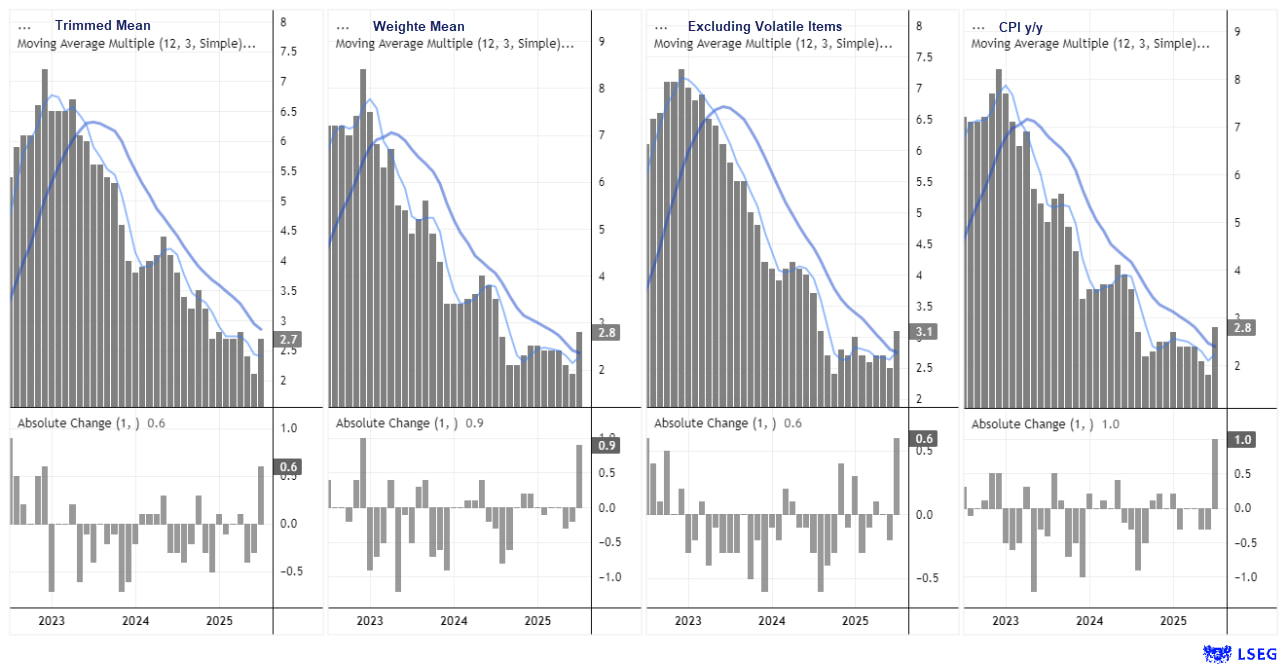
Chart prepared by Matt Simpson - data source: ABS, LSEG
AUD/USD Holds Strong Ties to China, NZD and Inverse USD Relationship
The relationship between the Australian dollar and China is realigning, with the 20-day correlation between AUD/USD and both copper and the CSI 300 index now back above 0.8. The correlation with the New Zealand dollar also remains strong, as does the inverted relationship with the US dollar.
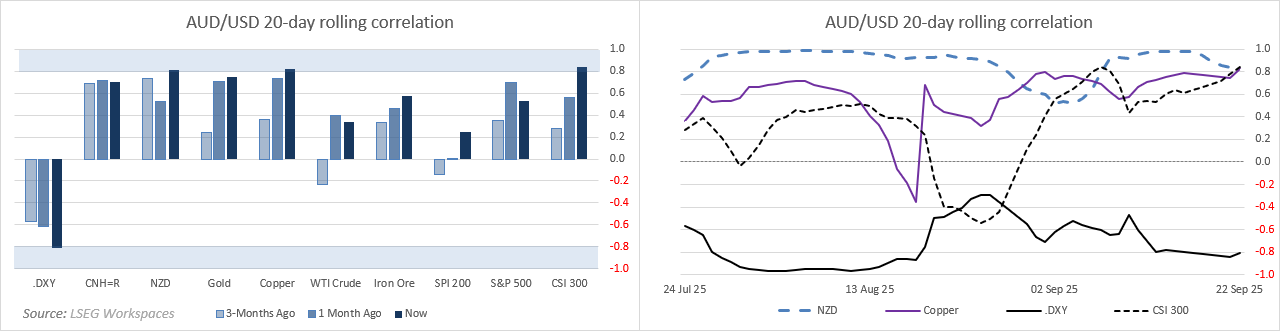
Chart prepared by Matt Simpson - data source: LSEG


Australian Dollar Implied Volatility Drops, Bearish Bets Rise
Expectations of future volatility in AUD/USD continue to trend lower, with 1-month implied volatility falling to a 14-month low last week. While overnight implied volatility spiked around the FOMC meeting, it too dropped back to a 2-month low by Friday’s close, sitting well below the 1-week measure. With US PCE inflation now the key data point rather than employment, volatility is likely to remain subdued unless Australia’s CPI delivers a surprise or another fresh catalyst emerges.
Risk reversals have eased from their recent cycle highs alongside AUD/USD after the FOMC meeting, reflecting a rise in puts (bearish bets) relative to calls (bullish bets). Whether this is simply a retracement within the broader bullish trend or the start of a reversal is unclear, though at this stage the pullback looks limited.

Chart prepared by Matt Simpson - data source: LSEG
AUD/USD Pulls Back as DXY Rebound Tests Key Resistance
The sharp rebound in the US dollar cannot be ignored. Its post-FOMC three-day rally marked the strongest run in six weeks and confirmed a double bottom at the 2023 low, reinforcing that level as strong support. However, upside potential may be capped if the labour market continues to soften, supporting expectations for Fed cuts. For now, much of the move looks like short-covering from traders positioned for a 50bp cut that never materialised.
For AUD/USD, the reversal around 0.6680 was unsurprising given the confluence of the November high and the 200-week moving averages. The question now is how deep a retracement we’ll see. Bears are likely eyeing the 0.6543 high-volume node (HVN) as an initial target, though a particularly weak inflation print may be needed to drive the Aussie below 0.65. On the DXY side, resistance sits at 98.33, and until that breaks, the broader rebound is likely to remain limited.
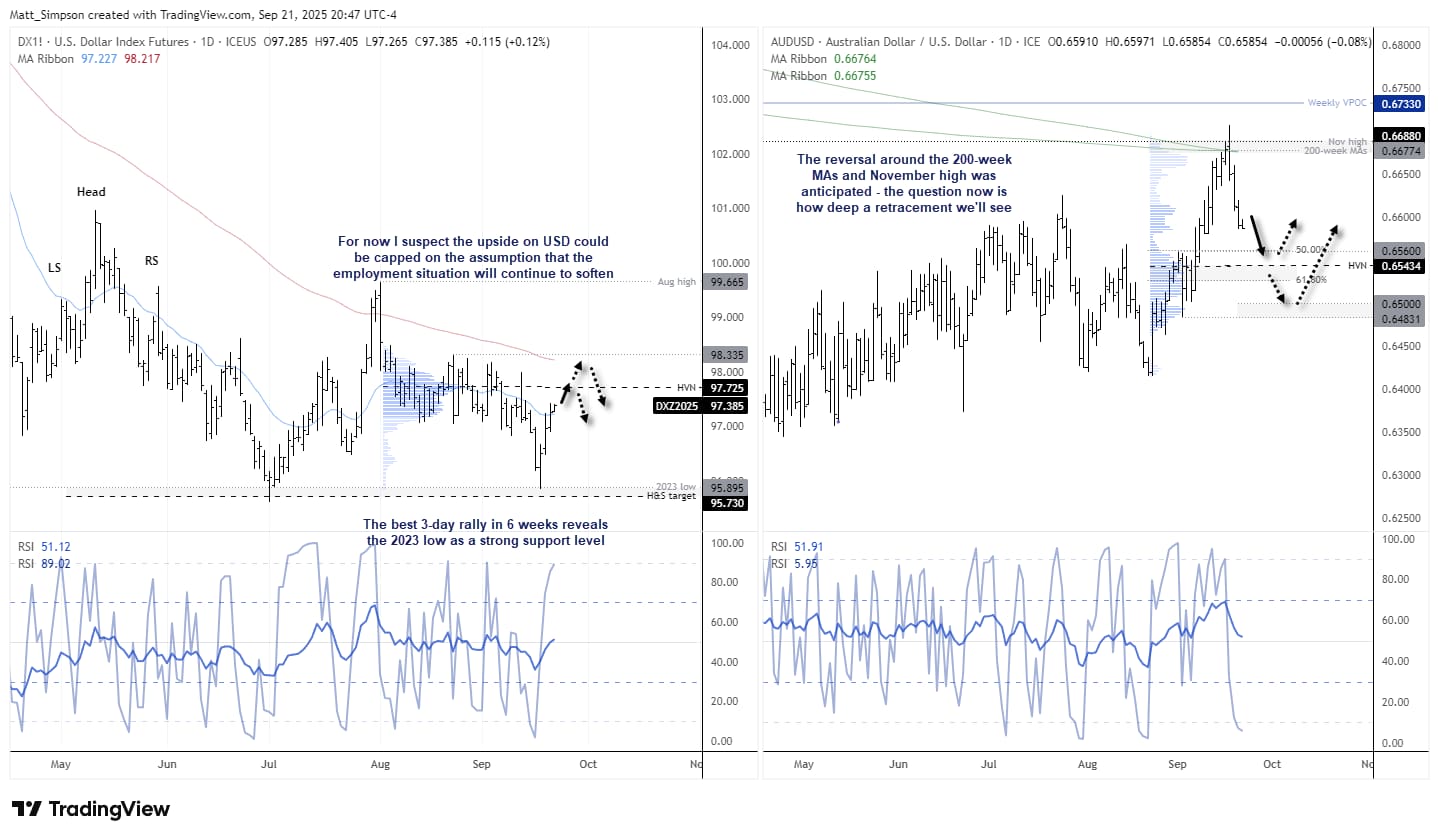
Chart analysis by Matt Simpson - data source: TradingView AUD/USD
View the full economic calendar
View the full economic calendar
-- Written by Matt Simpson
Follow Matt on Twitter @cLeverEdge
How to trade with City Index
You can trade with City Index by following these four easy steps:
- Open an account, or log in if you’re already a customer
• Open an account in the UK
• Open an account in Australia
• Open an account in Singapore
- Search for the market you want to trade in our award-winning platform
- Choose your position and size, and your stop and limit levels
- Place the trade



Open an account in minutes
Experience award-winning platforms with fast and secure execution, and enjoy tight spreads from 0.5 pts on FX and 0.3 pts on indices.
Economic calendar
Web Trader platform
Our sophisticated web-based platform is packed with features.
Related articles

USD/JPY Forecast: Is Rising Japanese Inflation Supporting the Yen?
As the trading week comes to an end, one of the most relevant developments in the FX market has been the renewed strength of the Japanese yen. This can be seen in the recent performance of USD/JPY, which has fallen nearly 1.0% over the last two trading sessions, highlighting a meaningful recovery in the Japanese currency against the U.S. dollar.


Australian Dollar Forecast: AUD/USD Support Reversal Sparks Monthly Range Breakout 10 23 2026
A sharp reversal off key support has fueled the AUD/USD recovery, with resistance now in focus ahead of next week’s Fed decision and Australian CPI.

USD/JPY, Nikkei Break Lower as AI Meltdown Spreads
Thursday’s tech tantrum has become Friday’s fire sale. With Nikkei support giving way and the yen strengthening, could the selling start feeding on itself?

This report is intended for general circulation only. It should not be construed as a recommendation, or an offer (or solicitation of an offer) to buy or sell any financial products. The information provided does not take into account your specific investment objectives, financial situation or particular needs. Before you act on any recommendation that may be contained in this report, independent advice ought to be sought from a financial adviser regarding the suitability of the investment product, taking into account your specific investment objectives, financial situation or particular needs.
StoneX Financial Pte. Ltd., may distribute reports produced by its respective foreign entities or affiliates within the StoneX group of companies or third parties pursuant to an arrangement under Regulation 32C of the Financial Advisers Regulations. Where the report is distributed to a person in Singapore who is not an accredited investor, expert investor or an institutional investor (as defined in the Securities Futures Act), StoneX Financial Pte. Ltd. accepts legal responsibility to such persons for the contents of the report only to the extent required by law. Singapore recipients should contact StoneX Financial Pte. Ltd. at 6826 9988 for matters arising from, or in connection with the report.
In the case of all other recipients of this report, to the extent permitted by applicable laws and regulations neither StoneX Financial Pte. Ltd. nor its associated companies will be responsible or liable for any loss or damage incurred arising out of, or in connection with, any use of the information contained in this report and all such liability is hereby expressly disclaimed. No representation or warranty is made, express or implied, that the content of this report is complete or accurate.
StoneX Financial Pte. Ltd. is not under any obligation to update this report.
Trading CFDs carries a high level of risk that may not be suitable for some investors. Consider your investment objectives, level of experience, financial resources, risk appetite and other relevant circumstances carefully. The possibility exists that you could lose some or all of your investments, including your initial deposits. If in doubt, please seek independent expert advice. Visit www.forex.com/en-sg/terms-and-policies for the complete Risk Disclosure Statement.