


Australian Dollar Forecast: AUD/USD Breaks Multi-Month Range, Hits 10-Month Low
Aussie bears are closing in on major technical support, with next week's Australian employment data raising the stakes for a pivotal reaction.
Share this:

Australian Technical Forecast: AUD/USD Weekly Trade Levels
- AUD/USD fell for a fourth consecutive session on Friday, extending its weekly losing streak to three as weekly momentum dropped to its lowest level since April 2025.
- The break below the broader consolidation has shifted the technical outlook lower, with sellers now approaching a major support confluence.
- A decisive weekly close below this threshold would strengthen the bearish outlook and expose further downside objectives.
- Former support now defines initial resistance, with a sustained recovery above the September downtrend needed to suggest a more significant low is developing.
- Next week's RBA minutes and Australian employment report headline event risk, alongside U.S. retail sales and FOMC minutes.
- Resistance 6890/94, 6938/46 (key), 7032 - Support 6724/57 (key), 6674, 6596
The Australian Dollar enters mid-November under mounting selling pressure after the October recovery failed to gain traction, leaving AUD/USD increasingly vulnerable to a deeper correction. The latest decline has extended more than 6.4% off the September high and materially weakened the medium-term technical structure. Sellers are now approaching a significant support confluence where the immediate move lower could encounter renewed opposition. While the broader outlook continues to favor the bears, the proximity of this threshold raises the prospect of a near-term exhaustion low and potential recovery attempt. The next reaction will be particularly important in determining whether the recent technical deterioration develops into a more sustained decline toward year-end. Battle lines drawn on the AUD/USD weekly technical chart.
Review my latest Weekly Strategy Webinar for an in-depth breakdown of this AUD/USD technical setup and more. Join me live Mondays at 8:30am EST and tune in to the Opening Bell Tuesday through Friday at 9:30am EST for continued market coverage throughout the week. All episodes are archived on my YouTube Playlist.
Australian Dollar Price Chart – AUD/USD Weekly
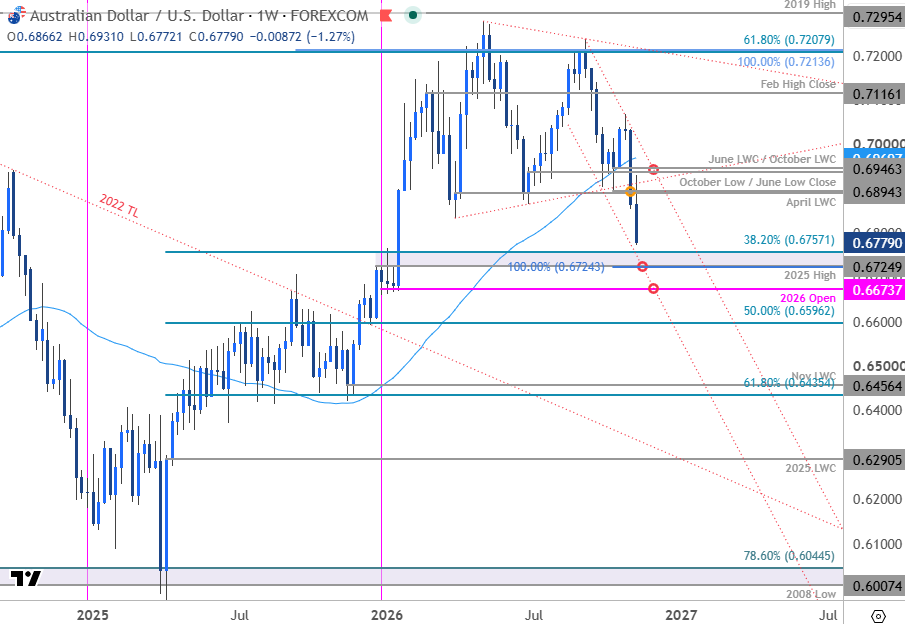
Chart Prepared by Michael Boutros, Sr. Technical Strategist; AUD/USD on TradingView
Technical Outlook: In last month’s Australian Dollar Forecast we noted that, AUD/USD had “rebounded off confluent support near the lower bounds of a multi-month consolidation pattern. From a trading standpoint, losses would need to be limited to 6938 IF price is heading higher on this stretch with a close above 7025 needed to keep the immediate recovery viable heading into the close of the month.” The recovery extended more than 2.5% off the October low and despite registering a close high at 7034, the bulls were unable to sustain the advance with the subsequent reversal posting a third consecutive weekly decline. Weekly RSI has now fallen to the lowest level since April 2025 and keeps the momentum profile in favor of the bears for now.
A decline of more than 4.1% from the October high has now broken below a multi-month consolidation structure with the bears now approaching a major technical confluence at 6725/57. This region is defined by the 100% extension of the September decline, the 2025 swing high, and the 38.2% retracement of the 2025 advance. Channel support converges on this threshold over the next few weeks. A break / weekly close below this pivot zone would be needed to fuel the next leg lower with subsequent support objectives seen at the 2026 yearly open at 6674 and the 50% retracement at 6596.
Weekly resistance is now eyed back at 6890/94- a region defined by the April low-week close, the October low, and the June low close. Key resistance / bearish invalidation is now lowered to the June / October low-week closes (LWC) at 6938/46. Note that the September trendline converges on this level into the open of December and a breach / weekly close above would be needed to suggest a more significant low is in place, and a larger reversal is underway. Subsequent resistance objectives eyed at the 200-day moving average (currently ~6970) and the October high-week close at 7032.

Bottom line: AUD/USD has broken a multi-month consolidation pattern with price falling to the lowest level since late-January. From a trading standpoint, rallies would need to be limited to 6894 IF price is heading lower on this stretch – look for a larger reaction on a test of the 6725/57 support zone with a weekly close below needed to fuel the next major leg of the decline.
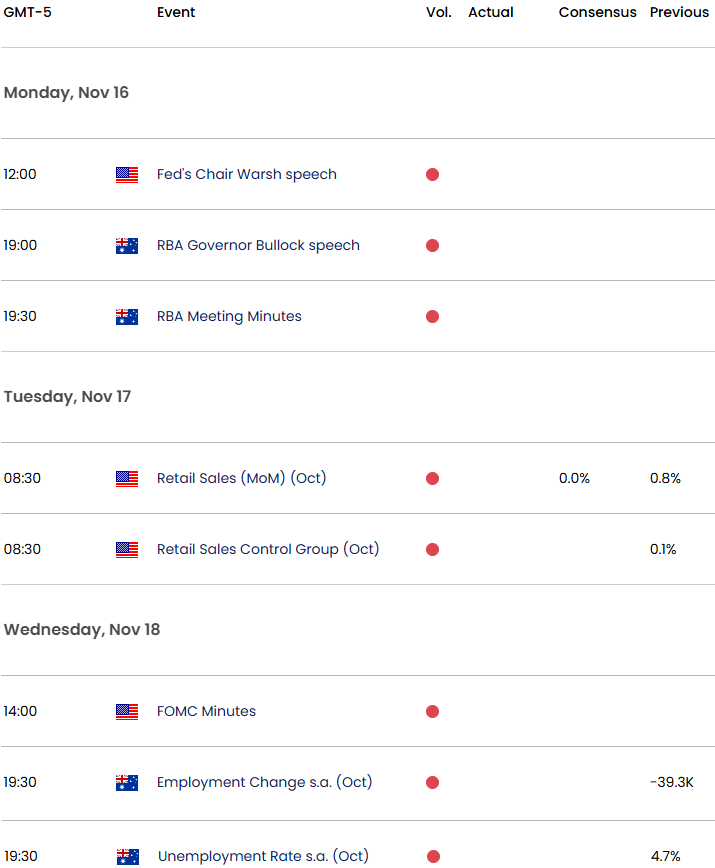
AUD/USD event risk next week will center on the RBA minutes Tuesday and Australia’s October employment report Thursday. The minutes will offer further insight into the RBA’s recent 25-basis-point hike and the removal of its explicit tightening bias, while the labor data will test whether the Bank can justify keeping policy restrictive as the pair trades near a 10-month low. Strong employment data could challenge expectations that the November hike marked the end of the tightening cycle and help AUD/USD stabilize. U.S. retail sales and the FOMC minutes add dollar-side risk, with firm U.S. activity or a hawkish Fed read likely to keep pressure on the pair. Stay nimble into the releases and watch the weekly closes for guidance. Review my latest Australian Dollar Short-term Outlook for a closer look at the near-term AUD/USD technical trade levels.
Australia / US Economic Calendar
Economic Calendar - latest economic developments and upcoming event risk.
Active Weekly Technical Charts
- Swiss Franc (USD/CHF)
- British Pound (GBP/USD)
- US Dollar Index (DXY)
- Euro (EUR/USD)
- Gold (XAU/USD)
- Bitcoin (BTC/USD)
- Canadian Dollar (USD/CAD)
- Japanese Yen (USD/JPY)
- S&P 500, Nasdaq, Dow
--- Written by Michael Boutros, Senior Technical Strategist
Follow Michael on X @MBForex


Open an account in minutes
Experience award-winning platforms with fast and secure execution, and enjoy tight spreads from 0.5 pts on FX and 0.3 pts on indices.
Economic calendar
Web Trader platform
Our sophisticated web-based platform is packed with features.
Related articles
Australian Dollar Forecast: AUD/USD Breaks Multi-Month Range, Hits 10-Month Low 11 14 2026
Aussie bears are closing in on major technical support, with next week's Australian employment data raising the stakes for a pivotal reaction.

USD/JPY Weekly Outlook: Bulls Eye Higher Range After Historic Rate Shock
A historic US rate shock has sent USD/JPY above 160, but with intervention risks rising and few major economic catalysts ahead, AI sentiment could hold the key to the next move.


US Dollar Price Action Setups: EUR/USD, USD/JPY
The US Dollar broke out to a fresh yearly high after the CPI report, and that Dollar strength was on full view in pretty much all major pairings with a particular push in EUR/USD.

This report is intended for general circulation only. It should not be construed as a recommendation, or an offer (or solicitation of an offer) to buy or sell any financial products. The information provided does not take into account your specific investment objectives, financial situation or particular needs. Before you act on any recommendation that may be contained in this report, independent advice ought to be sought from a financial adviser regarding the suitability of the investment product, taking into account your specific investment objectives, financial situation or particular needs.
StoneX Financial Pte. Ltd., may distribute reports produced by its respective foreign entities or affiliates within the StoneX group of companies or third parties pursuant to an arrangement under Regulation 32C of the Financial Advisers Regulations. Where the report is distributed to a person in Singapore who is not an accredited investor, expert investor or an institutional investor (as defined in the Securities Futures Act), StoneX Financial Pte. Ltd. accepts legal responsibility to such persons for the contents of the report only to the extent required by law. Singapore recipients should contact StoneX Financial Pte. Ltd. at 6826 9988 for matters arising from, or in connection with the report.
In the case of all other recipients of this report, to the extent permitted by applicable laws and regulations neither StoneX Financial Pte. Ltd. nor its associated companies will be responsible or liable for any loss or damage incurred arising out of, or in connection with, any use of the information contained in this report and all such liability is hereby expressly disclaimed. No representation or warranty is made, express or implied, that the content of this report is complete or accurate.
StoneX Financial Pte. Ltd. is not under any obligation to update this report.
Trading CFDs carries a high level of risk that may not be suitable for some investors. Consider your investment objectives, level of experience, financial resources, risk appetite and other relevant circumstances carefully. The possibility exists that you could lose some or all of your investments, including your initial deposits. If in doubt, please seek independent expert advice. Visit www.forex.com/en-sg/terms-and-policies for the complete Risk Disclosure Statement.