



BTC Re-Tests 90K – is the Big Picture Bitcoin Bull Back for Good?
Bitcoin pulled back hard over the past seven weeks, but hope is back in the air as both US equity markets and BTC have rallied from last Friday’s lows. This article looks at a bearish approach and a bullish approach using recent price action structure.
Share this:

It’s been a painful six-week run in Bitcoin as a -35.69% sell-off took over. But, as the old saying goes, major tops or bottoms like to make themselves known, and the reaction around 85k last Friday has made a mark, and that has since led into a shift with prices now building back up to the 90k level.
There’s something for everyone here – if you’re bearish Bitcoin, we have a big resistance level in-play with more context a little higher. If you’re bullish, there’s now short-term structure of higher-highs and higher-lows to work with. Both sides are analyzed in this article.

Bitcoin hasn’t experienced a drawdown of this magnitude since the 2021 top, which led to a massive -77.57% retracement that ultimately bottomed just about three years ago. Interestingly, that low came in after capitulation from the selling around the FTX fiasco, and it took some time, but bulls slowly but surely got back in-charge.
It was the risk on mood of 2023 that helped massively and that helped BTC to get up to 70k, which is right around where it had stalled previously in 2021. But the election of Donald Trump as US President drove a parabolic trend that finally allowed the cryptocurrency to push above the 100k threshold.
Thickening the plot is the correlation that’s shown of recent between stock markets and Bitcoin, with the Nasdaq’s recovery this week, following a test of lows last Friday, mirroring that of Bitcoin. BTC/USD came very close to touching the 80k psychological level, but buyers showed up early, helping to build support around 85k. And in the three days so far this week, that’s led to a short-term sequence of higher-highs and lows.
BTC/USD Daily Chart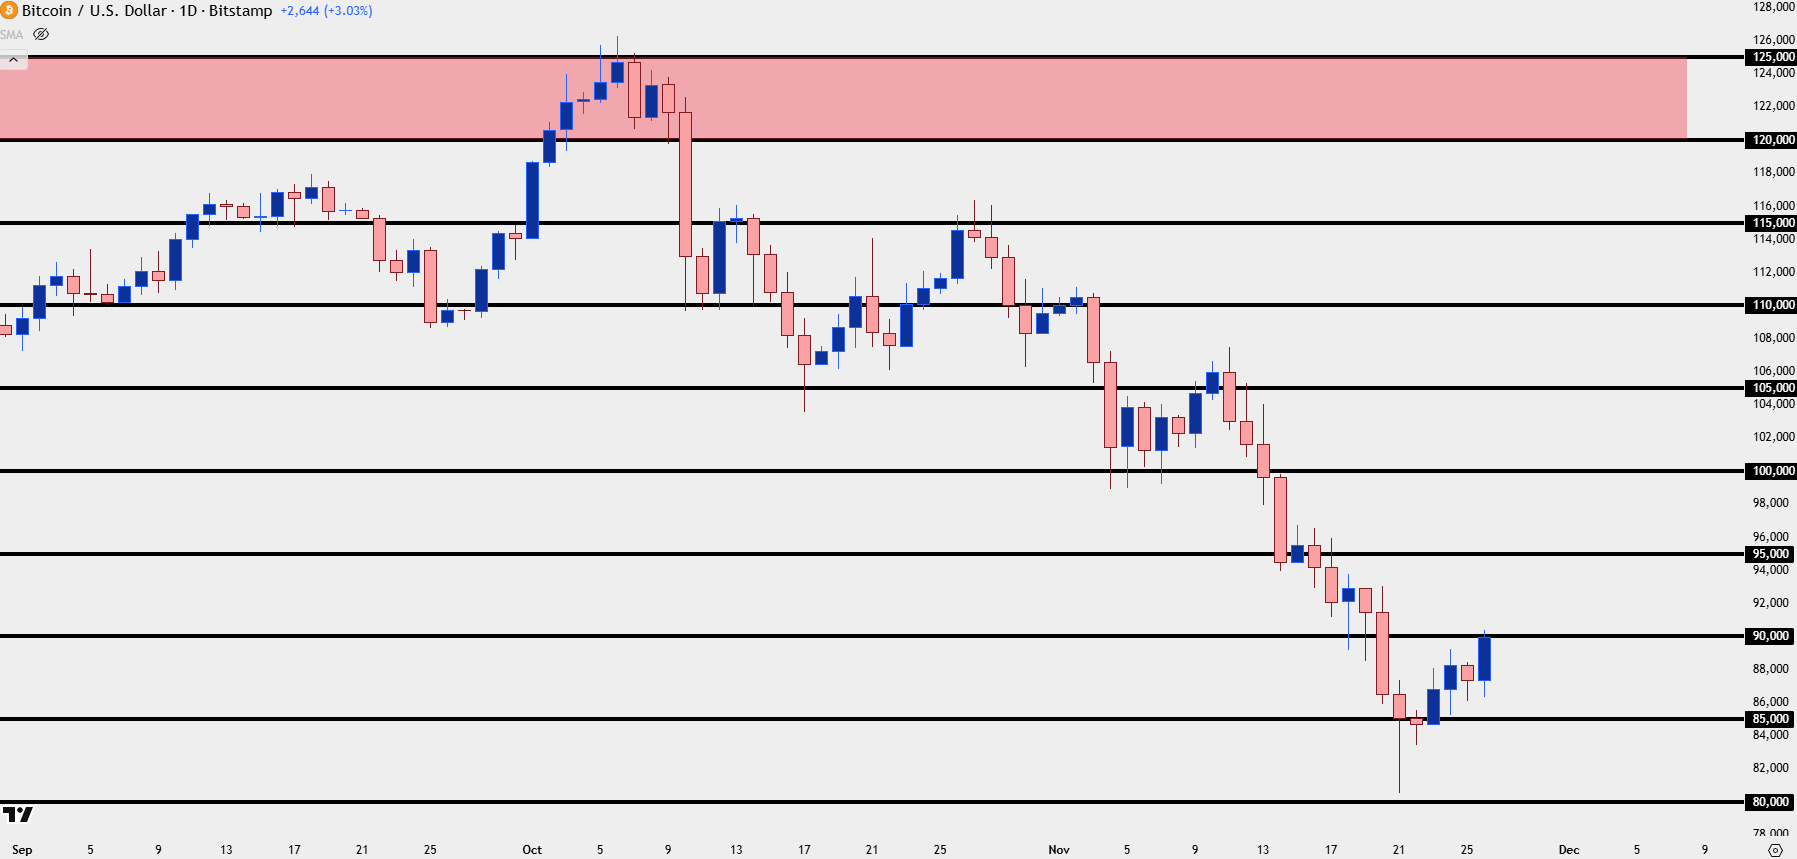
Chart prepared by James Stanley; data derived from Tradingview
BTC/USD for Bears
If bearish on Bitcoin, there’s now a bounce that could start to show attraction for selling into, and a hold of the 90k psychological level would be an attractive first step to such a thesis. But, even if the short-term rally continues, there’s more context for lower-high resistance given that the last swing high was all the way up at 107,465.
From the four-hour chart below we can already see 90k seeing some selling pressure, although its still early in that process; but above that is a spot of support-turned-resistance at 92,929 and that’s followed by a 100k level that showed support a couple of different times before sellers ultimately were able to drive the trend below it; and it was that bounce that built into the recent lower-high at 107,465.
But because 100k is such a massively important level, this also places importance at 95k, as ideally for bears, there would be an element of bearish anticipation that would bring selling pressure in before price could move up to the big figure at $100,000.
I would consider invalidation at this point with a push beyond 107,465 which would take out the most recent lower-high from the daily chart.
BTC/USD Four-Hour Chart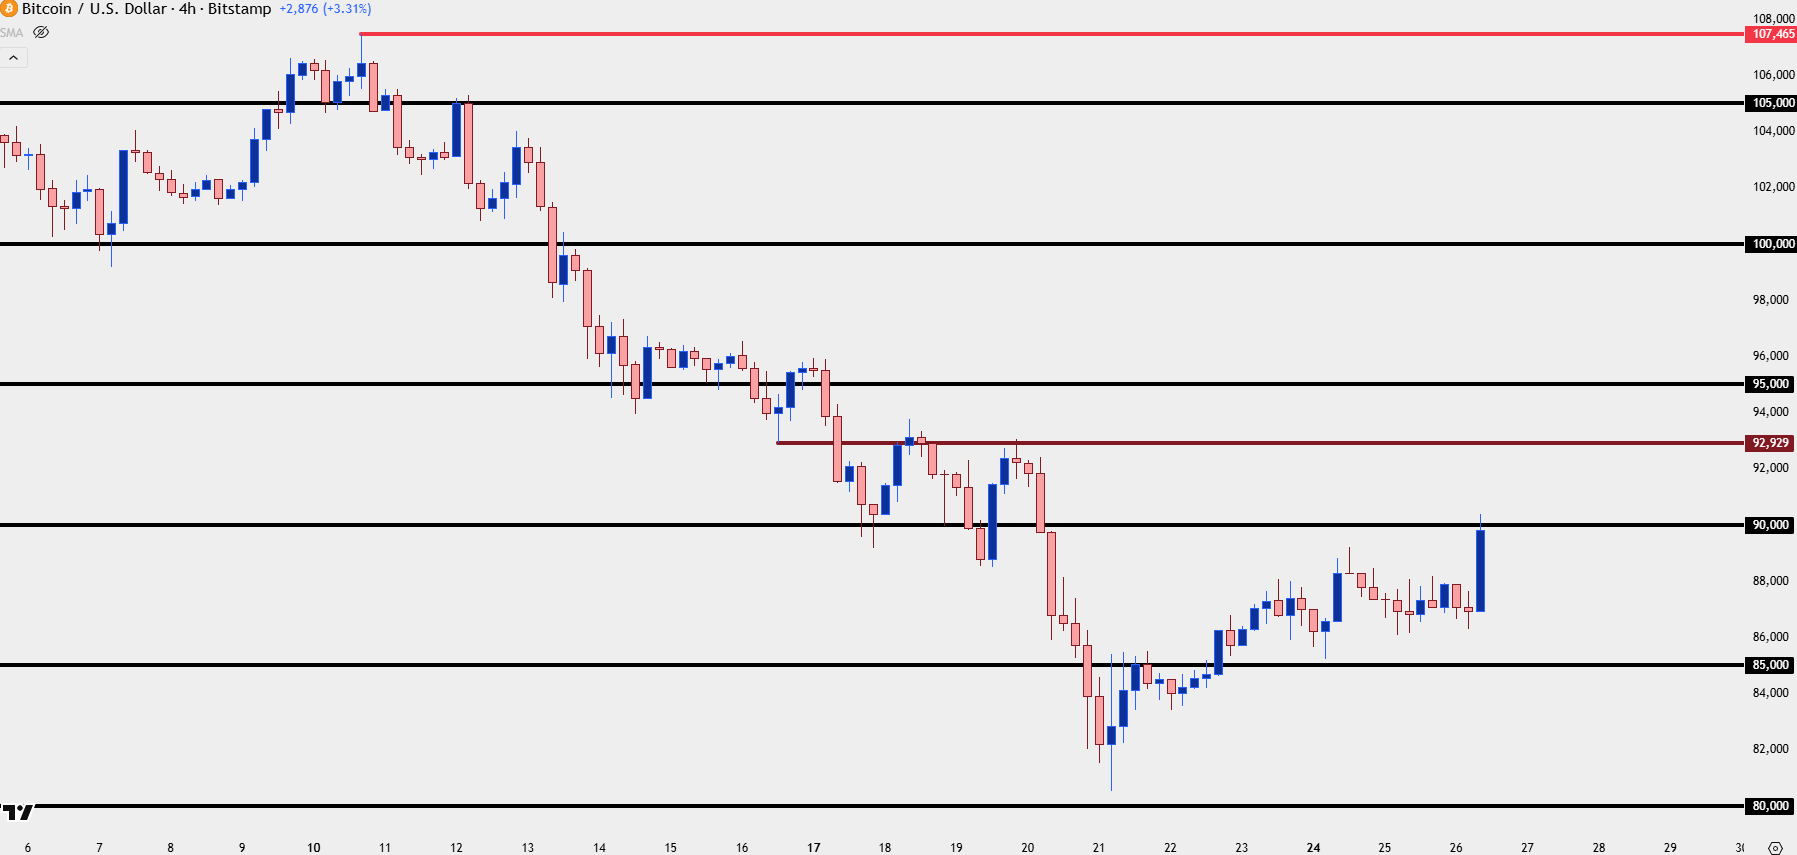
Chart prepared by James Stanley; data derived from Tradingview
BTC/USD Shorter-Term
The bounce hasn’t quite been building for a week but it’s the recent progress that is perhaps most encouraging. Initially, 85k held highs on Friday but over the weekend sellers showed fatigue, allowing for higher-lows to build that, eventually, led to breakout.
The initial move past 85k wasn’t exactly a burning trend higher, but after a check back for support of prior resistance, buyers have been putting in work to allow for the 90k re-test, and this, at the least, can provide some bullish short-term structure for traders to work with if they do want to push the long side of Bitcoin.
I’m currently tracking two support zones of note, one aggressive and one more conservative. The aggressive zone in aqua below is another spot of support-turned-resistance, and this runs from previous swing lows at 88,523 up to 89,189. If buyers are aggressive, then that’s the spot that they would ideally defend to allow for another test and then, eventually a possible break and rally beyond the 90k level.
A bit deeper we have that prior resistance from a week ago, from 85k up to 85,409, and if buyers can’t defend that, then this entire bounce is going to look like it was largely just a short-covering rally.
For the bullish scenario, a breakout beyond 90k then opens the door for test of prior support-turned-resistance at 92,929 after which 95k and then 100k come into the picture.
BTC/USD Two-Hour Price Chart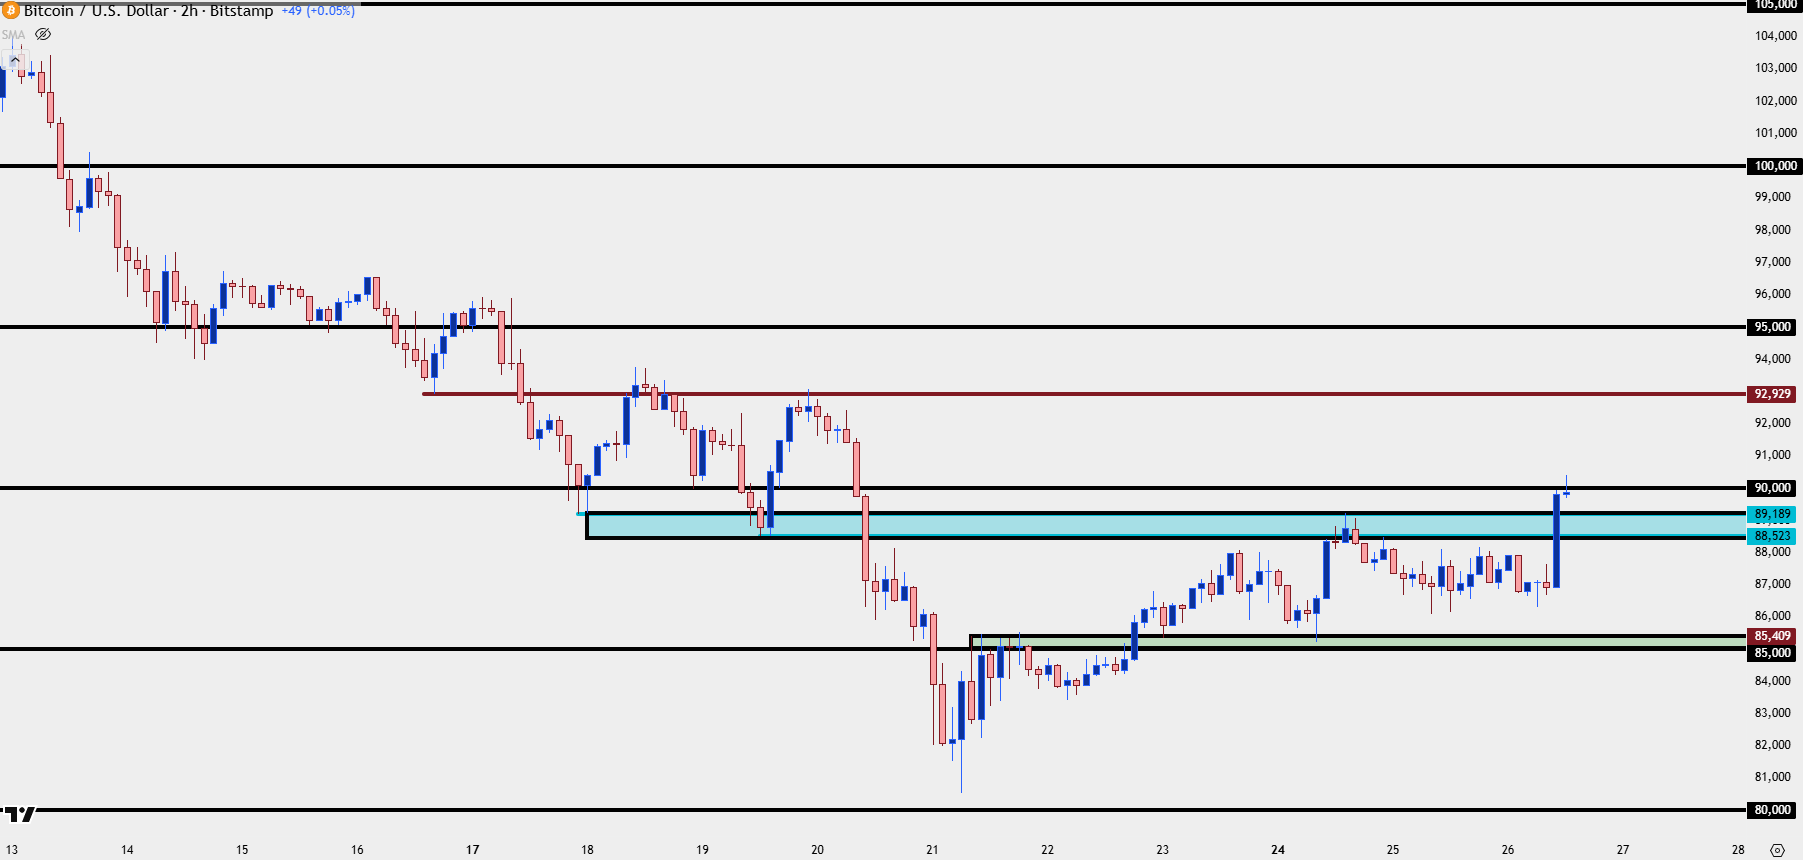
Chart prepared by James Stanley; data derived from Tradingview
--- written by James Stanley, Senior Market Analyst, Global Macro
Related tags:



Open an account in minutes
Experience award-winning platforms with fast and secure execution, and enjoy tight spreads from 0.5 pts on FX and 0.3 pts on indices.
Economic calendar
Web Trader platform
Our sophisticated web-based platform is packed with features.
Related articles

Gold Price Outlook: XAU/USD Resistance at $4200 Sets Up for NFP
It was a strong sell-off to start the week in gold and despite a Tuesday bounce, sellers are continuing to push following a resistance hit at the $4200 level.

Nasdaq Breakout Potential into Q4 for Melt Up Scenarios
The headlines seem negative in almost any place that you look, with surging Treasury yields and frothy AI valuations getting more and more attention. But, if it’s so bad, why hasn’t the Nasdaq melted down yet, even as the Fed has started hiking rates?

Japanese Yen Technical Analysis: USD/JPY Support Test into Core PCE
USD/JPY has been a battlefield for the past two months as the force of intervention and the threat of more have given sellers an advantage, even as buyers have continued to bid support on pullbacks. This sets the stage for a massive finish to the week with Core PCE and Non-farm Payrolls.
This report is intended for general circulation only. It should not be construed as a recommendation, or an offer (or solicitation of an offer) to buy or sell any financial products. The information provided does not take into account your specific investment objectives, financial situation or particular needs. Before you act on any recommendation that may be contained in this report, independent advice ought to be sought from a financial adviser regarding the suitability of the investment product, taking into account your specific investment objectives, financial situation or particular needs.
StoneX Financial Pte. Ltd., may distribute reports produced by its respective foreign entities or affiliates within the StoneX group of companies or third parties pursuant to an arrangement under Regulation 32C of the Financial Advisers Regulations. Where the report is distributed to a person in Singapore who is not an accredited investor, expert investor or an institutional investor (as defined in the Securities Futures Act), StoneX Financial Pte. Ltd. accepts legal responsibility to such persons for the contents of the report only to the extent required by law. Singapore recipients should contact StoneX Financial Pte. Ltd. at 6826 9988 for matters arising from, or in connection with the report.
In the case of all other recipients of this report, to the extent permitted by applicable laws and regulations neither StoneX Financial Pte. Ltd. nor its associated companies will be responsible or liable for any loss or damage incurred arising out of, or in connection with, any use of the information contained in this report and all such liability is hereby expressly disclaimed. No representation or warranty is made, express or implied, that the content of this report is complete or accurate.
StoneX Financial Pte. Ltd. is not under any obligation to update this report.
Trading CFDs carries a high level of risk that may not be suitable for some investors. Consider your investment objectives, level of experience, financial resources, risk appetite and other relevant circumstances carefully. The possibility exists that you could lose some or all of your investments, including your initial deposits. If in doubt, please seek independent expert advice. Visit www.forex.com/en-sg/terms-and-policies for the complete Risk Disclosure Statement.