



Earnings Play Baker Hughes
Baker Hughes' 2Q earnings release is expected on Wednesday. Here is what to look out for.
Share this:

On Wednesday, before market, Baker Hughes (BKR) is anticipated to report second quarter LPS of $0.01 compared to an EPS of $0.20 a year ago on revenue of approximately $4.7 vs. $6.0B last year. Baker Hughes is an oilfield services and equipment company and its current analyst consensus rating is 24 buys, 5 holds and 0 sells, according to Bloomberg.
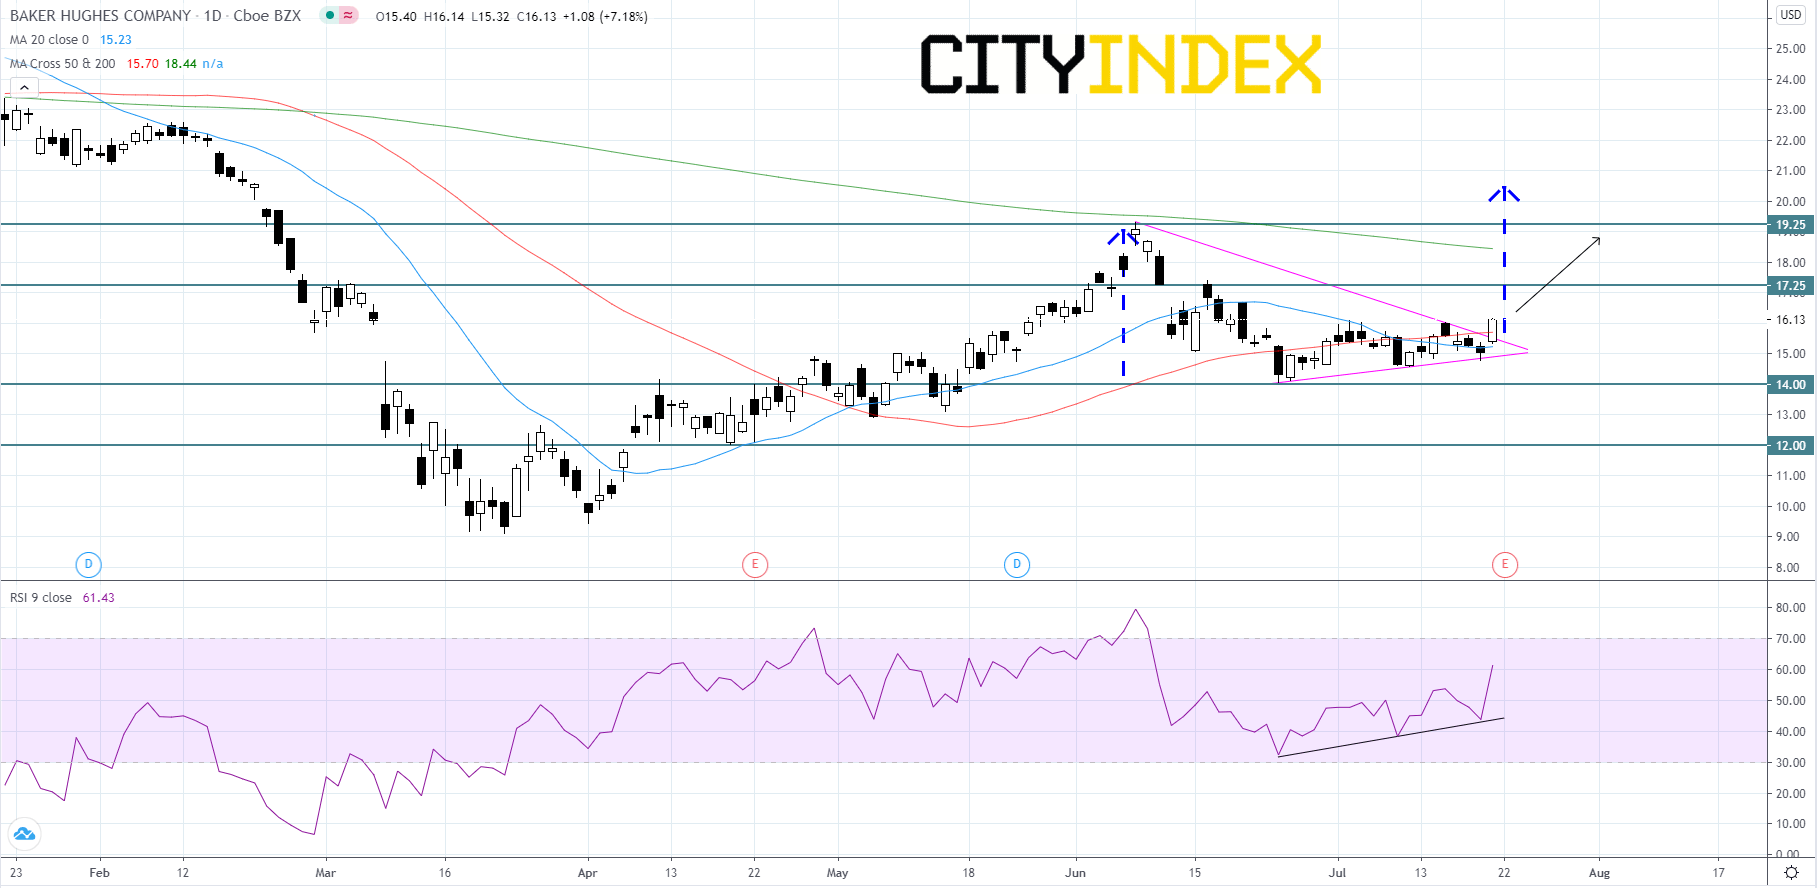
Looking at a daily chart, Baker Hughes' stock price is breaking to the upside of a symmetrical triangle pattern that price has been bouncing within since early-June. The breakout from the upper trend line in the symmetrical triangle pattern indicates the start of a new bullish trend. The RSI is currently above its 50 level and rising. The blue dotted arrows represent a measured move using the peak and trough of the triangle pattern. Price will likely advance towards the $17.25 level, surpass it and grind upwards to retest the most recent high at $19.25. If price cannot hold above the upper trend line, then it will probably fall back to the $14.00 support. Price could bounce off the $14.00 level and continue upwards, however if price breaks below $14.00, it could possibly drop back to $12.00.
Source: GAIN Capital, TradingView
Looking at a daily chart, Baker Hughes' stock price is breaking to the upside of a symmetrical triangle pattern that price has been bouncing within since early-June. The breakout from the upper trend line in the symmetrical triangle pattern indicates the start of a new bullish trend. The RSI is currently above its 50 level and rising. The blue dotted arrows represent a measured move using the peak and trough of the triangle pattern. Price will likely advance towards the $17.25 level, surpass it and grind upwards to retest the most recent high at $19.25. If price cannot hold above the upper trend line, then it will probably fall back to the $14.00 support. Price could bounce off the $14.00 level and continue upwards, however if price breaks below $14.00, it could possibly drop back to $12.00.
Source: GAIN Capital, TradingView
On Wednesday, before market, Baker Hughes (BKR) is anticipated to report second quarter LPS of $0.01 compared to an EPS of $0.20 a year ago on revenue of approximately $4.7 vs. $6.0B last year. Baker Hughes is an oilfield services and equipment company and its current analyst consensus rating is 24 buys, 5 holds and 0 sells, according to Bloomberg.
Looking at a daily chart, Baker Hughes' stock price is breaking to the upside of a symmetrical triangle pattern that price has been bouncing within since early-June. The breakout from the upper trend line in the symmetrical triangle pattern indicates the start of a new bullish trend. The RSI is currently above its 50 level and rising. The blue dotted arrows represent a measured move using the peak and trough of the triangle pattern. Price will likely advance towards the $17.25 level, surpass it and grind upwards to retest the most recent high at $19.25. If price cannot hold above the upper trend line, then it will probably fall back to the $14.00 support. Price could bounce off the $14.00 level and continue upwards, however if price breaks below $14.00, it could possibly drop back to $12.00.

Source: GAIN Capital, TradingView
Looking at a daily chart, Baker Hughes' stock price is breaking to the upside of a symmetrical triangle pattern that price has been bouncing within since early-June. The breakout from the upper trend line in the symmetrical triangle pattern indicates the start of a new bullish trend. The RSI is currently above its 50 level and rising. The blue dotted arrows represent a measured move using the peak and trough of the triangle pattern. Price will likely advance towards the $17.25 level, surpass it and grind upwards to retest the most recent high at $19.25. If price cannot hold above the upper trend line, then it will probably fall back to the $14.00 support. Price could bounce off the $14.00 level and continue upwards, however if price breaks below $14.00, it could possibly drop back to $12.00.
Source: GAIN Capital, TradingView
Latest market news




Open an account in minutes
Experience award-winning platforms with fast and secure execution, and enjoy tight spreads from 0.5 pts on FX and 0.3 pts on indices.
Economic calendar
Web Trader platform
Our sophisticated web-based platform is packed with features.
Related articles
Crude Oil Analysis: Geopolitical Risk Continues to Drive the WTI Barrel Higher
During recent trading sessions, a new wave of buying momentum has continued to gain relevance around WTI crude oil price action. Over the last three trading sessions, the market has maintained a bullish streak and is now up more than 5.5%, highlighting significant buying pressure in the short term.


Crude Oil Forecast WTI Prices Come Under Pressure as Middle East Risks Ease
Over the last two trading sessions, WTI crude oil has once again displayed a notable bearish bias, with prices falling nearly 6%. Part of this renewed selling pressure has been driven by recent developments in the Middle East, which have helped temporarily ease the geopolitical tensions that had supported the oil risk premium in previous weeks.

S&P 500, Nasdaq, Dow Forecast: Rising Yields Test Rally Ahead of Nvidia, Fed 8 22 2026
S&P 500, Nasdaq and Dow test key technical levels as momentum fades, raising the risk of a deeper correction heading into a pivotal week.

This report is intended for general circulation only. It should not be construed as a recommendation, or an offer (or solicitation of an offer) to buy or sell any financial products. The information provided does not take into account your specific investment objectives, financial situation or particular needs. Before you act on any recommendation that may be contained in this report, independent advice ought to be sought from a financial adviser regarding the suitability of the investment product, taking into account your specific investment objectives, financial situation or particular needs.
StoneX Financial Pte. Ltd., may distribute reports produced by its respective foreign entities or affiliates within the StoneX group of companies or third parties pursuant to an arrangement under Regulation 32C of the Financial Advisers Regulations. Where the report is distributed to a person in Singapore who is not an accredited investor, expert investor or an institutional investor (as defined in the Securities Futures Act), StoneX Financial Pte. Ltd. accepts legal responsibility to such persons for the contents of the report only to the extent required by law. Singapore recipients should contact StoneX Financial Pte. Ltd. at 6826 9988 for matters arising from, or in connection with the report.
In the case of all other recipients of this report, to the extent permitted by applicable laws and regulations neither StoneX Financial Pte. Ltd. nor its associated companies will be responsible or liable for any loss or damage incurred arising out of, or in connection with, any use of the information contained in this report and all such liability is hereby expressly disclaimed. No representation or warranty is made, express or implied, that the content of this report is complete or accurate.
StoneX Financial Pte. Ltd. is not under any obligation to update this report.
Trading CFDs carries a high level of risk that may not be suitable for some investors. Consider your investment objectives, level of experience, financial resources, risk appetite and other relevant circumstances carefully. The possibility exists that you could lose some or all of your investments, including your initial deposits. If in doubt, please seek independent expert advice. Visit www.forex.com/en-sg/terms-and-policies for the complete Risk Disclosure Statement.