



Crude Oil Forecast: WTI Prices Come Under Pressure as Middle East Risks Ease
Over the last two trading sessions, WTI crude oil has once again displayed a notable bearish bias, with prices falling nearly 6%. Part of this renewed selling pressure has been driven by recent developments in the Middle East, which have helped temporarily ease the geopolitical tensions that had supported the oil risk premium in previous weeks.
Share this:

Over the last two trading sessions, WTI crude oil has once again displayed a notable bearish bias, with prices falling nearly 6%. Part of this renewed selling pressure has been driven by recent developments in the Middle East, which have helped temporarily ease the geopolitical tensions that had supported the oil risk premium in previous weeks. If this environment of relative calm persists, selling pressure could continue to play a more prominent role in WTI price action over the coming trading sessions.

What Is Happening in the Middle East?
This trading week has been particularly important for monitoring developments between Iran and the United States. At the beginning of the week, markets showed some concern after the United States announced a new sanctions package targeting nearly 60 entities linked to Iran. However, rather than being interpreted as a potential military escalation, the measure was largely viewed as a form of economic pressure, preventing a significant increase in the geopolitical risk premium in the short term.
Later today, additional developments emerged regarding the situation. Pakistan reported meaningful progress in high-level diplomatic discussions held over recent days, highlighting broader international efforts to reduce tensions. In addition, reports indicated that Iran has begun direct negotiations regarding the management of the Strait of Hormuz, including discussions about a potential temporary shipping corridor.
Taken together, these developments have helped improve market sentiment, as they point to both diplomatic progress and active discussions surrounding one of the most sensitive routes for global energy trade. As a result, geopolitical uncertainty appears to have entered a temporary pause in the short term.
This relative calm is also reflected in the behavior of the OVX, the volatility index for crude oil futures, which currently remains slightly below the 50-point level. This suggests that market participants are not expecting a significant increase in volatility over the next 30 days and points to expectations for more moderate price movements compared with previous weeks.
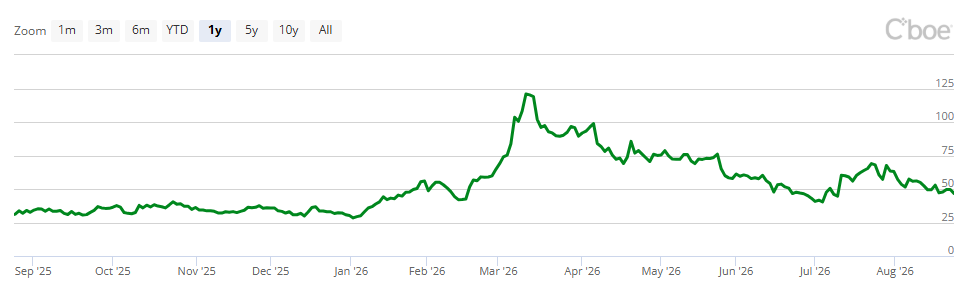
Source: CBOE
Against this backdrop, recent developments in the Middle East may be reducing part of the uncertainty that had dominated energy markets. Optimism surrounding negotiations and progress related to the Strait of Hormuz could lower the risk premium associated with global crude supply, reducing the need for precautionary demand in the oil market. If this perception of relative calm continues to prevail, selling pressure could remain an important factor driving WTI price action in the coming sessions.
How Is Market Sentiment Evolving?
Another important factor to monitor is the behavior of the MM User Sentiment Indicator for the oil market. Currently, the indicator reflects 11.76% bullish sentiment and 11.76% bearish sentiment, while approximately 76.47% of participants maintain a neutral outlook toward crude oil in the short term.
This reading highlights a relatively cautious market that, for now, is avoiding aggressive directional views while recent geopolitical developments continue to unfold.
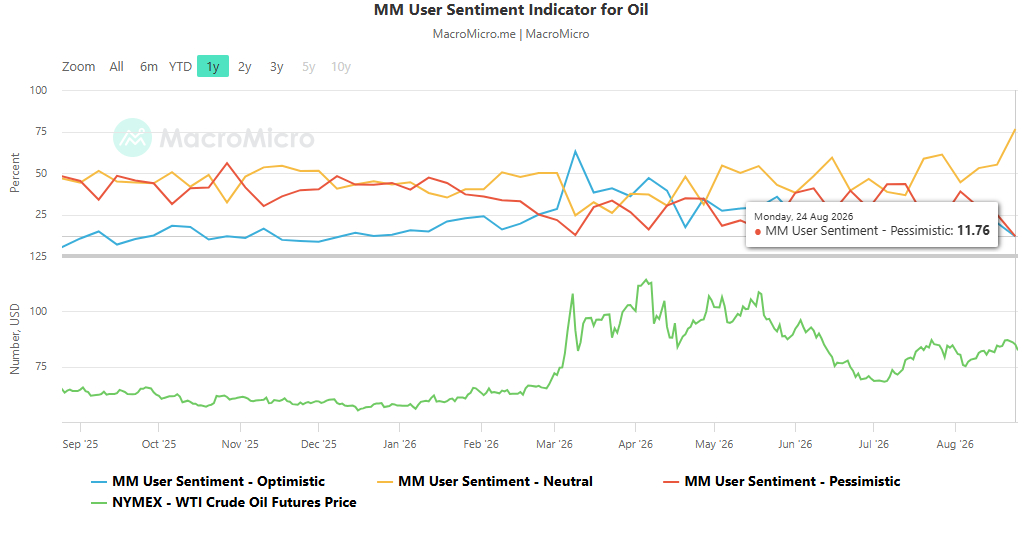
Source: MacroMicro
This dynamic is relevant for WTI because, as long as this neutral stance remains dominant, it may be difficult for the market to build enough conviction to sustain a meaningful directional move. If the indicator continues to reflect a predominantly cautious approach among investors, a broader period of indecision could become increasingly important within oil price action over the coming trading sessions.
WTI Technical Outlook
Source: StoneX, Tradingview
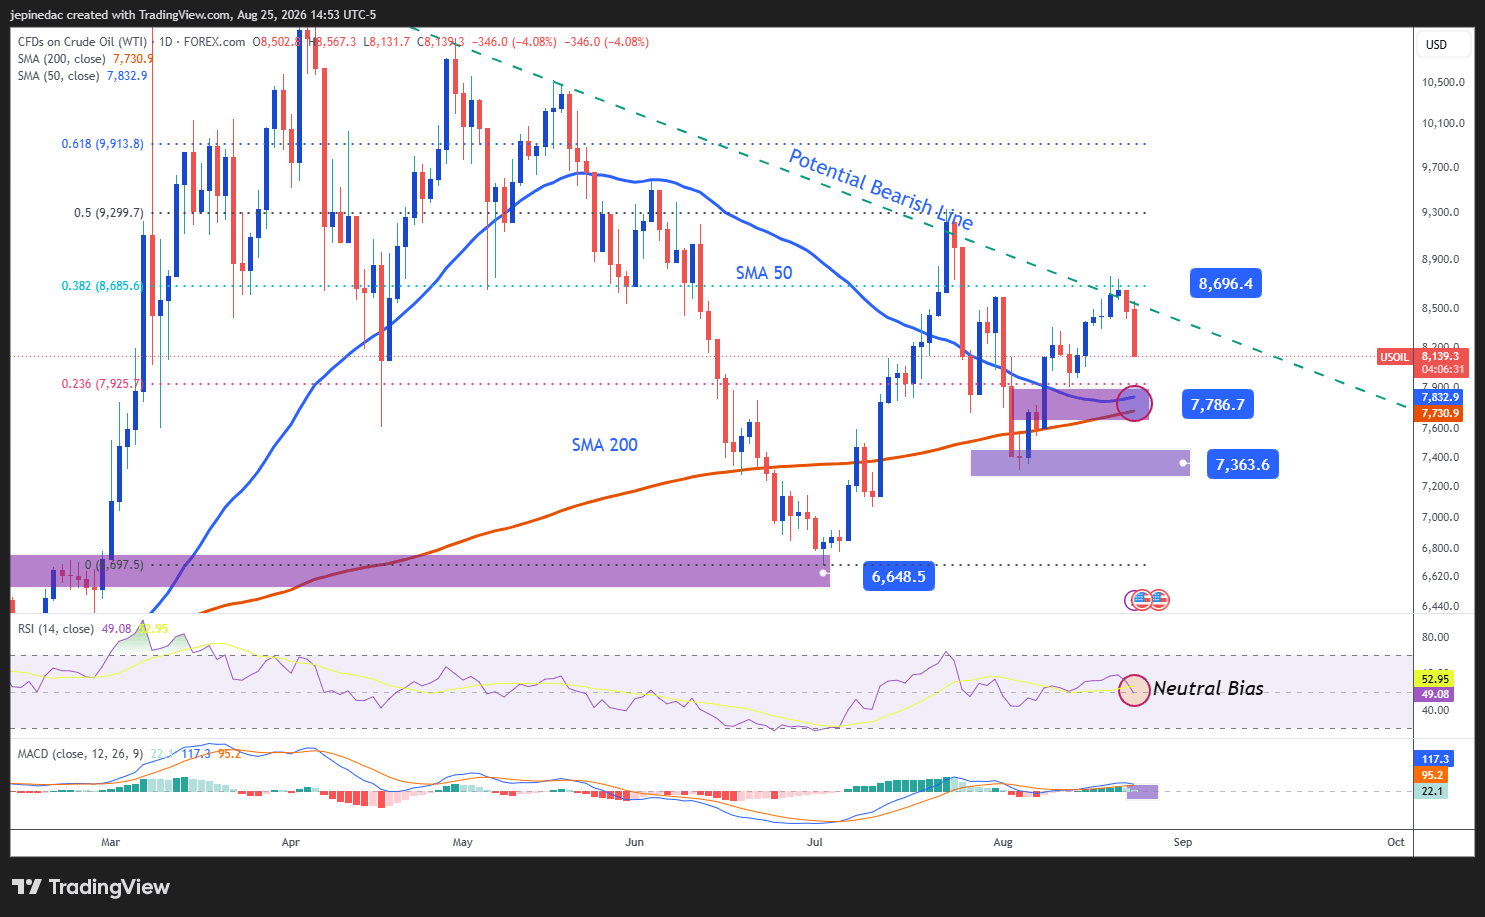
- Bearish Trendline Continues to Hold: Since the first days of May, WTI price action has been forming a new medium-term bearish trendline. Given the lack of significant recoveries in oil prices, this structure remains the most important technical reference on the chart. If selling pressure continues to dominate in upcoming sessions, the bearish trendline could remain the primary pattern guiding price movements over the coming weeks.
- RSI: The indicator remains very close to the neutral 50 level, suggesting that the balance between buying and selling momentum over the past 14 sessions remains relatively even. This reading may be signaling a growing period of indecision within the market.
- MACD: A similar dynamic can be observed in the MACD, whose histogram continues to fluctuate near the neutral 0 level. This behavior reflects balance in the average strength of short-term moving averages and reinforces the possibility of a less directional trading environment.
Key Levels to Watch:
- $86 – Key Resistance: This area coincides with important retracement levels from previous weeks and with the 38.2% Fibonacci retracement of the most relevant move on the chart. A renewed move toward this level could begin to challenge the dominant bearish trendline and create room for a more sustained recovery over the medium term.
- $77 – Nearby Barrier: This level aligns with both the 200-period and 50-period Simple Moving Averages, making it one of the most important equilibrium zones on the chart. As long as prices remain close to this region, market neutrality could remain dominant and potentially support the development of a short-term trading range.
- $73 – Key Support: This level corresponds to recent lows and remains the most important downside barrier to monitor. Price action that establishes itself below this area could reinforce a dominant bearish bias, favor the emergence of new lows, and allow for a further extension of the prevailing downtrend in the weeks ahead.
Written by Julian Pineda, CFA, CMT – Market Analyst
Follow him on: @julianpineda25




Open an account in minutes
Experience award-winning platforms with fast and secure execution, and enjoy tight spreads from 0.5 pts on FX and 0.3 pts on indices.
Economic calendar
Web Trader platform
Our sophisticated web-based platform is packed with features.
Related articles

S&P 500 Forecast: SPX rises after cooler-than-expected inflation data
U.S. stocks are rising and Treasury yields are falling after data showed that inflation increased at a cooler pace than expected, while U.S. consumer spending rose again in August.

EUR/USD forecast: Eurozone stagflation risks mount as dollar holds firm ahead of data
The dollar was bouncing back at the time of writing, after it had eased overnight on the back of some weaker-than-expected economic data yesterday which had prompted markets to scale back expectations of an October Fed rate hike. However, with more significant US data due today and Friday, and with oil prices continuing to remain elevated, the dollar’s broader direction remains bullish.


Treasury Yields Lose Momentum as Energy ETF Retreats
The 10-year Treasury yield is testing a resistance zone respected since the 1920s, as bearish RSI divergence signals fading upside momentum.

This report is intended for general circulation only. It should not be construed as a recommendation, or an offer (or solicitation of an offer) to buy or sell any financial products. The information provided does not take into account your specific investment objectives, financial situation or particular needs. Before you act on any recommendation that may be contained in this report, independent advice ought to be sought from a financial adviser regarding the suitability of the investment product, taking into account your specific investment objectives, financial situation or particular needs.
StoneX Financial Pte. Ltd., may distribute reports produced by its respective foreign entities or affiliates within the StoneX group of companies or third parties pursuant to an arrangement under Regulation 32C of the Financial Advisers Regulations. Where the report is distributed to a person in Singapore who is not an accredited investor, expert investor or an institutional investor (as defined in the Securities Futures Act), StoneX Financial Pte. Ltd. accepts legal responsibility to such persons for the contents of the report only to the extent required by law. Singapore recipients should contact StoneX Financial Pte. Ltd. at 6826 9988 for matters arising from, or in connection with the report.
In the case of all other recipients of this report, to the extent permitted by applicable laws and regulations neither StoneX Financial Pte. Ltd. nor its associated companies will be responsible or liable for any loss or damage incurred arising out of, or in connection with, any use of the information contained in this report and all such liability is hereby expressly disclaimed. No representation or warranty is made, express or implied, that the content of this report is complete or accurate.
StoneX Financial Pte. Ltd. is not under any obligation to update this report.
Trading CFDs carries a high level of risk that may not be suitable for some investors. Consider your investment objectives, level of experience, financial resources, risk appetite and other relevant circumstances carefully. The possibility exists that you could lose some or all of your investments, including your initial deposits. If in doubt, please seek independent expert advice. Visit www.forex.com/en-sg/terms-and-policies for the complete Risk Disclosure Statement.