



Crude Oil Weekly Outlook: Elections Test Brent–WTI Resistance Levels
Crude Oil Weekly Outlook: Brent–WTI spread tests long-term resistance as monthly RSI reaches overbought territory and key elections approach. Brent and WTI levels and risks ahead.
Share this:

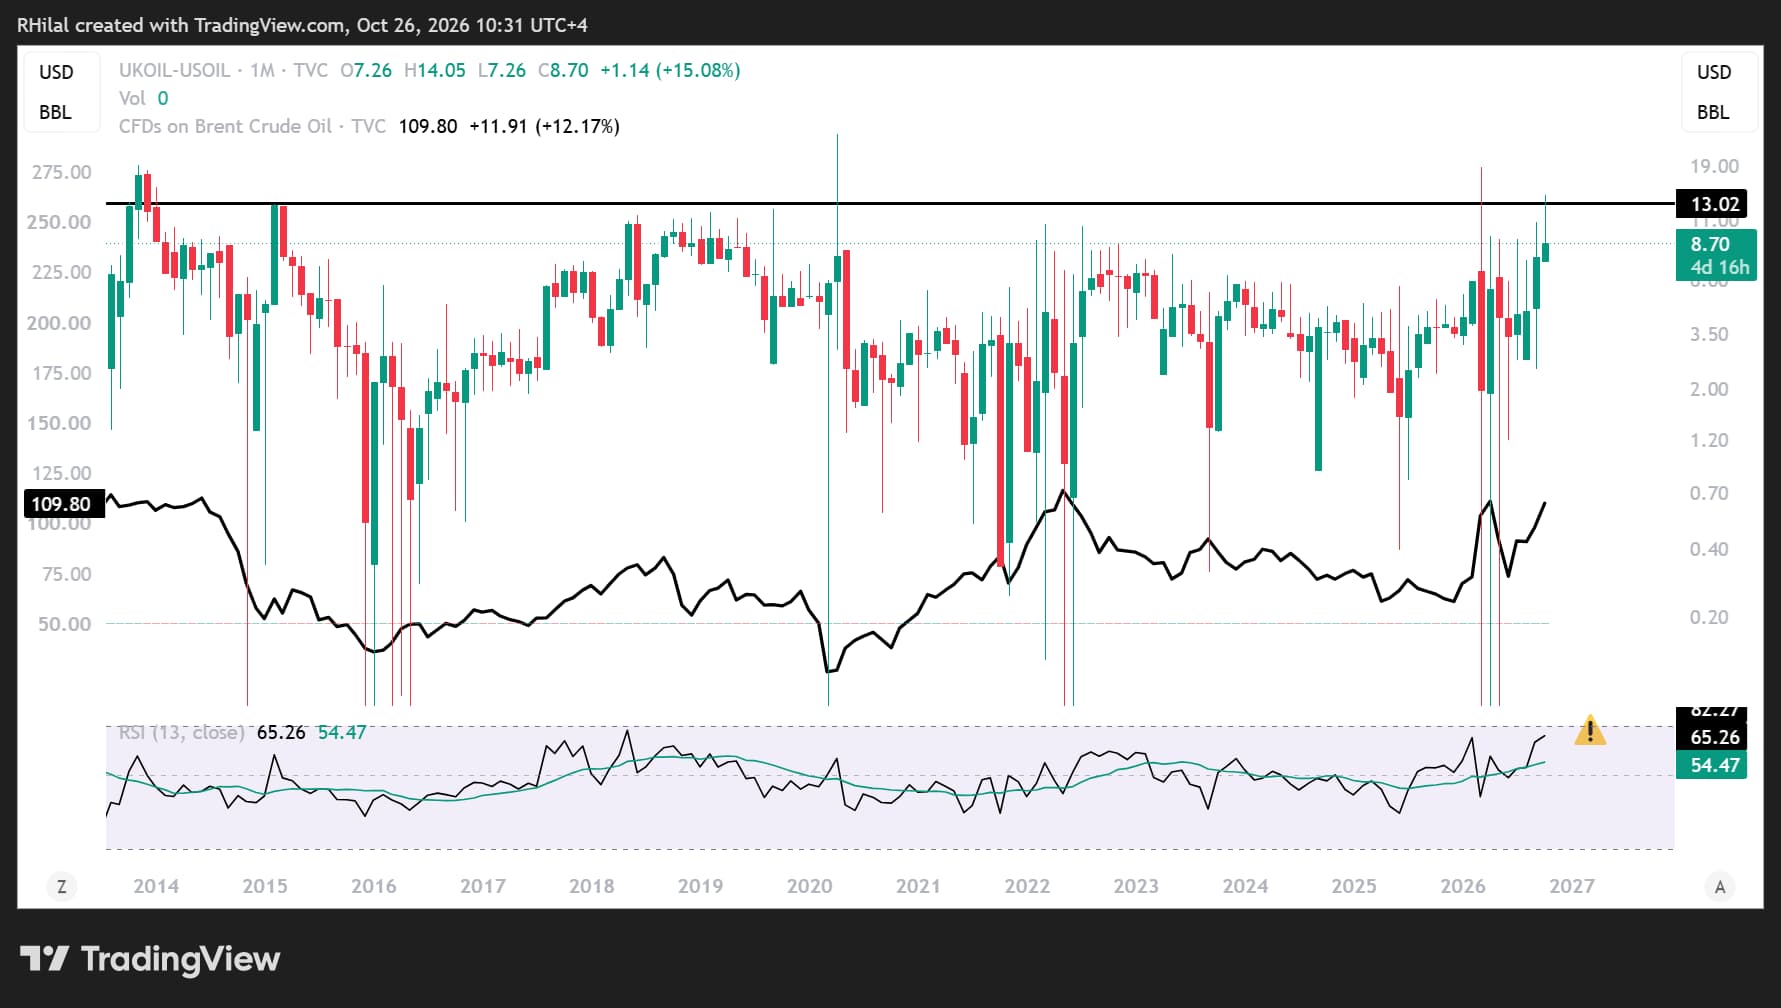
The Brent–WTI spread is slowing near an 11-year resistance zone at $13.50, while monthly RSI has reached overbought territory last seen in 2011. Is the spread nearing a turning point, or could renewed geopolitical tensions drive another leg higher?
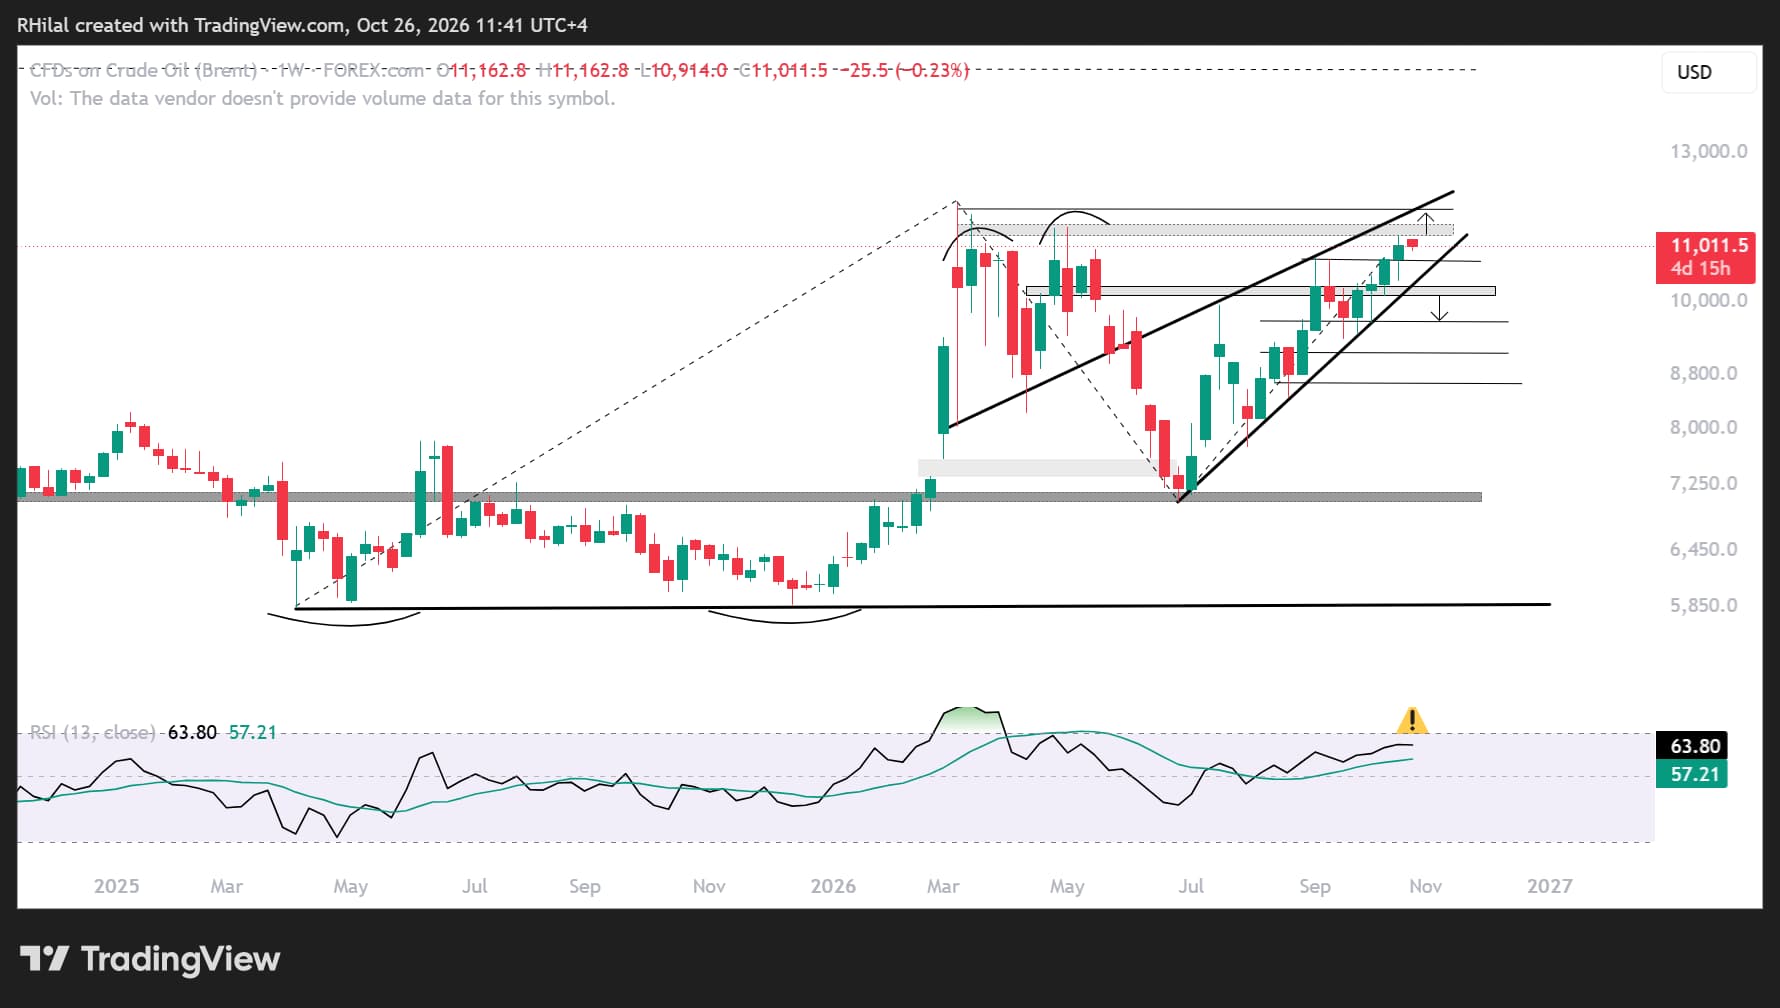
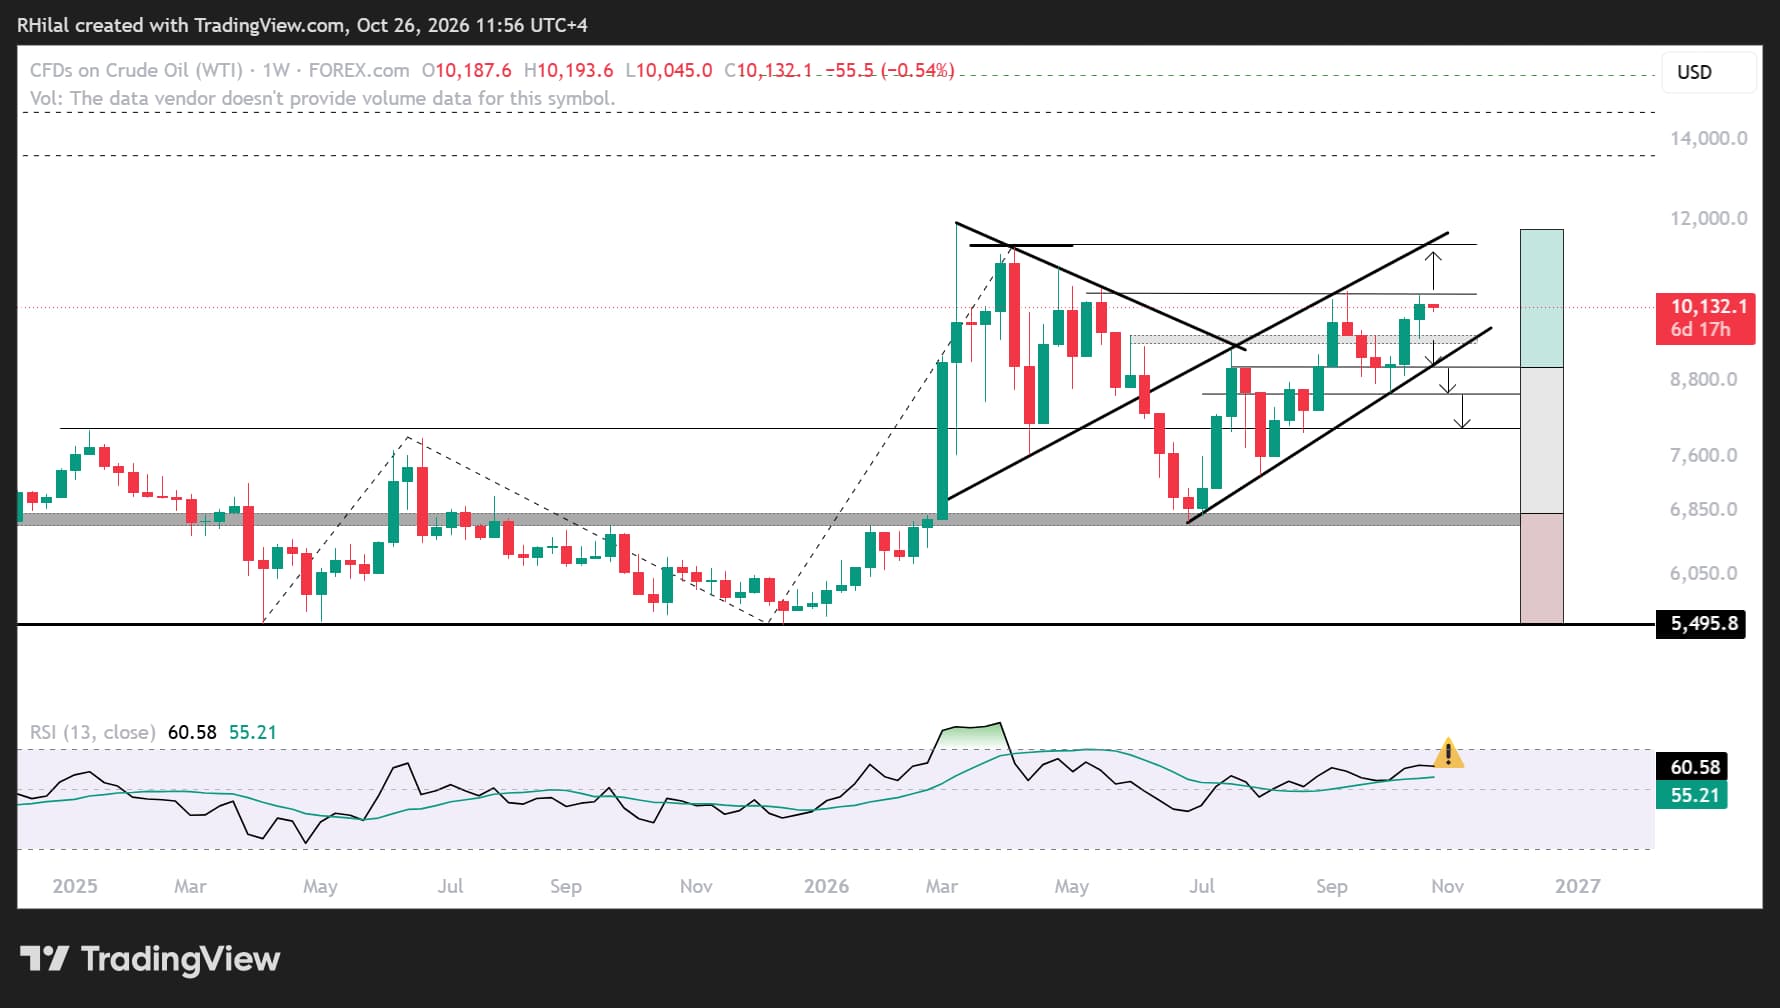
Brent is facing its 2026 highs above $110, while WTI is testing Septmber highs near $105 and is approaching a resistance zone that dates back to 2011 and its own yearly highs. These levels set up two possible scenarios: a reversal from resistance or a sustained breakout that extends the longer-term bullish trend. Geopolitical developments around the Israeli election on October 27 and the U.S. midterm elections on November 3 could influence the outlook in the coming weeks and months.
I cover these charts in my weekly webinar, held every Tuesday.
This content was created by an affiliate of FOREX.com and represents the views and opinions of the author/speakers, not the views and opinions of Forex.com, StoneX Group Inc., or its subsidiaries. The content has not been independently reviewed by Forex.com.
This week brings several potential volatility catalysts: the Federal Reserve’s decision on Wednesday, October 28; the European Central Bank’s decision on Thursday, October 29; and the Bank of Japan’s decision on Friday, October 30. Mega-cap earnings and geopolitical developments—including Houthi activity, Strait of Hormuz risks, and attacks on oil tankers—are also in focus. Israel’s election is scheduled for October 27, with U.S. midterm elections on November 3.
With oil prices near the upper end of this year’s range, softer demand expectations may temper the rally. At the same time, the risk of supply disruptions remains central to the crude oil outlook, with potential consequences for inflation, central bank policy and corporate earnings.
Brent–WTI Spread: Monthly Time Frame – Log Scale
Source: TradingView
Pullback risks are on my radar as the Brent–WTI spread tests an 11-year resistance zone near $13.50, a level that has capped the spread since 2015. Monthly RSI is also testing overbought territory last seen in 2011.
Extreme fear in market sentiment, together with the approaching elections and their connection to the Middle East conflict, may contribute to a turning point. Stretched bond yields and elevated momentum readings across markets add to the risk of a reversal.
Brent Outlook: Weekly Time Frame – Log Scale
Source: TradingView
On the weekly chart, Brent is facing a technical confluence zone between $110 and $118, where a pullback could emerge. The zone aligns with a trendline respected since March 2026 and the 78.6% extension of the April 2025–March 2026–July 2026 price cycle.
On the downside, I’m watching the rising support connecting higher lows since July 2026, with key levels near $108 and $101. A break below these levels would strengthen the bearish reversal case.
WTI Crude Oil Outlook: Weekly Time Frame – Log Scale
Source: TradingView
On the weekly WTI chart, price is holding below the September high and the $105 resistance level. This level aligns with the 61.8% extension of the April 2025–March 2026–July 2026 price cycle.
A breakout above $105 would bring the yearly highs and the trendline respected since March 2026 into focus, with potential resistance near $114. A sustained break higher would increase the risk of longer-term bullish continuation.
On the downside, I’m watching rising support connecting higher lows since July 2026, near $93.30 and $89. A break below these levels could expose $85 and then $81.
Despite the many catalysts this week, geopolitical developments, supply disruptions and the approaching elections are likely to remain key drivers of crude oil and market volatility and direction.
Written by Razan Hilal, CMT
Follow on X: @Rh_waves

Open an account in minutes
Experience award-winning platforms with fast and secure execution, and enjoy tight spreads from 0.5 pts on FX and 0.3 pts on indices.
Economic calendar
Web Trader platform
Our sophisticated web-based platform is packed with features.
Related articles

Crude Oil Weekly Outlook: Elections Test Brent–WTI Resistance Levels
Crude Oil Weekly Outlook: Brent–WTI spread tests long-term resistance as monthly RSI reaches overbought territory and key elections approach. Brent and WTI levels and risks ahead.

Brent Crude Oil and Forex Technical Analysis | Oil Gaps Lower
Brent crude oil gaps sharply lower after an extended rally, while several forex pairs approach key technical levels. We examine the latest setups across oil, EUR/USD, USD/JPY and other major currency pairs.


USD/CAD reversal risk builds as central bank showdown looms
USD/CAD has delivered a bullish reversal signal from established support, just as traders prepare for Fed and BoC decisions. Aggressive Canadian rate hike expectations and conflicting momentum signals make the coming session important.

This report is intended for general circulation only. It should not be construed as a recommendation, or an offer (or solicitation of an offer) to buy or sell any financial products. The information provided does not take into account your specific investment objectives, financial situation or particular needs. Before you act on any recommendation that may be contained in this report, independent advice ought to be sought from a financial adviser regarding the suitability of the investment product, taking into account your specific investment objectives, financial situation or particular needs.
StoneX Financial Pte. Ltd., may distribute reports produced by its respective foreign entities or affiliates within the StoneX group of companies or third parties pursuant to an arrangement under Regulation 32C of the Financial Advisers Regulations. Where the report is distributed to a person in Singapore who is not an accredited investor, expert investor or an institutional investor (as defined in the Securities Futures Act), StoneX Financial Pte. Ltd. accepts legal responsibility to such persons for the contents of the report only to the extent required by law. Singapore recipients should contact StoneX Financial Pte. Ltd. at 6826 9988 for matters arising from, or in connection with the report.
In the case of all other recipients of this report, to the extent permitted by applicable laws and regulations neither StoneX Financial Pte. Ltd. nor its associated companies will be responsible or liable for any loss or damage incurred arising out of, or in connection with, any use of the information contained in this report and all such liability is hereby expressly disclaimed. No representation or warranty is made, express or implied, that the content of this report is complete or accurate.
StoneX Financial Pte. Ltd. is not under any obligation to update this report.
Trading CFDs carries a high level of risk that may not be suitable for some investors. Consider your investment objectives, level of experience, financial resources, risk appetite and other relevant circumstances carefully. The possibility exists that you could lose some or all of your investments, including your initial deposits. If in doubt, please seek independent expert advice. Visit www.forex.com/en-sg/terms-and-policies for the complete Risk Disclosure Statement.