



Crude Oil Analysis: Geopolitical Risk Continues to Drive the WTI Barrel Higher
During recent trading sessions, a new wave of buying momentum has continued to gain relevance around WTI crude oil price action. Over the last three trading sessions, the market has maintained a bullish streak and is now up more than 5.5%, highlighting significant buying pressure in the short term.
Share this:

During recent trading sessions, a new wave of buying momentum has continued to gain relevance around WTI crude oil price action. Over the last three trading sessions, the market has maintained a bullish streak and is now up more than 5.5%, highlighting significant buying pressure in the short term.
For now, this dynamic has remained in place as tensions continue to escalate around the conflict in the Middle East, a situation that keeps increasing the geopolitical risk premium across the region. As long as new developments continue pointing toward a prolonged escalation, the current buying pressure around the WTI barrel could remain relevant over the coming sessions.

How Is the Situation in the Middle East Evolving?
Over recent trading sessions, concerns about a further escalation in the Middle East have once again gained relevance after reports emerged of new attacks by the United States against Iranian tankers. This situation has renewed concerns about prolonged disruptions to oil flows in the short term.
In addition, Iran announced the establishment of an exclusion zone near the Strait of Hormuz, increasing risks for vessels attempting to navigate the area in the coming weeks. At the same time, there are still no meaningful diplomatic developments that would suggest a clear path toward a peaceful resolution of the conflict in the short term.
This series of developments has once again increased uncertainty around oil price movements, mainly because concerns over potential supply disruptions continue to remain present and could become more significant in the months ahead. As a result, this situation is also beginning to be reflected in the behavior of the OVX Index, which has advanced toward the 50-point area during the latest session. Since the indicator measures expected volatility over the next 30 days, its recent behavior suggests that uncertainty surrounding potentially aggressive market moves is increasing once again following the renewed tensions between Iran and the United States.
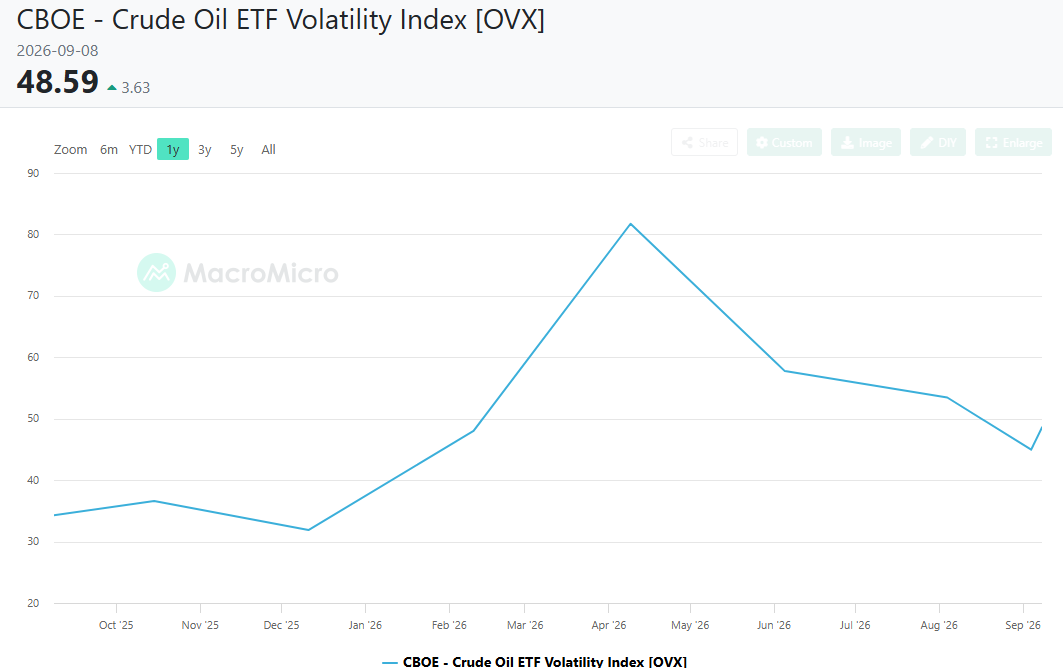
Source: MacroMicro – Data: CBOE
In addition, it is important to highlight that the resurgence of tensions has not only increased expectations of volatility around crude oil but has also boosted activity within the futures market. Current data shows a new high in trading volume not seen in several months. Data for September 8 registered more than 1.3 million contracts traded in a single session.
This development not only reflects increasing activity within the futures market, but also suggests that demand for crude oil is becoming more active as prices continue to advance. Part of this behavior may be linked to hedging strategies aimed at securing barrels in the present amid concerns that supply conditions could become more challenging in the future. Overall, market activity appears to be increasing as uncertainty surrounding the evolution of the conflict remains elevated.
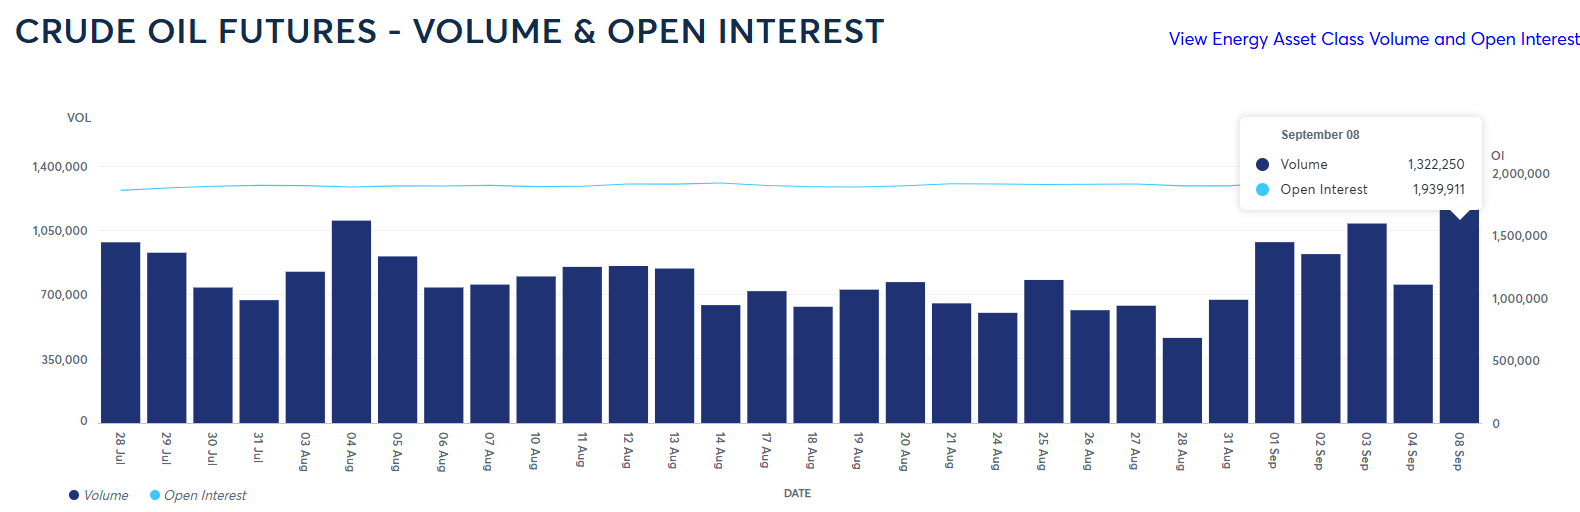
Source: CMEGROUP
Taking all of this into account, potential supply disruptions remain the most important fundamental catalyst for the oil market in the short term. If upcoming developments continue to point toward difficulties in reaching reliable negotiations in the Middle East and uncertainty surrounding a stable supply environment remains present, expectations for more aggressive moves in crude oil prices could continue to build. Under this scenario, buying pressure around WTI may remain relevant over the coming weeks.
WTI Technical Outlook
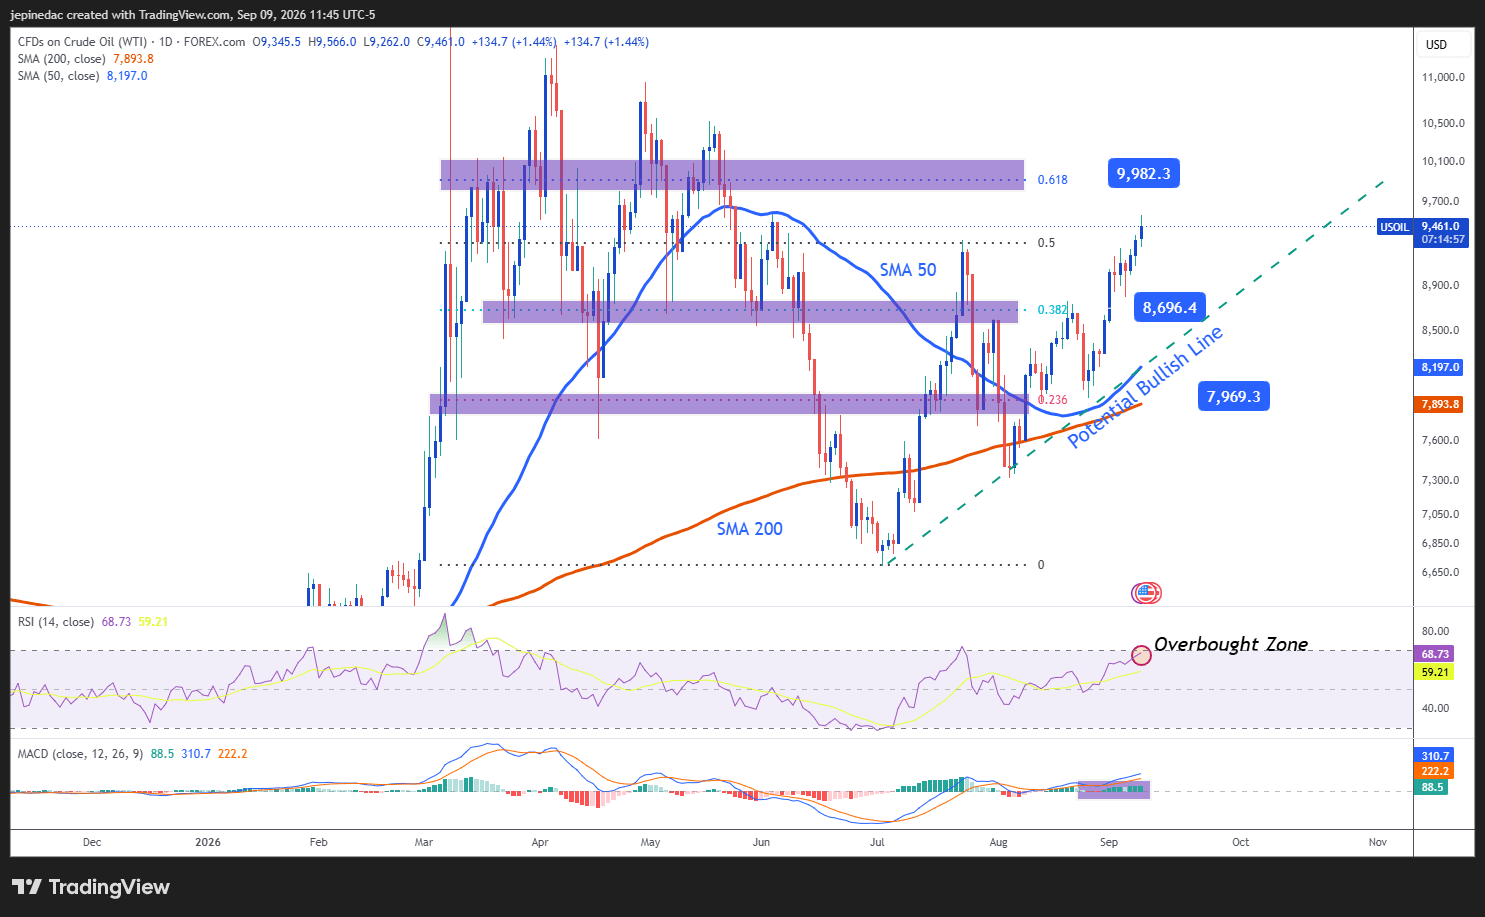
Source: StoneX, Tradingview
- A Potential Trendline Continues to Gain Relevance: Price action over recent weeks has gradually begun to shape a potential bullish trendline that is becoming increasingly important on the daily chart. The sequence of higher highs continues to highlight that the dominant market bias remains bullish. As long as buying pressure remains stable, this structure could continue strengthening and eventually become the most important technical pattern to monitor over the coming weeks.
- RSI: The RSI continues to develop above the neutral 50 level, a reading that reflects that buying momentum remains relevant in the short term. However, it is also important to note that the indicator is gradually approaching the overbought zone marked by the 70 level. This situation may be signaling a potential excess of recent buying pressure and could begin opening the door for corrective pullbacks during upcoming sessions.
- MACD: The MACD histogram continues to hold above the neutral 0 line, suggesting that the average strength of short-term moving averages remains supportive of a bullish bias. As long as this behavior persists, upside pressure could continue to play an important role in WTI price action.
Key Levels to Watch:
- $99 – Key Resistance: An important resistance area that coincides with previous highs and the 61.8% Fibonacci retracement of the most relevant move on the chart. Price action that manages to establish itself above this level could reinforce the emergence of a more dominant bullish bias and even create room for a more aggressive bullish trendline within the daily chart.
- $86 – Critical Barrier: This area corresponds to the 38.2% Fibonacci retracement level and stands as the nearest reference to monitor should corrective downside moves begin to develop in the short term.
- $80 – Key Support: A level where the 23.6% Fibonacci retracement, the 200-period Simple Moving Average, and the base of the potential bullish trendline all converge. This combination makes it one of the most important levels on the chart. Price action returning toward this area could put the developing medium-term bullish structure at risk and open the door to a broader phase of indecision over the coming weeks.
Written by Julian Pineda, CFA, CMT – Market Analyst
Follow him on: @julianpineda25
Latest market news



Open an account in minutes
Experience award-winning platforms with fast and secure execution, and enjoy tight spreads from 0.5 pts on FX and 0.3 pts on indices.
Economic calendar
Web Trader platform
Our sophisticated web-based platform is packed with features.
Related articles
Fed, DXY, EUR/USD, GBP/USD, USD/CAD, Gold Weekly Technical Outlook 10 26 2026
Sr. Technical Strategist Michael Boutros highlights the levels that matter on the USD Majors, commodities, and equity indices charts this week.

Nasdaq 100 Forecast: NDX rebounds as Anthropic files for IPO
U.S. stocks opened higher after last week's sell-off, which pushed the S&P 500 and the Nasdaq into their second straight weekly decline. Anthropic filed for its IPO, helping sentiment towards tech.


Crude Oil Weekly Outlook: Elections Test Brent–WTI Resistance Levels
Crude Oil Weekly Outlook: Brent–WTI spread tests long-term resistance as monthly RSI reaches overbought territory and key elections approach. Brent and WTI levels and risks ahead.

This report is intended for general circulation only. It should not be construed as a recommendation, or an offer (or solicitation of an offer) to buy or sell any financial products. The information provided does not take into account your specific investment objectives, financial situation or particular needs. Before you act on any recommendation that may be contained in this report, independent advice ought to be sought from a financial adviser regarding the suitability of the investment product, taking into account your specific investment objectives, financial situation or particular needs.
StoneX Financial Pte. Ltd., may distribute reports produced by its respective foreign entities or affiliates within the StoneX group of companies or third parties pursuant to an arrangement under Regulation 32C of the Financial Advisers Regulations. Where the report is distributed to a person in Singapore who is not an accredited investor, expert investor or an institutional investor (as defined in the Securities Futures Act), StoneX Financial Pte. Ltd. accepts legal responsibility to such persons for the contents of the report only to the extent required by law. Singapore recipients should contact StoneX Financial Pte. Ltd. at 6826 9988 for matters arising from, or in connection with the report.
In the case of all other recipients of this report, to the extent permitted by applicable laws and regulations neither StoneX Financial Pte. Ltd. nor its associated companies will be responsible or liable for any loss or damage incurred arising out of, or in connection with, any use of the information contained in this report and all such liability is hereby expressly disclaimed. No representation or warranty is made, express or implied, that the content of this report is complete or accurate.
StoneX Financial Pte. Ltd. is not under any obligation to update this report.
Trading CFDs carries a high level of risk that may not be suitable for some investors. Consider your investment objectives, level of experience, financial resources, risk appetite and other relevant circumstances carefully. The possibility exists that you could lose some or all of your investments, including your initial deposits. If in doubt, please seek independent expert advice. Visit www.forex.com/en-sg/terms-and-policies for the complete Risk Disclosure Statement.