






FTSE, China A50 analysis: Technical Tuesday - March 5, 2024
FTSE 100 attempts to join global rally, boosted by China's efforts to shore up its economy. China FTSE A50 analysis shows Chinese stocks are responding positively to needs China has set a 5% GDP target, which will needs policy support ‘from all fronts’
Share this:

- FTSE analysis: Technical levels and factors to watch
- China FTSE A50 analysis: Chinese stocks breaking higher
- China sets 5% GDP target, needs policy support ‘from all fronts’
After underperforming global indices for several months, China’s markets have been showing signs of life lately. If the gains are to be sustained, this could help provide support for the UK’s struggling FTSE 100, which, too, has been left behind the tech-fuelled global stock market rally this year.
China sets 5% GDP target
One of the key focal points this week revolved around the National People's Congress in China, which had the potential to not only influence Chinese markets, but also have an influence on global resource stocks and major miners, many of which are listed on the FTSE 100. Attention was on Beijing's stance regarding additional economic stimulus to spur growth. Furthermore, China's growth target would shed light on the extent of its commitment to pursuing economic recovery vigorously.
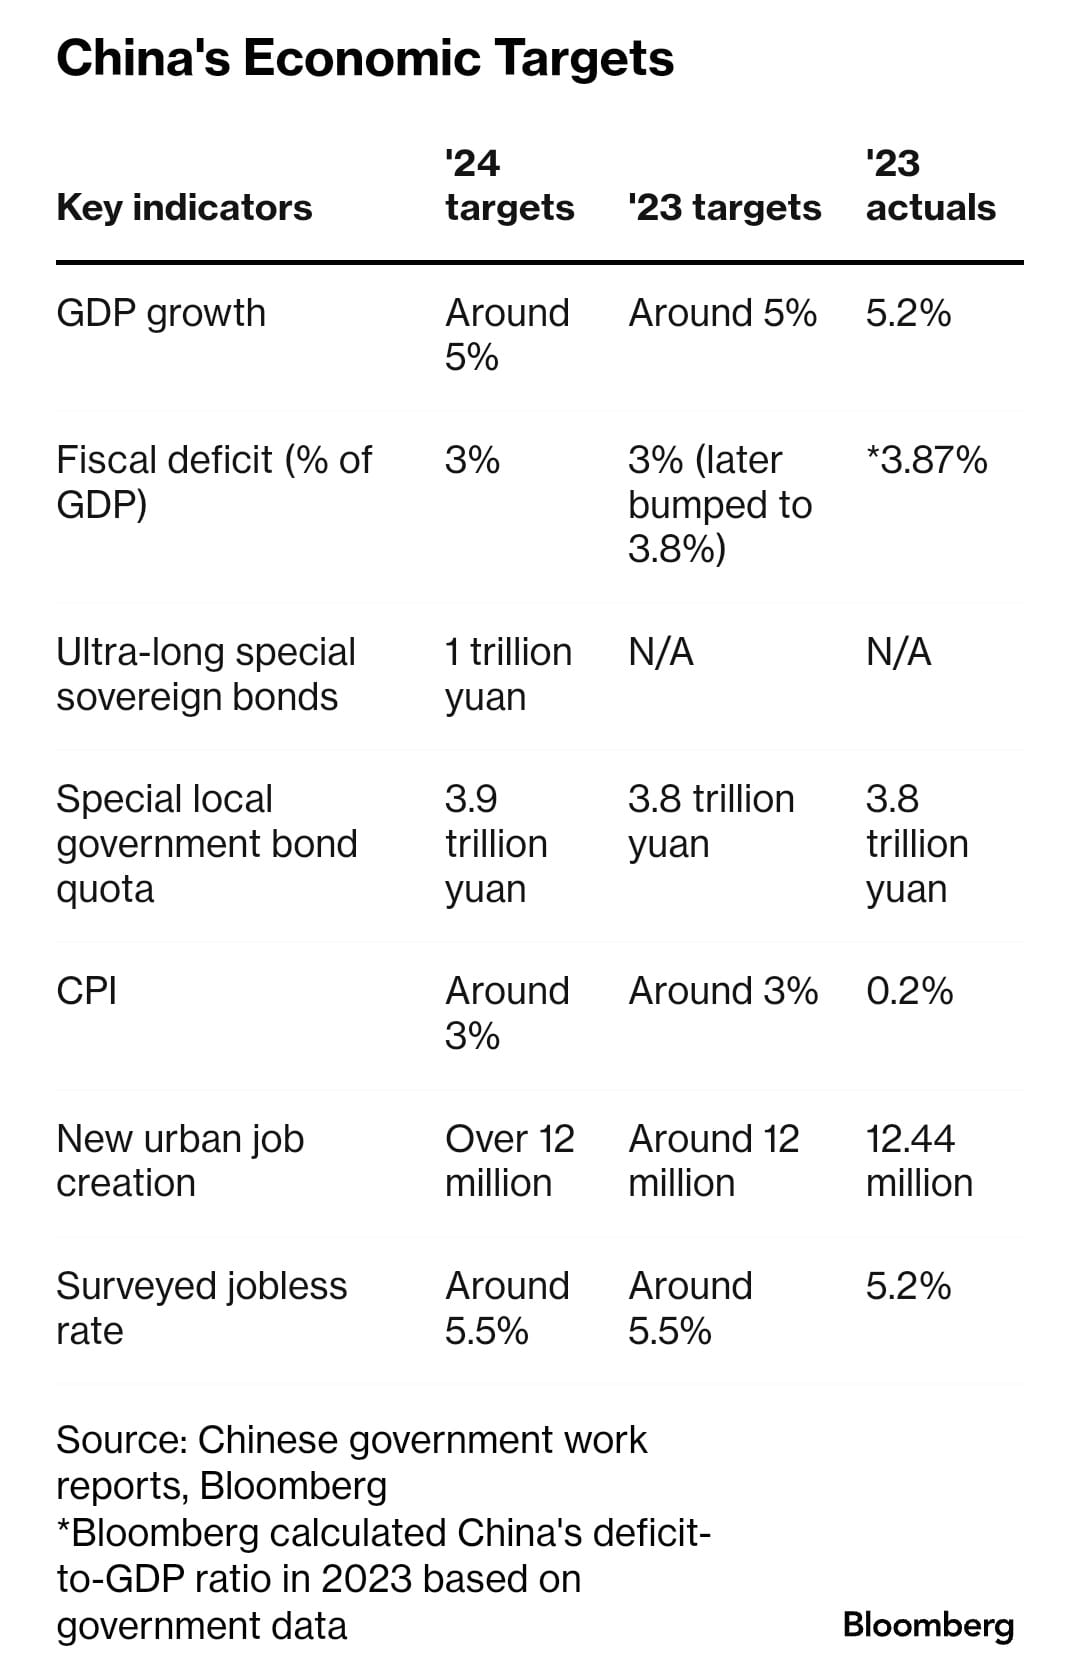
Well, as it turned out, China has set an ambitious annual growth target of approximately 5%, placing pressure on the country's top leaders to implement additional stimulus measures. This will attempt to bolster confidence in an economy hindered by a downturn in the property market and persistent deflationary pressures. China’s stocks rose overnight, and the FTSE 100 has bounced off its lows, suggesting that the market is pleased by China’s seriousness about economic growth.
As per Bloomberg, here’s a list of China’s economic targets:
One of the best ways to gauge Chinese investors’ risk appetite is to look at the chart of the local markets, which should give you clues about the direction of the likes of the FTSE 100 and base metals like copper, among other things.
China FTSE A50 analysis: Chinese stocks breaking higher
The A50 index has been creating higher lows ever since it bottomed at 10669 in January. Since then, it has reclaimed the lows of December 2023 and October 2022 at 10988 and 11161 respectively, pointing to a bullish false break reversal pattern. What’s more, it has broken above the bearish trend line that had been in place since July, and reclaimed the 21-day exponential moving average, which is now sloping positively. So, the short-term technical indications have all turned bullish.
The index is now testing another important area of resistance starting around 12075 to 12271, where the index had fallen from back in November. Here, the 200-day moving average also comes into play, making it a key technical area.
Therefore, a potential break above here would be significant. Given how global markets have rallied this year, and in light of China’s ambition plans to achieve a 5% growth, I reckon a bullish breakout is on the cards.
FTSE analysis: Technical levels and factors to watch
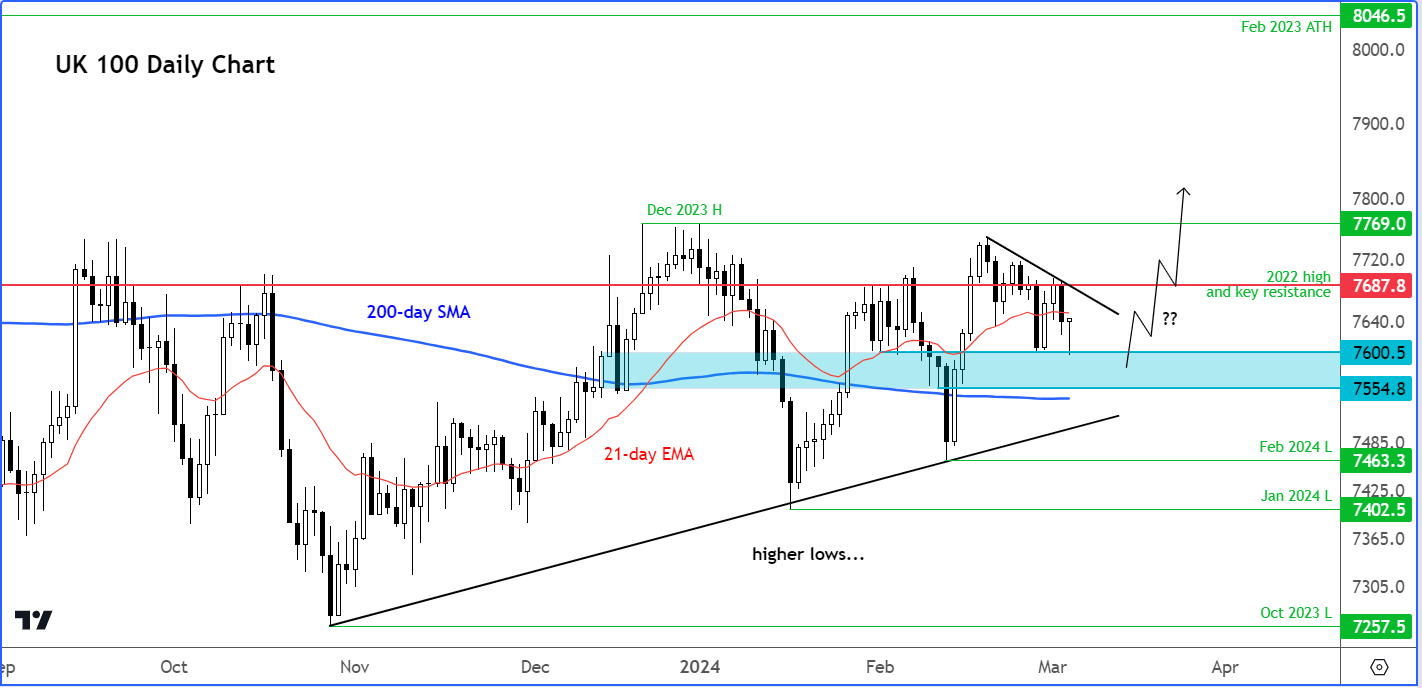
With China’s markets finally starting to rise, the resource-heavy FTSE 100 may finally join the global stock market rally, having left behind by its US and European peers in recent months. It has a lot of catching up to do. However, it will need to show a strong bullish signal that it is ready to take off. For several months now, it has failed to hold the breakout above the high of 2022 at 7687/8 area. Thus, another break above this area is needed first and foremost before we can be confident of a more sustainable breakout this time.
The underlying trend is bullish, though, given the higher lows the index has been printing for several months and the fact that it is trading above its 200-day moving average. Support in the 7550-7600 area needs to hold to keep the bulls happy in the short-term outlook.
Source for all charts used in this article: TradingView.com
-- Written by Fawad Razaqzada, Market Analyst
Follow Fawad on Twitter @Trader_F_R
How to trade with City Index
You can trade with City Index by following these four easy steps:
- Open an account, or log in if you’re already a customer
• Open an account in the UK
• Open an account in Australia
• Open an account in Singapore
- Search for the company you want to trade in our award-winning platform
- Choose your position and size, and your stop and limit levels
- Place the trade
Latest market news




Open an account in minutes
Experience award-winning platforms with fast and secure execution, and enjoy tight spreads from 0.5 pts on FX and 0.3 pts on indices.
Economic calendar
Web Trader platform
Our sophisticated web-based platform is packed with features.
Related articles
USD/JPY Weekly Outlook: Volatility Has Left the Building
The yen has ignored broad dollar weakness, falling Treasury yields and renewed market turbulence. Yet its relationship with US interest rates remains intact. So why is USD/JPY going absolutely nowhere fast?

Magnificent Seven Earnings Preview: Is the AI Boom Facing Its Biggest Test Yet?
After a wobble in the broader AI trade, the Magnificent Seven" stocks are reporting earnings in the coming week - see the key themes and Nasdaq 100 levels to watch!


Nasdaq 100 forecast: Tech stocks not out of woods yet
US index futures pushed higher in the first half of Friday’s session, taking cues from a strong performance from European equities. Both European and US equity futures extending yesterday’s impressive recovery after the sharp sell-off earlier in the week. But the lingering concerns around the AI investment cycle remain, while bond markets were easing lower again, lifting yields.
This report is intended for general circulation only. It should not be construed as a recommendation, or an offer (or solicitation of an offer) to buy or sell any financial products. The information provided does not take into account your specific investment objectives, financial situation or particular needs. Before you act on any recommendation that may be contained in this report, independent advice ought to be sought from a financial adviser regarding the suitability of the investment product, taking into account your specific investment objectives, financial situation or particular needs.
StoneX Financial Pte. Ltd., may distribute reports produced by its respective foreign entities or affiliates within the StoneX group of companies or third parties pursuant to an arrangement under Regulation 32C of the Financial Advisers Regulations. Where the report is distributed to a person in Singapore who is not an accredited investor, expert investor or an institutional investor (as defined in the Securities Futures Act), StoneX Financial Pte. Ltd. accepts legal responsibility to such persons for the contents of the report only to the extent required by law. Singapore recipients should contact StoneX Financial Pte. Ltd. at 6826 9988 for matters arising from, or in connection with the report.
In the case of all other recipients of this report, to the extent permitted by applicable laws and regulations neither StoneX Financial Pte. Ltd. nor its associated companies will be responsible or liable for any loss or damage incurred arising out of, or in connection with, any use of the information contained in this report and all such liability is hereby expressly disclaimed. No representation or warranty is made, express or implied, that the content of this report is complete or accurate.
StoneX Financial Pte. Ltd. is not under any obligation to update this report.
Trading CFDs carries a high level of risk that may not be suitable for some investors. Consider your investment objectives, level of experience, financial resources, risk appetite and other relevant circumstances carefully. The possibility exists that you could lose some or all of your investments, including your initial deposits. If in doubt, please seek independent expert advice. Visit www.forex.com/en-sg/terms-and-policies for the complete Risk Disclosure Statement.