






FTSE Looks For A Leg Up
With FTSE looking set to break higher, highlight three bullish stocks we’re closely watching
Share this:

The FTSE 100 has lagged its US and European counterparts this year, but that doesn’t mean it doesn’t try to play catch-up. We noted that US indices have respected key support levels along with USD/JPY, which paints a glimmer of hope we could be headed for a bout of risk-on. If so, it could provide the FTSE100 with a much-needed tailwind and help it break to a new cycle high.
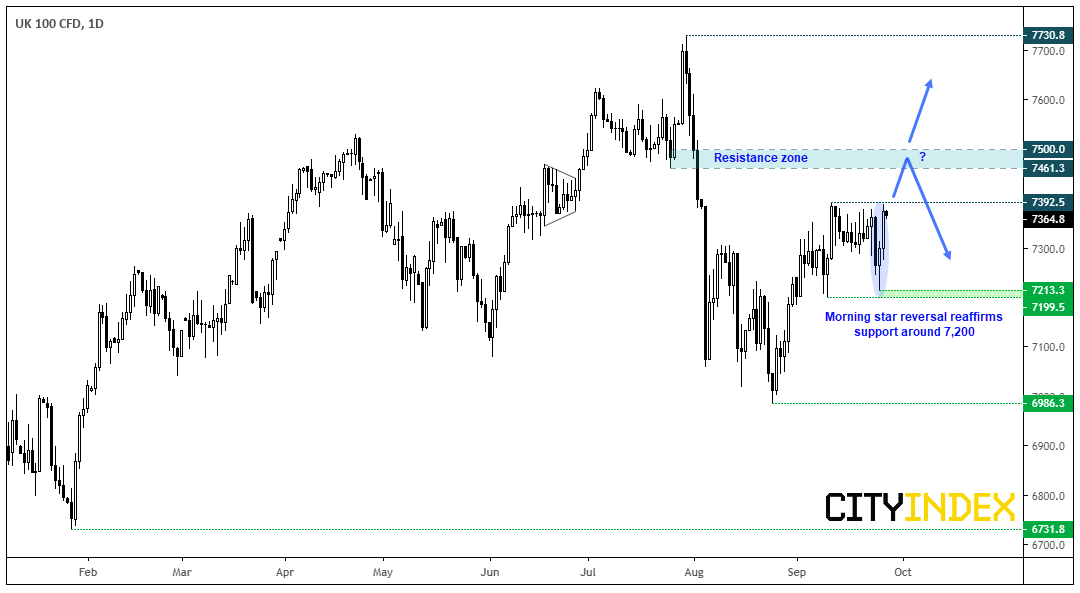
We can see on the daily chart that yesterday’s bullish candle closed just off the highs of a 3-week range. Moreover, Wednesday’s low reaffirmed support around 7,200 before heading higher and is part of a 3-bar bullish reversal pattern at support (the morning star reversal). From here’s we’re looking for a break above 7,392.50 to confirm a breakout, although we’re also mindful that interim resistance awaits around 7,461.30 so this should be taken into account for from a reward/risk perspective.
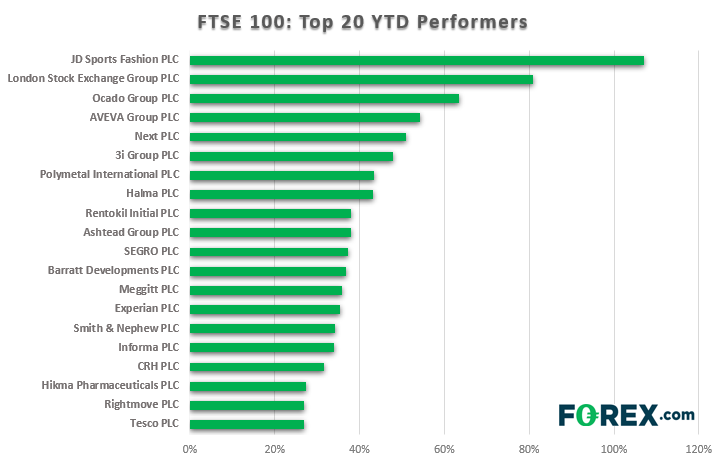
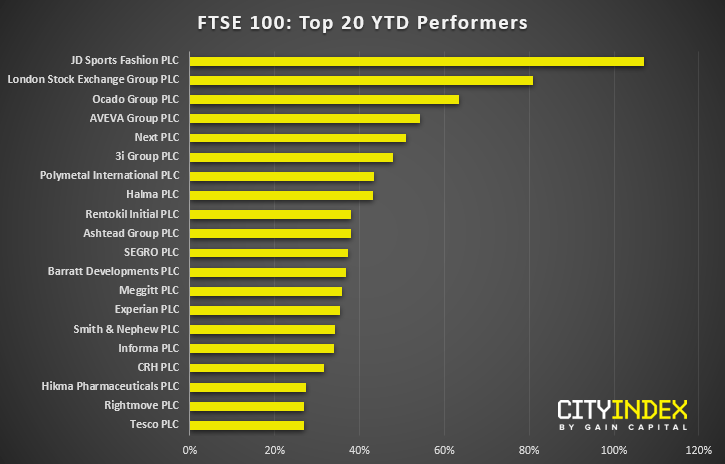
With that said, there’ll still be some stocks within the index which may sustain a better breakout, so we’ve listed the top 20 performers YTD (year to date) and selected three FTSE stocks worth following.
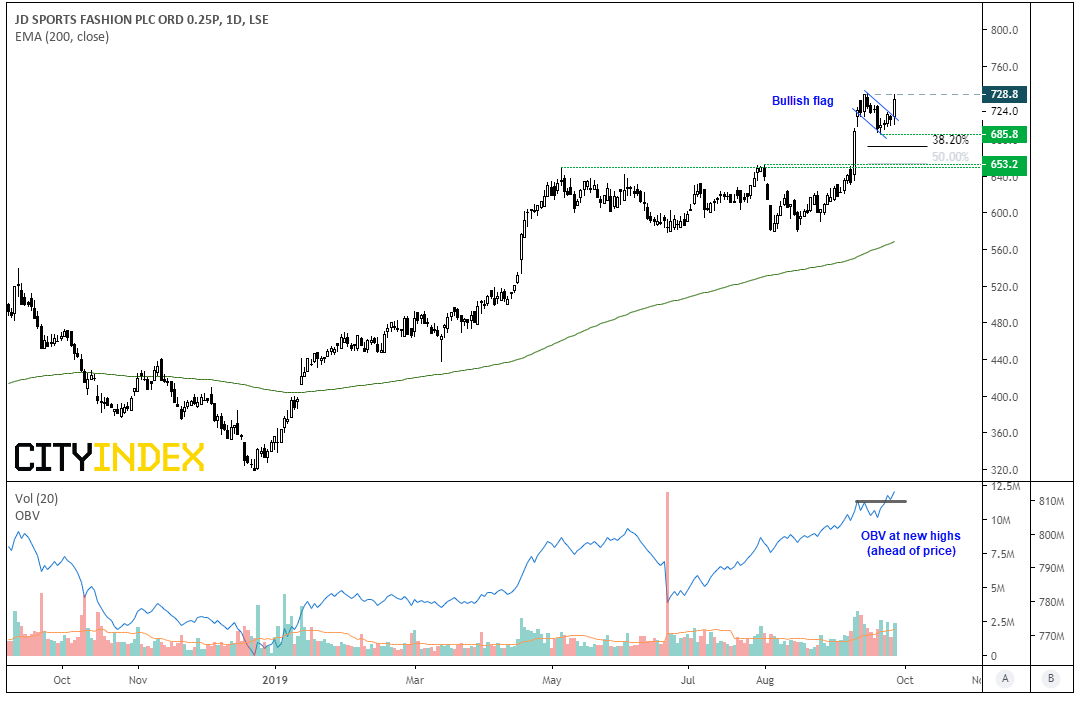
JD Sports (JD) sits just off record highs following yesterday’s range expansion day. That the pullback failed to even test the 38.2% retracement is a testament to the trend’s strength, and momentum has only increased since breaking out of its basing pattern on the 10th September. The retracement took form of a small bullish flag which is a continuation pattern in an uptrend. Furthermore, as daily volumes remain above average and OBV is at fresh highs ahead of price are encouraging signs for a bullish breakout.
- Bulls could take a break above 730 as a sign the trend is set to resume
- Bias remains bullish whilst prices hold above the 653.2 breakout level, which could allows traders to buy dips above support if prices fail to break/hold higher
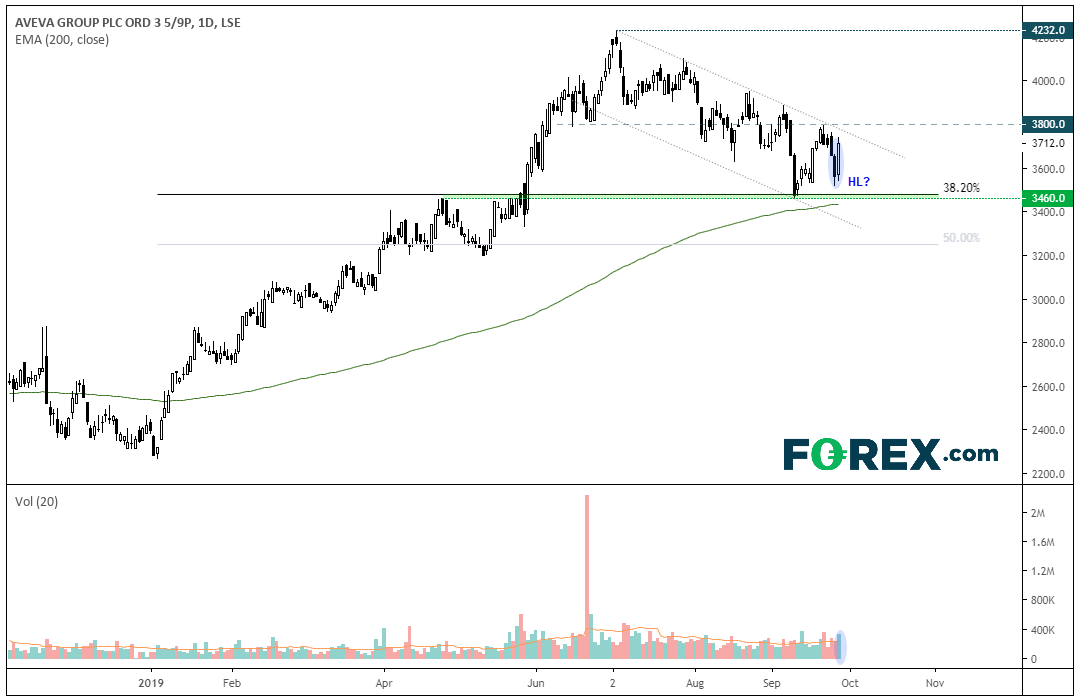
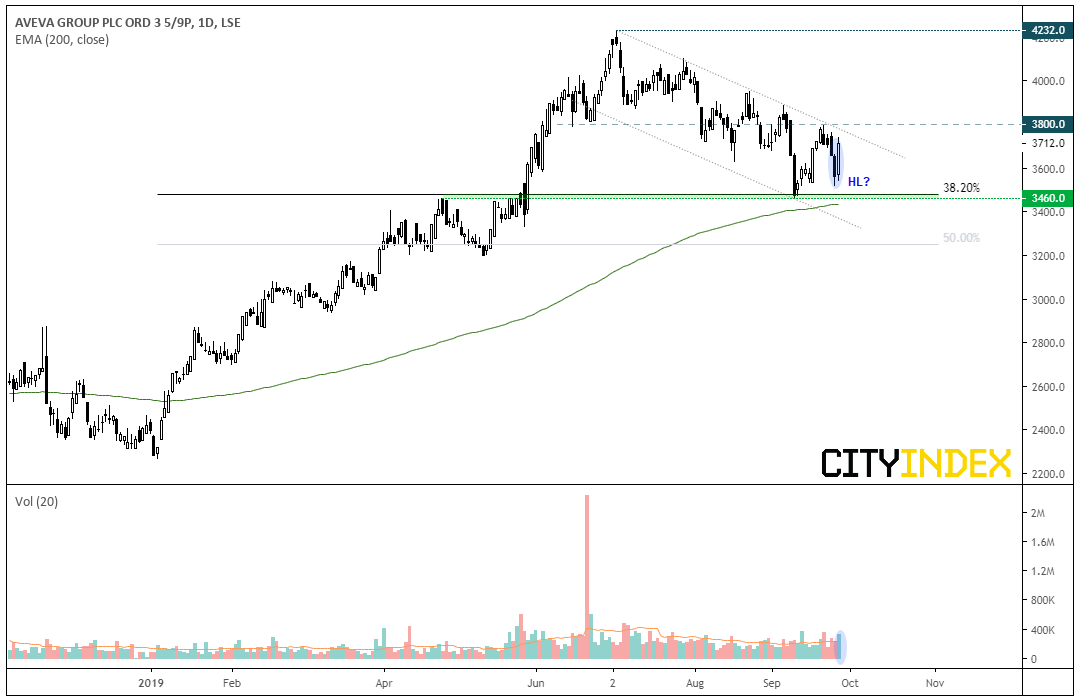
AVEVA Group (AVV) is currently trading within a bearish channel, although there are signs that it could be building up for a break higher to resume its longer-term bullish trend. The September low found support at the April high around 3460, which is near the 38.2% Fibonacci retracement level and above the 200-day eMA.
Yesterday’s 2-bar reversal marks a potential higher low, so a base could now be forming ahead of a bullish breakout. Volume was also above average yesterday which is an encouraging sign for a break higher.
- Bulls could use a break above 3,800 to signal a bullish breakout from the corrective channel. However, we’d prefer to see any breakout be accompanied on higher than average volume and / or OBV breaking a cycle high.
- Bears could seek short setups if the channel caps as resistance on lower timeframes. The 3460 lows become the next target, although a break beneath here and the 200-day eMA suggests we’re in for a deeper correction on the daily timeframe.
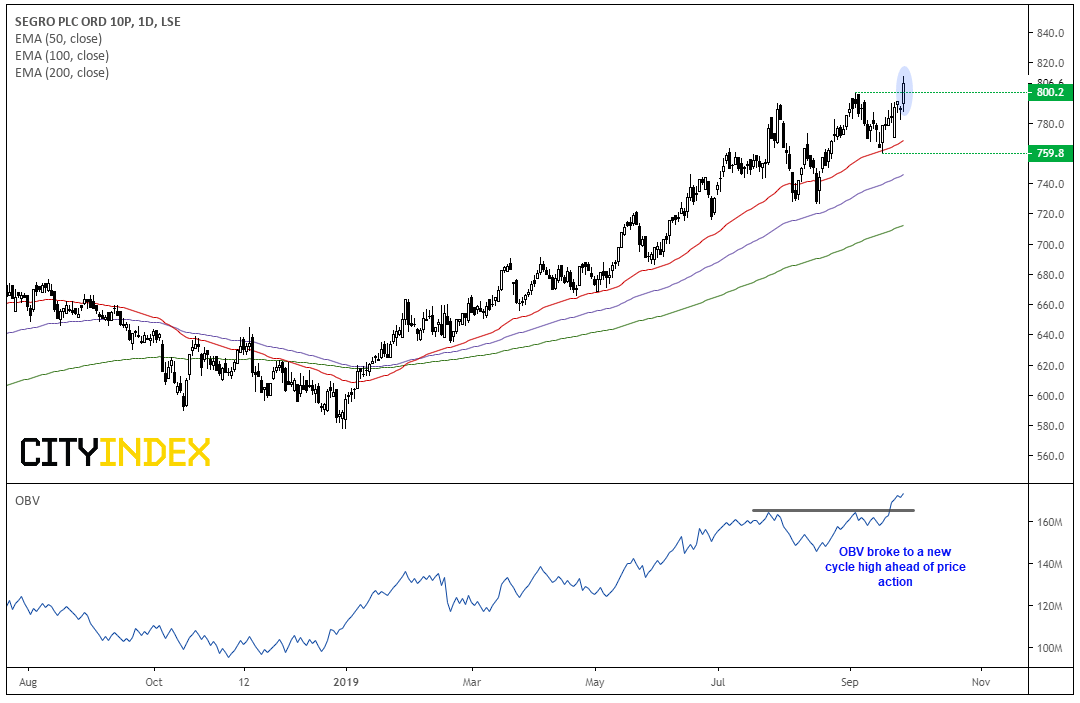
Segro Group (SGRO) trades in a clearly defined uptrend and the moving average are within bullish sequence and all pointing higher, to show momentum across multiple timeframes is bullish. Yesterday the stock broke and closed to a new cycle high above 800. Moreover, OBV (on balance volume) broke higher ahead of the breakout to show bullish demand was picking up.
- The trend remains bullish above 759.8, so bulls could seek to buy dips above this structural level and keep an open, bullish target
- Intraday traders could see of 800 holds as support to consider long positions
- The bullish bias is invalidated with a break beneath the 759.8 low.
The FTSE 100 has lagged its US and European counterparts this year, but that doesn’t mean it doesn’t try to play catch-up. We noted that US indices have respected key support levels along with USD/JPY, which paints a glimmer of hope we could be headed for a bout of risk-on. If so, it could provide the FTSE100 with a much-needed tailwind and help it break to a new cycle high.
We can see on the daily chart that yesterday’s bullish candle closed just off the highs of a 3-week range. Moreover, Wednesday’s low reaffirmed support around 7,200 before heading higher and is part of a 3-bar bullish reversal pattern at support (the morning star reversal). From here’s we’re looking for a break above 7,392.50 to confirm a breakout, although we’re also mindful that interim resistance awaits around 7,461.30 so this should be taken into account for from a reward/risk perspective.
With that said, there’ll still be some stocks within the index which may sustain a better breakout, so we’ve listed the top 20 performers YTD (year to date) and selected three FTSE stocks worth following.
JD Sports (JD) sits just off record highs following yesterday’s range expansion day. That the pullback failed to even test the 38.2% retracement is a testament to the trend’s strength, and momentum has only increased since breaking out of its basing pattern on the 10th September. The retracement took form of a small bullish flag which is a continuation pattern in an uptrend. Furthermore, as daily volumes remain above average and OBV is at fresh highs ahead of price are encouraging signs for a bullish breakout.
- Bulls could take a break above 730 as a sign the trend is set to resume
- Bias remains bullish whilst prices hold above the 653.2 breakout level, which could allows traders to buy dips above support if prices fail to break/hold higher
AVEVA Group (AVV) is currently trading within a bearish channel, although there are signs that it could be building up for a break higher to resume its longer-term bullish trend. The September low found support at the April high around 3460, which is near the 38.2% Fibonacci retracement level and above the 200-day eMA.
Yesterday’s 2-bar reversal marks a potential higher low, so a base could now be forming ahead of a bullish breakout. Volume was also above average yesterday which is an encouraging sign for a break higher.
- Bulls could use a break above 3,800 to signal a bullish breakout from the corrective channel. However, we’d prefer to see any breakout be accompanied on higher than average volume and / or OBV breaking a cycle high.
- Bears could seek short setups if the channel caps as resistance on lower timeframes. The 3460 lows become the next target, although a break beneath here and the 200-day eMA suggests we’re in for a deeper correction on the daily timeframe.
Segro Group (SGRO) trades in a clearly defined uptrend and the moving average are within bullish sequence and all pointing higher, to show momentum across multiple timeframes is bullish. Yesterday the stock broke and closed to a new cycle high above 800. Moreover, OBV (on balance volume) broke higher ahead of the breakout to show bullish demand was picking up.
- The trend remains bullish above 759.8, so bulls could seek to buy dips above this structural level and keep an open, bullish target
- Intraday traders could see of 800 holds as support to consider long positions
- The bullish bias is invalidated with a break beneath the 759.8 low.
Related Analysis:
Whilst FedEx Sounds The Alarm For Global Trade, Can UBS Weather The Storm? | FDX, UPS
Samsung’s Breakaway Gap – The Beginning Of Something Larger?




Open an account in minutes
Experience award-winning platforms with fast and secure execution, and enjoy tight spreads from 0.5 pts on FX and 0.3 pts on indices.
Economic calendar
Web Trader platform
Our sophisticated web-based platform is packed with features.
Related articles

SK Hynix IPO: Everything You Need to Know About SK Hynix
Learn everything you need to know about the SK Hynix IPO, including its Nasdaq listing, valuation, financials, ownership, competitors and investment risks.


FTSE 100 and GBP/USD forecast: UK data gives BoE March cut a further boost
The FTSE 100 edged higher to close in on last week’s record, as the pound weakened following the release of UK wages and Jobs data that puts a March rate cut firmly on the table, barring any surprises in tomorrow’s inflation report. Unless we see a sharp turnaround in data, I would be expecting another rate cut in June, and possibly more in the summer if inflation risks ease. This should keep the longer term FTSE 100 forecast firmly supported and keep a lid on sterling.

FTSE 100 forecast - Indices weekend outlook | February 16, 2026
With the US out on Monday for Presidents’ Day and China celebrating Spring Festival all week, it makes sense to focus on European markets to start the week off. So the FTSE 100 forecast is in focus for this week’s weekend indices outlook. We have plenty of UK, European and US earnings to look forward to as the week progresses, while key data from the UK and US will make rate cut expectations a key talking point on both sides of the pond.
This report is intended for general circulation only. It should not be construed as a recommendation, or an offer (or solicitation of an offer) to buy or sell any financial products. The information provided does not take into account your specific investment objectives, financial situation or particular needs. Before you act on any recommendation that may be contained in this report, independent advice ought to be sought from a financial adviser regarding the suitability of the investment product, taking into account your specific investment objectives, financial situation or particular needs.
StoneX Financial Pte. Ltd., may distribute reports produced by its respective foreign entities or affiliates within the StoneX group of companies or third parties pursuant to an arrangement under Regulation 32C of the Financial Advisers Regulations. Where the report is distributed to a person in Singapore who is not an accredited investor, expert investor or an institutional investor (as defined in the Securities Futures Act), StoneX Financial Pte. Ltd. accepts legal responsibility to such persons for the contents of the report only to the extent required by law. Singapore recipients should contact StoneX Financial Pte. Ltd. at 6826 9988 for matters arising from, or in connection with the report.
In the case of all other recipients of this report, to the extent permitted by applicable laws and regulations neither StoneX Financial Pte. Ltd. nor its associated companies will be responsible or liable for any loss or damage incurred arising out of, or in connection with, any use of the information contained in this report and all such liability is hereby expressly disclaimed. No representation or warranty is made, express or implied, that the content of this report is complete or accurate.
StoneX Financial Pte. Ltd. is not under any obligation to update this report.
Trading CFDs carries a high level of risk that may not be suitable for some investors. Consider your investment objectives, level of experience, financial resources, risk appetite and other relevant circumstances carefully. The possibility exists that you could lose some or all of your investments, including your initial deposits. If in doubt, please seek independent expert advice. Visit www.forex.com/en-sg/terms-and-policies for the complete Risk Disclosure Statement.