




Gold, ASX 200 analysis: Asian Open – 10/10/2023
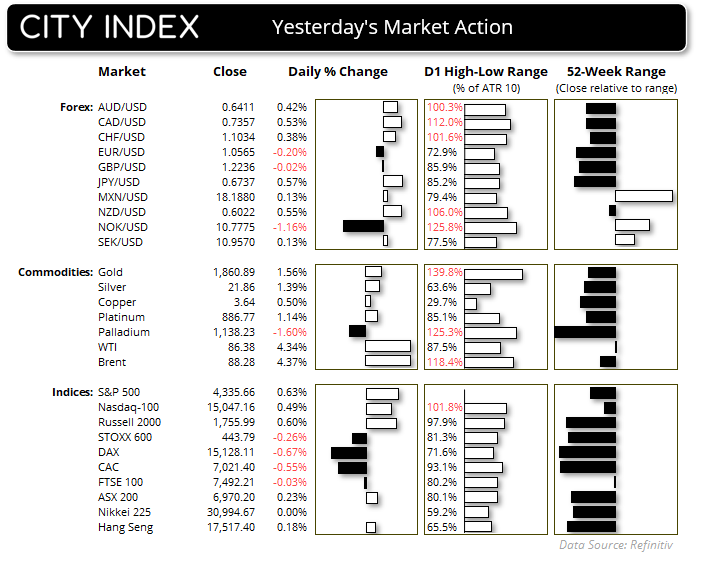
Gold enjoyed its best day in five months as it sucked in safe-haven flows, and we see the potential for further gains from here (over the neat-term, at least). The ASX rallied for a third day, but how it reacts around 7,000 today could dictate sentiment for the week.
Share this:

Market Summary:
- Bond investors finally found a reason to support bond prices on Monday, as the Middle East conflict saw bonds attract safe-haven flows and send yields lower
- Whilst the official markets were closed due to Columbus Day in the US, futures markets imply that that yields will open around -15bp lower from the 2-year, 10-year and 30-year bond yields
- The US dollar index fell for a fourth consecutive day, although only marginally. Still, it allowed AUD/USD to rise for a fourth day and close above 64c,
- Gold and oil held on to earlier gains achieved when they gapped higher at the weekly open, due to the Middle East conflict between Israel and Hamas.
- A Senior Hamas official said the group is open to the possibility of a truce with Israel
- However, Jefferson noted that the aggressive rise in bond yields means the Fed may need to “proceed carefully” with any future hikes
- The odds of a 25bp Fed hike in November fell from 27.1% to 11.4% following the comments
- The Conference Board Employment Leading Index (ELI) for the US rose to a 2-month high to signal “continued job growth ahead”, with their senior economist adding “the US economy will continue adding jobs through the remainder of 2023 and into next year, even if the rate of growth slows”. Whilst their separate outlook favours a recession in early 2024, they expect it to be short lived
- Wall Street looked past the negative sentiment from the Middle East conflict with the S&P 500 leading the way and rose 0.63% to a 10-day high
Events in focus (AEDT):
- 10:30 – Australian consumer sentiment (Westpac)
- 10:50 – Japan’s current account
- 11:30 – Australian building approvals, business confidence (NAB)
ASX 200 at a glance:
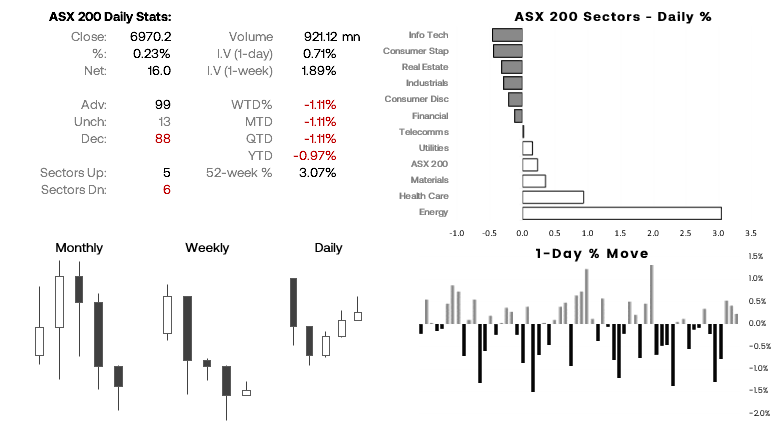
- The ASX 200 rose for a third day on Monday, and the cash market is set for a positive open today with Wall Street indices and SPI 200 futures all rising
- Energy stocks were the clear winner on the day, with the sector rising 3% to support the broader market, despite 6 sectors declining
- But with oil prices holding steady, can we expect a strong bullish follow-through today? Perhaps not. Especially with 7,000 resistance nearby
- The ASX tapped 7,000 yesterday which marked the high of the day, and it remains an important level today and perhaps this week
- Given the daily trend remain bearish, I’d feel inclined to seek evidence of an intraday swing high below or around 7,000 whilst keeping an eye on sentiment across other APAC stock indices
Gold technical analysis (daily chart):
I outlined a case for gold to rally from its cycle lows last week, and it’s played out well having reached the initial 1850 resistance zone. Whether it can extend gains from here is likely down to whether the Middle East conflict escalates beyond Israel and Hamas (which could send gold higher), or there’s a resolution. Under the latter scenario, we might find that bonds lose their bid, yields go higher and gold buckles on the strain one more. For now, I see the potential for some further upside towards 1880.
Gold technical analysis (1-hour chart):
Prices made a modest attempt to break higher in the US session, and with the 100-bar EMA and weekly R2 pivot point around 1870 is makes a likely resistance area should gold remain bid today in Asia. A pullback towards 1850 would be welcomed for potential longs, with the next upper target being around 1880 / August low / monthly pivot point.
Further out, gold could struggle if yields being to rise once more and we may find gold will try to close that gap.
View the full economic calendar
View the full economic calendar
-- Written by Matt Simpson
Follow Matt on Twitter @cLeverEdge
How to trade with City Index
You can trade with City Index by following these four easy steps:
- Open an account, or log in if you’re already a customer
• Open an account in the UK
• Open an account in Australia
• Open an account in Singapore
- Search for the market you want to trade in our award-winning platform
- Choose your position and size, and your stop and limit levels
- Place the trade
Related tags:


Open an account in minutes
Experience award-winning platforms with fast and secure execution, and enjoy tight spreads from 0.5 pts on FX and 0.3 pts on indices.
Economic calendar
Web Trader platform
Our sophisticated web-based platform is packed with features.
Related articles

Japanese Yen Outlook: USD/JPY, GBP/JPY, AUD/JPY Setups
USD/JPY and GBP/JPY show signs of stabilising, while AUD/JPY remains vulnerable as yen crosses deliver mixed technical signals.

S&P 500 Forecast: SPX Continues to Drift Away from Record Highs
Recent trading sessions have done little to restore confidence in the equity market. Over the last four sessions, the S&P 500 has declined by nearly 1.00%, a move that highlights growing short-term weakness and keeps the index moving further away from its record-high territory.


RBA delivers 25bp hike, Bullock now the main event
The RBA delivered the expected 25bp hike, but Bullock’s press conference now looms as the bigger volatility risk for AUD/USD and the ASX 200.
This report is intended for general circulation only. It should not be construed as a recommendation, or an offer (or solicitation of an offer) to buy or sell any financial products. The information provided does not take into account your specific investment objectives, financial situation or particular needs. Before you act on any recommendation that may be contained in this report, independent advice ought to be sought from a financial adviser regarding the suitability of the investment product, taking into account your specific investment objectives, financial situation or particular needs.
StoneX Financial Pte. Ltd., may distribute reports produced by its respective foreign entities or affiliates within the StoneX group of companies or third parties pursuant to an arrangement under Regulation 32C of the Financial Advisers Regulations. Where the report is distributed to a person in Singapore who is not an accredited investor, expert investor or an institutional investor (as defined in the Securities Futures Act), StoneX Financial Pte. Ltd. accepts legal responsibility to such persons for the contents of the report only to the extent required by law. Singapore recipients should contact StoneX Financial Pte. Ltd. at 6826 9988 for matters arising from, or in connection with the report.
In the case of all other recipients of this report, to the extent permitted by applicable laws and regulations neither StoneX Financial Pte. Ltd. nor its associated companies will be responsible or liable for any loss or damage incurred arising out of, or in connection with, any use of the information contained in this report and all such liability is hereby expressly disclaimed. No representation or warranty is made, express or implied, that the content of this report is complete or accurate.
StoneX Financial Pte. Ltd. is not under any obligation to update this report.
Trading CFDs carries a high level of risk that may not be suitable for some investors. Consider your investment objectives, level of experience, financial resources, risk appetite and other relevant circumstances carefully. The possibility exists that you could lose some or all of your investments, including your initial deposits. If in doubt, please seek independent expert advice. Visit www.forex.com/en-sg/terms-and-policies for the complete Risk Disclosure Statement.