



Gold Breaks Down on Descending Triangle, Sets Up $4k Test
Gold started last week with a strong sell-off but from that move a bounce developed. Bulls could not hold on through the weekly close, however, and the bearish structure remains in-place for XAU/USD.
Share this:

Gold Talking Points:
- The descending triangle looked at in last week’s forecast led to breakdown shortly after the weekly open, with prices rushing down to the 4100-4135 zone before finding a bounce.
- Even with Treasury yields continuing to surge, bold put in a sizable bounce, twice re-testing the $4200 level before sellers came in for rejection on Friday.
- At this point there remains the key level below of $4k which held the lows through June and July and that’s what sets up the bigger picture for gold markets as we move deeper into Q4 trade.
Last week started with a bang in gold markets as the descending triangle looked at in last week’s forecast led to a sizable breakdown. In one violent session on Monday, gold prices shed almost 4%, but sellers slowed the push once the 4104-4135 zone came in for a test.
The initial bounce from support was smooth, taking on the form of a bullish channel. But as I had highlighted over Twitter, that bullish channel when coupled with a bearish backdrop set up for a potential bear flag formation, and that led to breakdown after the test of resistance at 4200.
That wasn’t the last test of 4200, however, as another test showed on Friday after Non-farm Payrolls. And, like the first, sellers responded in a big way to push price back down to support at 4135.
Gold Four-Hour Price Chart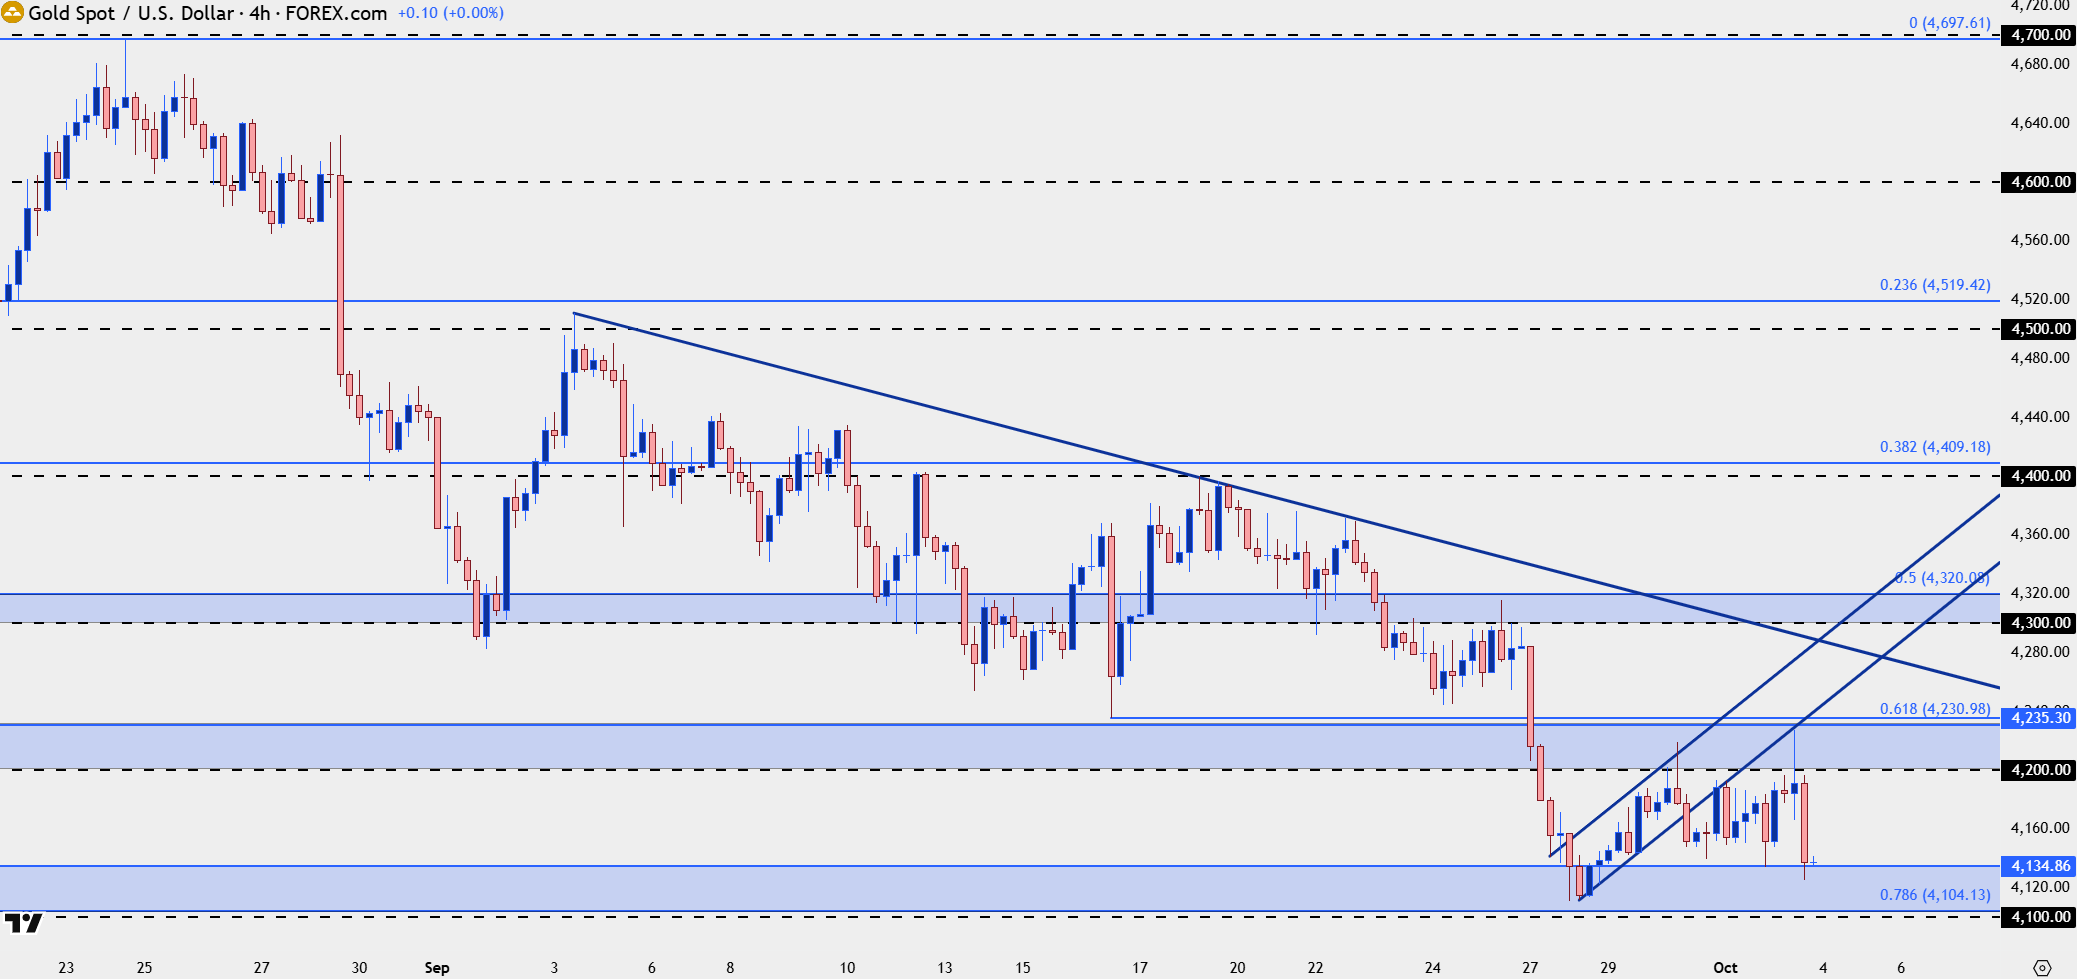
Chart prepared by James Stanley; data derived from Tradingview
Gold – Daily Divergence
The daily chart highlights well the tango taking place in gold, where recent lower-lows and lower-highs point back to that 4k support zone that put up such a rigid fight back in June and July.
There’s even been a hold of higher-lows so far, with sellers unwilling to push through the 4100 level that was previously resistance back in July, just before gold broke out of the falling wedge formation.
Also of interest from the daily chart is the Friday bar, which currently shows as a bearish engulfing pattern. These formations are often followed for continuation in that direction, which in this case would point to a test of $4100 along with breakdown potential into next week.
Gold Daily Chart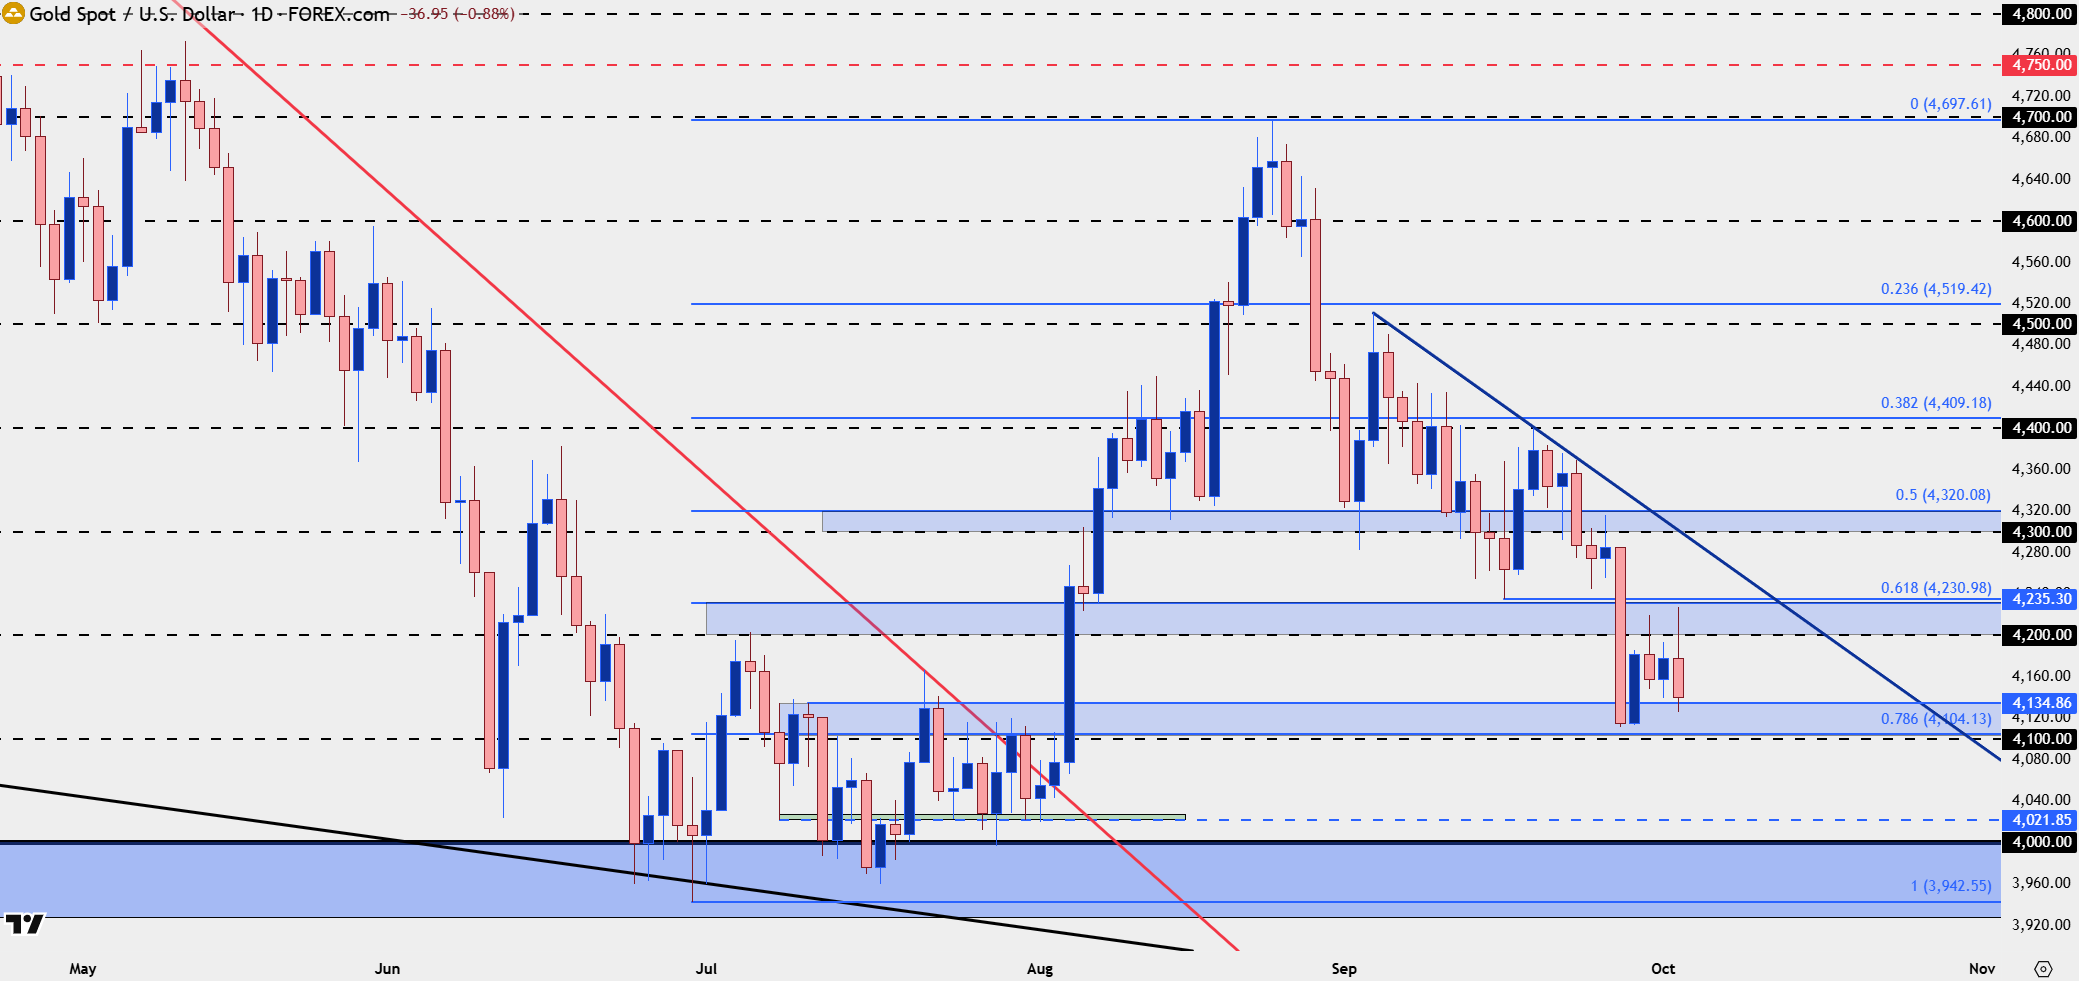
Chart prepared by James Stanley; data derived from Tradingview
Gold Big Picture
The weekly chart sets the stage as it illustrates the importance of that $4k level. This speaks to the prospect of institutional accumulation, which is one of the oft cited reasons for the support hold back in June and July. You’ll notice that not a single weekly candle closed below that $4k level, and that highlights how intra-week tests below $4k can be looked to for short-term bullish reversal potential, even if only for a rally up to a possible lower high.
If and when that zone gives, which could be signified by a weekly close below that price, then the prior support thesis would no longer hold as much attraction, and that would point to bearish continuation potential down to a 3500 re-test, which was last in-play as resistance in 2025, before Jerome Powell signaled his willingness to vote for rate cuts later that year.
Gold Weekly Chart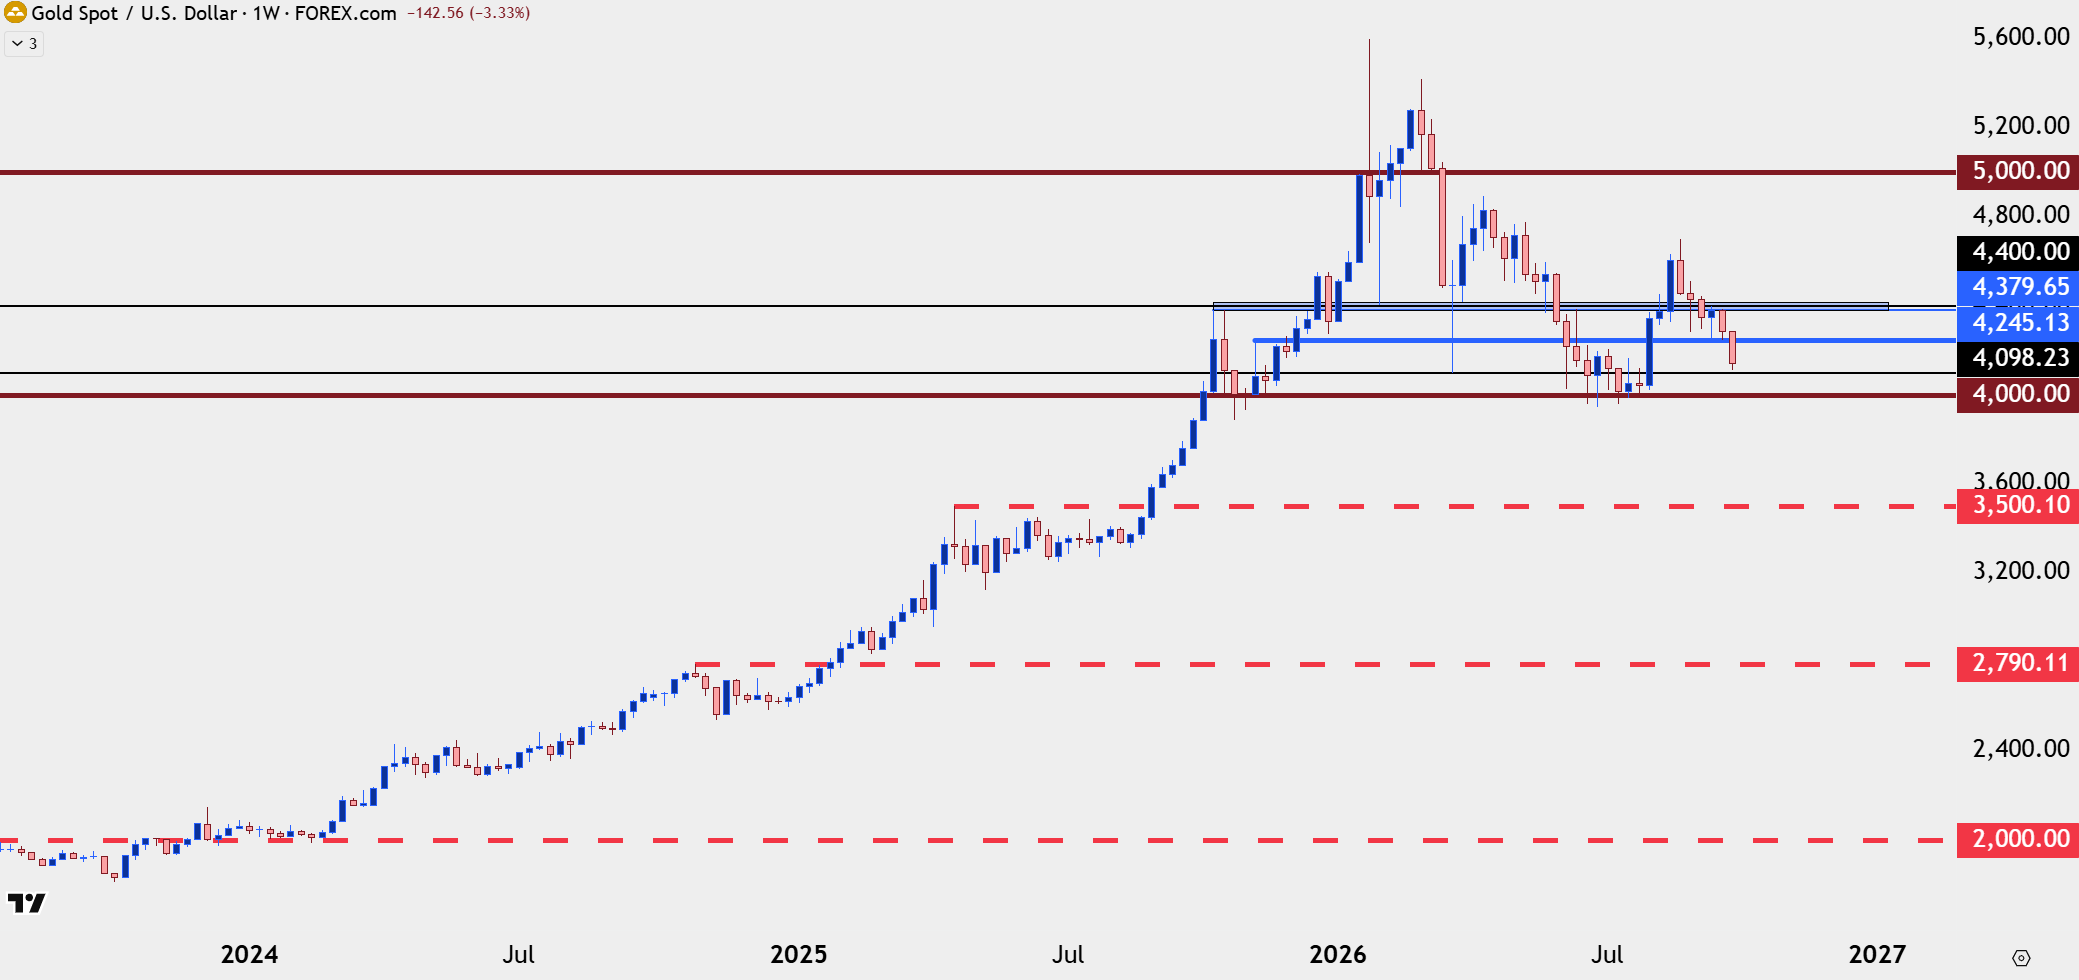
Chart prepared by James Stanley; data derived from Tradingview
--- written by James Stanley, Senior Market Analyst, Global Macro
Related tags:

Open an account in minutes
Experience award-winning platforms with fast and secure execution, and enjoy tight spreads from 0.5 pts on FX and 0.3 pts on indices.
Economic calendar
Web Trader platform
Our sophisticated web-based platform is packed with features.
Related articles
Gold outlook: seasonal tailwind offers hope with XAU/USD below $4,000
A historically stronger seasonal window and steady central bank buying are offering gold some hope after its slide to a fresh 2026 low. Reclaiming the 4,000 mark is the first sign that the metal may have found a floor.

Bitcoin, Gold Outlook: Bullish Hold or Bearish Shift?
Bitcoin, Gold Outlook: The dollar’s surge to new 2026 highs and approach toward nine-month resistance are raising near-term reversal risks across precious metals and currency markets. This follows recent declines that pushed Bitcoin below $70,000 and gold below $3,870.


Gold, EUR/USD hit 2026 lows as US yields erupt
US Treasury yields have staged one of their largest four-session increases in decades, hammering EUR/USD and gold. But while the euro's decline makes sense, gold's reaction has been extraordinary.

This report is intended for general circulation only. It should not be construed as a recommendation, or an offer (or solicitation of an offer) to buy or sell any financial products. The information provided does not take into account your specific investment objectives, financial situation or particular needs. Before you act on any recommendation that may be contained in this report, independent advice ought to be sought from a financial adviser regarding the suitability of the investment product, taking into account your specific investment objectives, financial situation or particular needs.
StoneX Financial Pte. Ltd., may distribute reports produced by its respective foreign entities or affiliates within the StoneX group of companies or third parties pursuant to an arrangement under Regulation 32C of the Financial Advisers Regulations. Where the report is distributed to a person in Singapore who is not an accredited investor, expert investor or an institutional investor (as defined in the Securities Futures Act), StoneX Financial Pte. Ltd. accepts legal responsibility to such persons for the contents of the report only to the extent required by law. Singapore recipients should contact StoneX Financial Pte. Ltd. at 6826 9988 for matters arising from, or in connection with the report.
In the case of all other recipients of this report, to the extent permitted by applicable laws and regulations neither StoneX Financial Pte. Ltd. nor its associated companies will be responsible or liable for any loss or damage incurred arising out of, or in connection with, any use of the information contained in this report and all such liability is hereby expressly disclaimed. No representation or warranty is made, express or implied, that the content of this report is complete or accurate.
StoneX Financial Pte. Ltd. is not under any obligation to update this report.
Trading CFDs carries a high level of risk that may not be suitable for some investors. Consider your investment objectives, level of experience, financial resources, risk appetite and other relevant circumstances carefully. The possibility exists that you could lose some or all of your investments, including your initial deposits. If in doubt, please seek independent expert advice. Visit www.forex.com/en-sg/terms-and-policies for the complete Risk Disclosure Statement.