



Gold Hints at Quiet Accumulation Despite Persistent US Dollar Strength
Gold (XAU/USD) shows signs of quiet accumulation above $4,000 despite US dollar strength, with fading bearish momentum and dip buyers eyeing a rebound.
Share this:

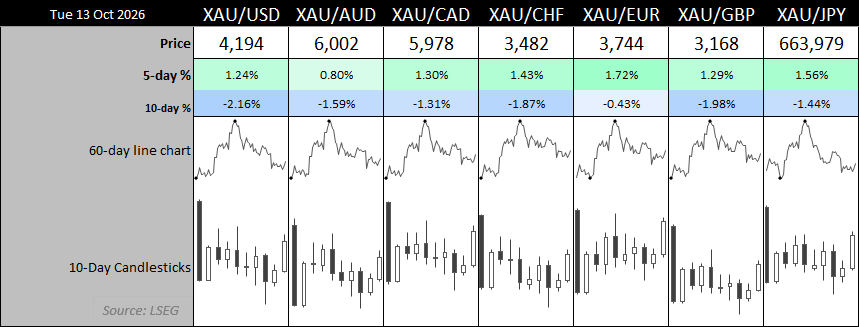
Gold prices are showing signs of stabilisation following a 14% decline from their August high, despite the US dollar index reaching an 18-month high. Falling trading volumes and waning bearish momentum suggest selling pressure is easing, while technical support above $4,000 could provide a foundation for a rebound towards $4,300. However, upcoming US inflation data, retail sales and remarks from Fed Chair Kevin Warsh could determine whether gold bulls regain control.
View related analysis:
Gold Price Outlook: Quiet Accumulation Emerges as US Dollar Rally Stretches
US Dollar Index (DXY) Technical Outlook
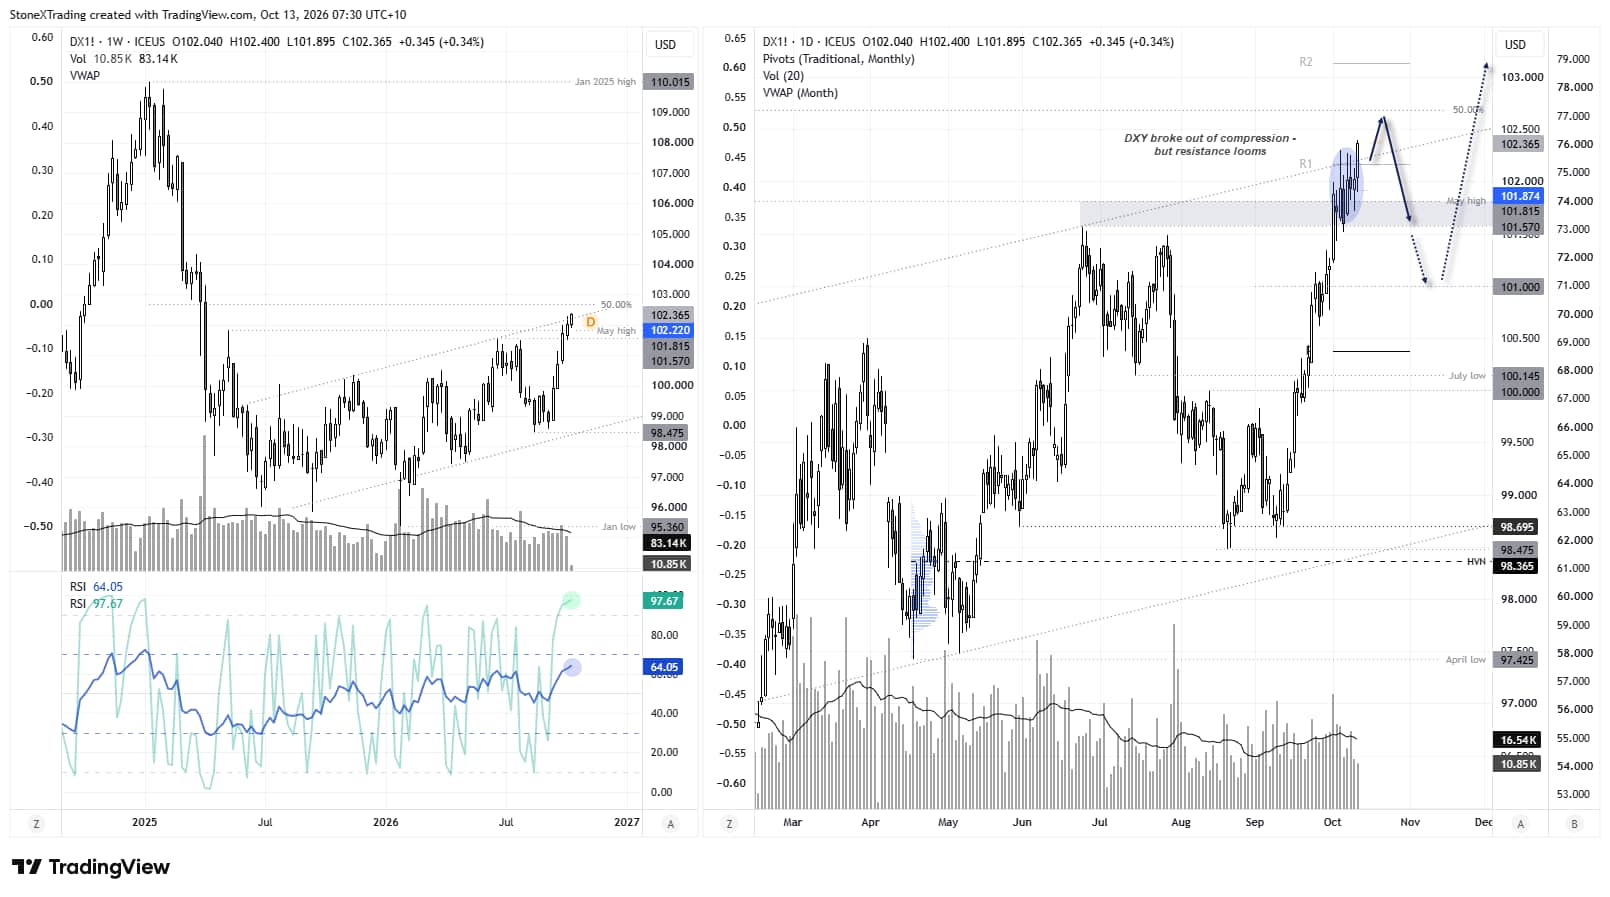
We saw the dollar extend its rally on Monday, as it tries to notch up its fifth consecutive weekly gain. It seems traders are bidding up the US dollar heading into this week’s inflation and retail sales reports, with Fed Chair Kevin Warsh also set to deliver remarks.
But with resistance looming and expectations of hot data and hawkish comments, I am now wondering whether the USD has rallied too far over the near term. Anything less than a hot CPI print could provide the Fed with more time – and we’re already seeing traders push back expectations for the first hike as it is.
So while headlines will focus on DXY reaching an 18-month high, I am noting resistance overhead and the potential for data not to be as hot, or comments as hawkish, as bulls would like. And that could potentially set the stage for a rebound in gold prices.
Gold Futures (GC) Technical Outlook
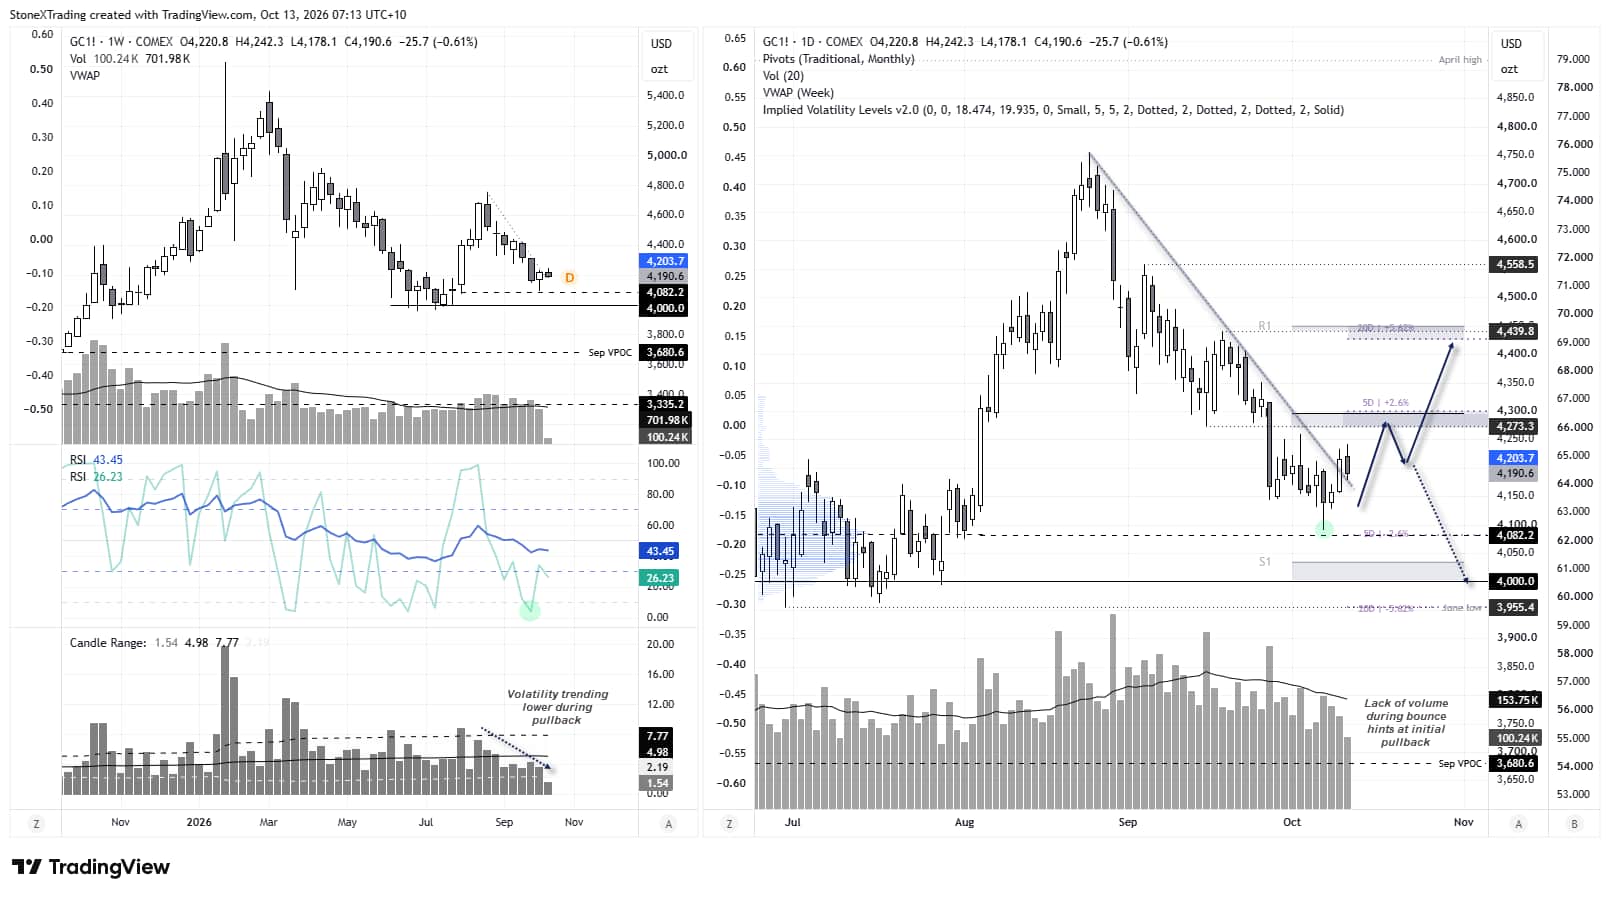
Following a 14% retracement from its August high, gold is showing signs of waning bearish momentum above $4,000. This suggests to me that dip buyers are not waiting for prices to test the big round number.
A small bullish pin bar formed last week to show a mild attempt to reverse the trend, while the lower indicator shows that weekly high-to-low volatility has generally been trending lower during gold's recent decline.
Also note that weekly trading volumes have been falling, which is not what I’d expect to see during a convincing bearish move. The weekly RSI (2) also reached oversold territory two weeks ago and is now attempting to turn higher alongside gold prices.

Gold Price Outlook: Bulls Eye Dips Above 4,091
The daily chart shows a mild attempt to break trend resistance on Friday. The fact that trading volumes were low makes Monday’s pullback less of a surprise, especially with US CPI, retail sales and a speech from Kevin Warsh pending. If anything, it gives me hope that gold will continue to retrace gently within last week’s range.
Also note that last week’s low held above the 4,082.2 high-volume node (HVN), which incidentally sits near the lower one-week implied volatility band. My initial upside target is the monthly pivot point, just below the 4,300 handle and upper one-week implied volatility band.
Ultimately, I suspect quiet accumulation is taking place in gold, which could make such dips appealing to bulls while prices hold above the 4,091.2 low.
Source: COMEX, TradingView
Gold futures (GC) weekly and daily technical charts showing fading bearish momentum, support above $4,091 and potential upside towards $4,300.
Gold Tries to Form Intraday Base
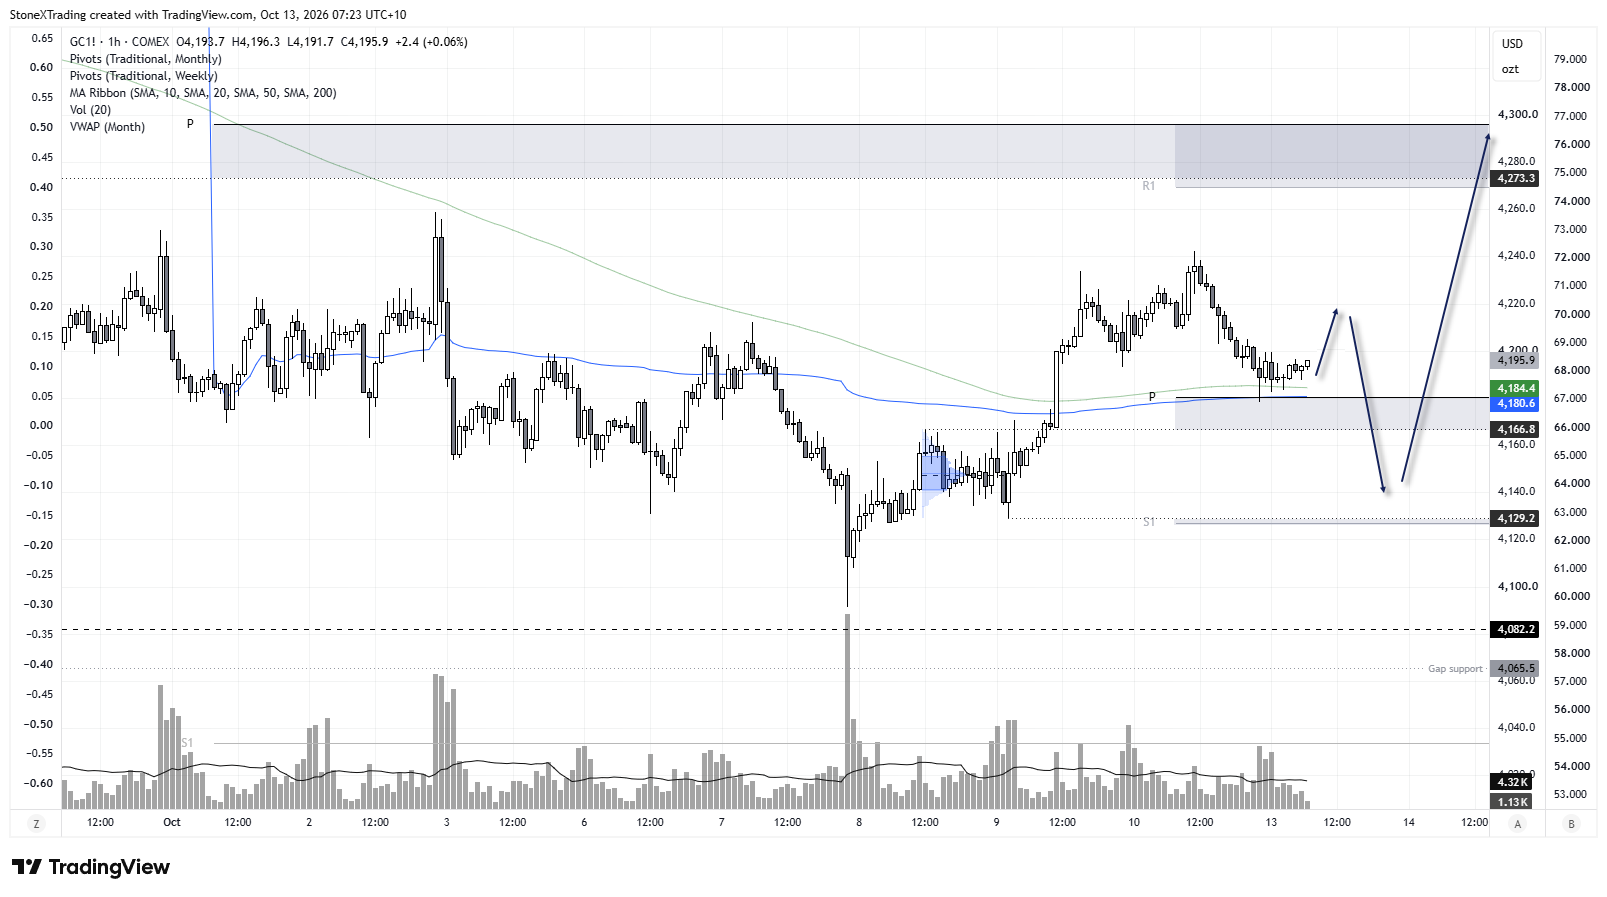
The 1-hour chart shows that Monday’s pullback is trying to form a base around 4,180 – where several technical levels converge. Monday’s low respected the weekly pivot point and month-to-date VWAP, while prices are now holding above the 200-bar SMA. This could pave the way for an intraday bounce today, though risks of a deeper pullback remain.
If prices do break lower, bulls could seek evidence of a swing low around the 4,166.8 high, or the 4,130 area near the weekly S1 pivot and swing low.
Source: ICE, TradingView
Related tags:


Open an account in minutes
Experience award-winning platforms with fast and secure execution, and enjoy tight spreads from 0.5 pts on FX and 0.3 pts on indices.
Economic calendar
Web Trader platform
Our sophisticated web-based platform is packed with features.
Related articles
British Pound Technical Outlook: GBP/USD Bulls Fight to Stabilize at Critical Support 10 13 2026
GBP/USD is compressing into a tight near-term range just above key support, with a breakout likely to provide the next directional cue.

EUR/USD forecast: Downside risks persist despite recovery
Amid a lack of any major news, the FX markets have been largely in consolidation mode in the first half of Tuesday’s session. The US dollar eased along with bond yields and oil prices, allowing downbeat currencies like the euro to rebound modestly. With US CPI data due for release on Wednesday, don’t expect much in the way of a sharper decline in USD ahead of it. If anything, we could see the dollar buying resume, especially if crude oil prices catch a bid again amid the ongoing situation.


GBP/USD, XAU/USD Forecast: Two trades to watch
GBP/USD rises amid a weaker USD, but gains could be limited. Gold rises as Oil, Treasury yields slip, central bank buying remains strong.

This report is intended for general circulation only. It should not be construed as a recommendation, or an offer (or solicitation of an offer) to buy or sell any financial products. The information provided does not take into account your specific investment objectives, financial situation or particular needs. Before you act on any recommendation that may be contained in this report, independent advice ought to be sought from a financial adviser regarding the suitability of the investment product, taking into account your specific investment objectives, financial situation or particular needs.
StoneX Financial Pte. Ltd., may distribute reports produced by its respective foreign entities or affiliates within the StoneX group of companies or third parties pursuant to an arrangement under Regulation 32C of the Financial Advisers Regulations. Where the report is distributed to a person in Singapore who is not an accredited investor, expert investor or an institutional investor (as defined in the Securities Futures Act), StoneX Financial Pte. Ltd. accepts legal responsibility to such persons for the contents of the report only to the extent required by law. Singapore recipients should contact StoneX Financial Pte. Ltd. at 6826 9988 for matters arising from, or in connection with the report.
In the case of all other recipients of this report, to the extent permitted by applicable laws and regulations neither StoneX Financial Pte. Ltd. nor its associated companies will be responsible or liable for any loss or damage incurred arising out of, or in connection with, any use of the information contained in this report and all such liability is hereby expressly disclaimed. No representation or warranty is made, express or implied, that the content of this report is complete or accurate.
StoneX Financial Pte. Ltd. is not under any obligation to update this report.
Trading CFDs carries a high level of risk that may not be suitable for some investors. Consider your investment objectives, level of experience, financial resources, risk appetite and other relevant circumstances carefully. The possibility exists that you could lose some or all of your investments, including your initial deposits. If in doubt, please seek independent expert advice. Visit www.forex.com/en-sg/terms-and-policies for the complete Risk Disclosure Statement.