






Nasdaq 100 Outlook: Price Approaches Historical Highs Once Again
The Nasdaq index began the week with steady bullish momentum, posting a gain of just over 1.4% in the short term.
Share this:

The Nasdaq index began the week with steady bullish momentum, posting a gain of just over 1.4% in the short term. This upward bias has been supported by positive sentiment surrounding ongoing trade war negotiations. Despite the escalating conflict in the Middle East, market confidence has remained strong, and this could continue to serve as a key catalyst in the coming trading sessions.
Trade War Developments
Although the trade conflict between the United States and China remains ongoing, partial progress has been made in the negotiations. The outlook now appears to be moving toward a potential short-term agreement to end the standoff.
For the time being, the proposal includes maintaining initial tariffs of 55% on certain Chinese goods and just 10% on U.S. exports to China, as part of a preliminary deal reflecting both countries’ immediate needs. This would serve as the basis for a partial understanding, barring any unexpected disruptions to the diplomatic plans.
It’s important to note that the Nasdaq index has historically shown sensitivity to trade war news, experiencing sharp drops during heightened tensions. Currently, it appears to be pricing in a renewed sense of confidence, supported by the latest progress in talks between the two economic powers.
This renewed optimism has also been bolstered by the strong performance of the top five stocks in the index: Microsoft (+1.08%), Nvidia (+2.72%), Apple (+0.41%), Amazon (+2.01%), and Alphabet (+0.78%) during the start of the trading week. Their strength reinforces the growing risk appetite for the Nasdaq, as long as positive expectations for negotiations persist.

Source: Slickcharts
Therefore, Nasdaq’s confidence remains tightly linked to trade war outcomes. If optimism continues, buying pressure may remain the primary driver for the index over the coming weeks.
Is the Geopolitical Conflict Having an Impact?
Since last week, a significant conflict has erupted in the Middle East, with ongoing attacks between Israel and Iran. Although the conflict remains active, global powers have begun diplomatic efforts to establish a non-aggression agreement between the two countries.
Initially, this military escalation triggered uncertainty in financial markets. However, sentiment appears to have stabilized, mainly because the conflict has so far remained geographically contained, without directly impacting other countries or critical trade routes. As a result, market confidence has absorbed the geopolitical risks, shifting focus to a possible diplomatic resolution.
This sentiment is reflected in CNN’s Fear and Greed Index, which currently stands at 62 points, squarely in the "greed" zone, with an upward trend that shows no immediate signs of retreating into “neutral” territory. This performance suggests that despite recent risks, investor appetite for risk assets remains intact in the short term.
Source: CNN
As long as this positive sentiment holds, it could act as a tailwind for Nasdaq’s performance, reinforcing demand for tech-oriented risk assets, provided the geopolitical situation doesn’t worsen further.
Nasdaq Technical Outlook
Source: StoneX, Tradingview
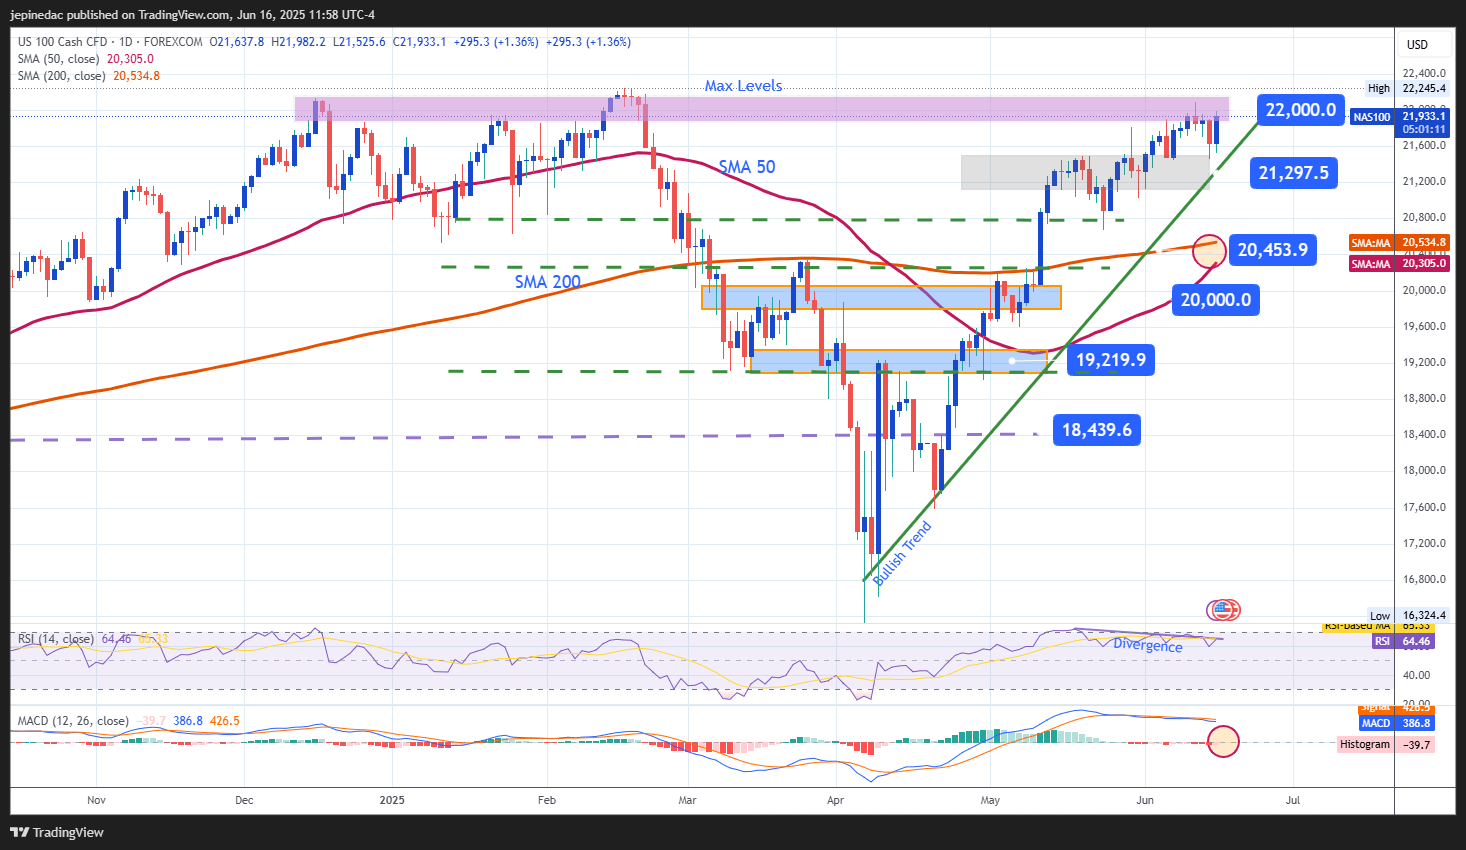
- Uptrend: Since early April, Nasdaq has maintained a bullish trend, consistently trading above the 21,000-point mark. Bullish price swings have sustained this buying trend, with no significant bearish corrections observed so far. However, the index is once again approaching its historical highs, which could act as a key resistance and potentially trigger short-term selling pressure.
- RSI: The Relative Strength Index (RSI) remains above the neutral 50 level, but has begun to show lower highs, while the Nasdaq index is printing higher highs. This bearish divergence may indicate short-term imbalance, raising the risk of downside corrections in upcoming sessions.
- MACD: The MACD histogram is fluctuating near the neutral zero line, signaling a balance between bullish and bearish momentum. This may lead to a sideways movement if prices fail to break through key resistance levels.
Key Levels:
- 22,000 points – Near-Term Resistance: This level aligns with the index’s historical highs. A breakout above this zone could strengthen the current bullish bias and open the door to new record highs.
- 21,297 points – Near-Term Support: This area reflects short-term neutrality and aligns with an upward trendline, possibly acting as a key buffer against bearish corrections.
- 20,453 points – Critical Support: This level coincides with the 50- and 200-period moving averages. A drop to this level may revive a bearish bias and threaten the current bullish trend in Nasdaq.
Written by Julian Pineda, CFA – Market Analyst
Follow him at: @julianpineda25


Open an account in minutes
Experience award-winning platforms with fast and secure execution, and enjoy tight spreads from 0.5 pts on FX and 0.3 pts on indices.
Economic calendar
Web Trader platform
Our sophisticated web-based platform is packed with features.
Related articles

Nikkei breakout accelerates as yen weakness returns
Nikkei has started October with a powerful breakout, helped by renewed yen weakness and strong upside momentum


S&P 500 Forecast: SPX Continues to Drift Away from Record Highs
Recent trading sessions have done little to restore confidence in the equity market. Over the last four sessions, the S&P 500 has declined by nearly 1.00%, a move that highlights growing short-term weakness and keeps the index moving further away from its record-high territory.

Nasdaq Breakout Potential into Q4 for Melt Up Scenarios
The headlines seem negative in almost any place that you look, with surging Treasury yields and frothy AI valuations getting more and more attention. But, if it’s so bad, why hasn’t the Nasdaq melted down yet, even as the Fed has started hiking rates?

This report is intended for general circulation only. It should not be construed as a recommendation, or an offer (or solicitation of an offer) to buy or sell any financial products. The information provided does not take into account your specific investment objectives, financial situation or particular needs. Before you act on any recommendation that may be contained in this report, independent advice ought to be sought from a financial adviser regarding the suitability of the investment product, taking into account your specific investment objectives, financial situation or particular needs.
StoneX Financial Pte. Ltd., may distribute reports produced by its respective foreign entities or affiliates within the StoneX group of companies or third parties pursuant to an arrangement under Regulation 32C of the Financial Advisers Regulations. Where the report is distributed to a person in Singapore who is not an accredited investor, expert investor or an institutional investor (as defined in the Securities Futures Act), StoneX Financial Pte. Ltd. accepts legal responsibility to such persons for the contents of the report only to the extent required by law. Singapore recipients should contact StoneX Financial Pte. Ltd. at 6826 9988 for matters arising from, or in connection with the report.
In the case of all other recipients of this report, to the extent permitted by applicable laws and regulations neither StoneX Financial Pte. Ltd. nor its associated companies will be responsible or liable for any loss or damage incurred arising out of, or in connection with, any use of the information contained in this report and all such liability is hereby expressly disclaimed. No representation or warranty is made, express or implied, that the content of this report is complete or accurate.
StoneX Financial Pte. Ltd. is not under any obligation to update this report.
Trading CFDs carries a high level of risk that may not be suitable for some investors. Consider your investment objectives, level of experience, financial resources, risk appetite and other relevant circumstances carefully. The possibility exists that you could lose some or all of your investments, including your initial deposits. If in doubt, please seek independent expert advice. Visit www.forex.com/en-sg/terms-and-policies for the complete Risk Disclosure Statement.