



Nasdaq Grinds at Highs as Tesla, Google Set to Report
The Nasdaq is up almost 40% from the April lows and two tech heavyweights are set to report earnings after the bell, with implication on the AI theme.
Share this:

Nasdaq, Tesla, Google Talking Points:
- There was a buying opportunity in stocks in early-Q2 trade and the Nasdaq 100 tested a major spot of support, the same looked at in the Q2 forecast just inside of the 17k figure in NDX.
- Since then – buyers have been large and in charge and more recently there hasn’t even been much for pullbacks, which complicates matters for short-term traders as risk management becomes a more daunting prospect with a recent lack of two-way price action.
- The trend is undeniable and as I wrote in the 2025 forecast for equities, I expected this to remain. But the key is working with the trend in a reasonable manner rather than just buying highs and hoping it continues.
- As we enter earnings season, there is perhaps opportunity for pullback. Tesla and Google earnings tonight will shine a light on the AI theme, and next week we hear from heavyweights Meta and Microsoft.
Paradoxically a market that goes pretty much just one direction can be more difficult to trade than one that doesn’t. While newer traders may appreciate the opportunity to simply guess and hope and ride the wave higher, more experienced traders will often prioritize risk management because they know what can happen when they don’t. It doesn’t take long for a trader’s best ideas to turn out badly, particularly when risk isn’t managed on the way into the trade.
This can also explain the ‘beginner’s luck’ phenomenon that’s often discussed around trading. New traders simply lack the context with which to overthink, and instead they can look and see that price has simply continued to go up and, well, speculate that it will continue to happen, regardless of the context of why it may not.
But, what showed up in late-Q1 and early-Q2 is example of where that hope and optimism can quickly go awry. The Nasdaq index lost as much as -25.56% from the February high to the April low and there wasn’t a significant change in the fundamental backdrop at the time; it was simply fear of the oncoming tariffs and how it might disrupt the globalized business backdrop that’s taken over in the past couple of decades.
But – as I wrote in the Q2 forecast there remained bullish motive, and I thought it unlikely that the sell-off would last for much longer as there were some very simple levers that could be pulled by some important players that could alter the backdrop quickly. First and foremost was President Trump, who ushered in Q2 with the ‘liberation day’ announcement of tariffs. It didn’t take long for the headlines to turn, from the optimistic pro-business backdrop that was associated with him in January to shift into the ‘short term pain, long term gain,’ driven by the assumption that President Trump wanted to drive down yields by pushing capital flows from stocks and into bonds.
But that didn’t last for more than a week into Q2 as Trump softened his stance on tariffs on Wednesday, April 9th, leading to one of the strongest single day rallies that we’ve ever seen. Interestingly, that happened after SPX showed the first oversold reading on the weekly chart since Covid; and it took place amidst a backdrop that saw a noted financial figure on television spending the weekend before warning of a ‘Black Monday.’
Well, that day that was supposed to be ‘Black Monday’ marked the low for SPX, and the Nasdaq 100, as well. And the Nasdaq is up a whopping 39.64% from that inflection point.
Again, a strong lesson in why risk management is so utterly important, those same new traders that might find riding the up-trend today as simply could’ve been caught selling at the low then, and it’s only with that experience, that pain, that one realizes there’s more trading strategy than just guessing and hoping.
Nasdaq Weekly Price Chart
Chart prepared by James Stanley; data derived from Tradingview
Tesla Earnings
There’s no company that illustrates today’s market environment better than Tesla.
While the company’s main line of business is under fire from multiple fronts, Elon Musk has built more loyalty amongst his fans/investors than perhaps any CEO in the history of American business. He’s also successfully aligned the auto manufacturer with pretty much any hot button technology theme or idea of the past decade; both inside and outside of Tesla. He’s also a lightning rod of attention and the stock seemingly defies fundamentals.
More recently, it’s the political exposure that’s been the stock’s point of challenge but, amazingly, the equity is up over 55% from the April 7th low even despite the very public falling out with the current administration.
Today’s earnings report is widely expected to show weakness on the back of fewer vehicles delivered. This won’t come as a surprise. But – fully expect Elon Musk to spend the conference call talking about the future – about the Robotaxi rollout and about Optimus production of the humanoid robot, both products that are housed inside of Tesla. It should also come as no surprise if he talks up his other company, the private enterprise of xAI which was in the headlines recently as it’s been rumored that Tesla will be investing in the company. That company has absorbed the social media company X (formerly Twitter) and it’s created Elon’s AI offering, called Grok, built on user data from platform. It’s already been announced that Tesla will be rolling out the chatbot across their line of Electric Vehicles via software update, so again, this should come as no surprise if it becomes a focal point in today’s call pertaining to AI development and Tesla’s role in that.
The Fibonacci retracement produced by last May’s low to December’s high has shown several inflection points of note, most recently support in June at the 61.8% level and before that, a grouping of support points in March and April at the 76.4% retracement of 221.34.
That shows support at the 50% mark of 313.67 and next resistance around the June high of 354.94.
Tesla Daily Price Chart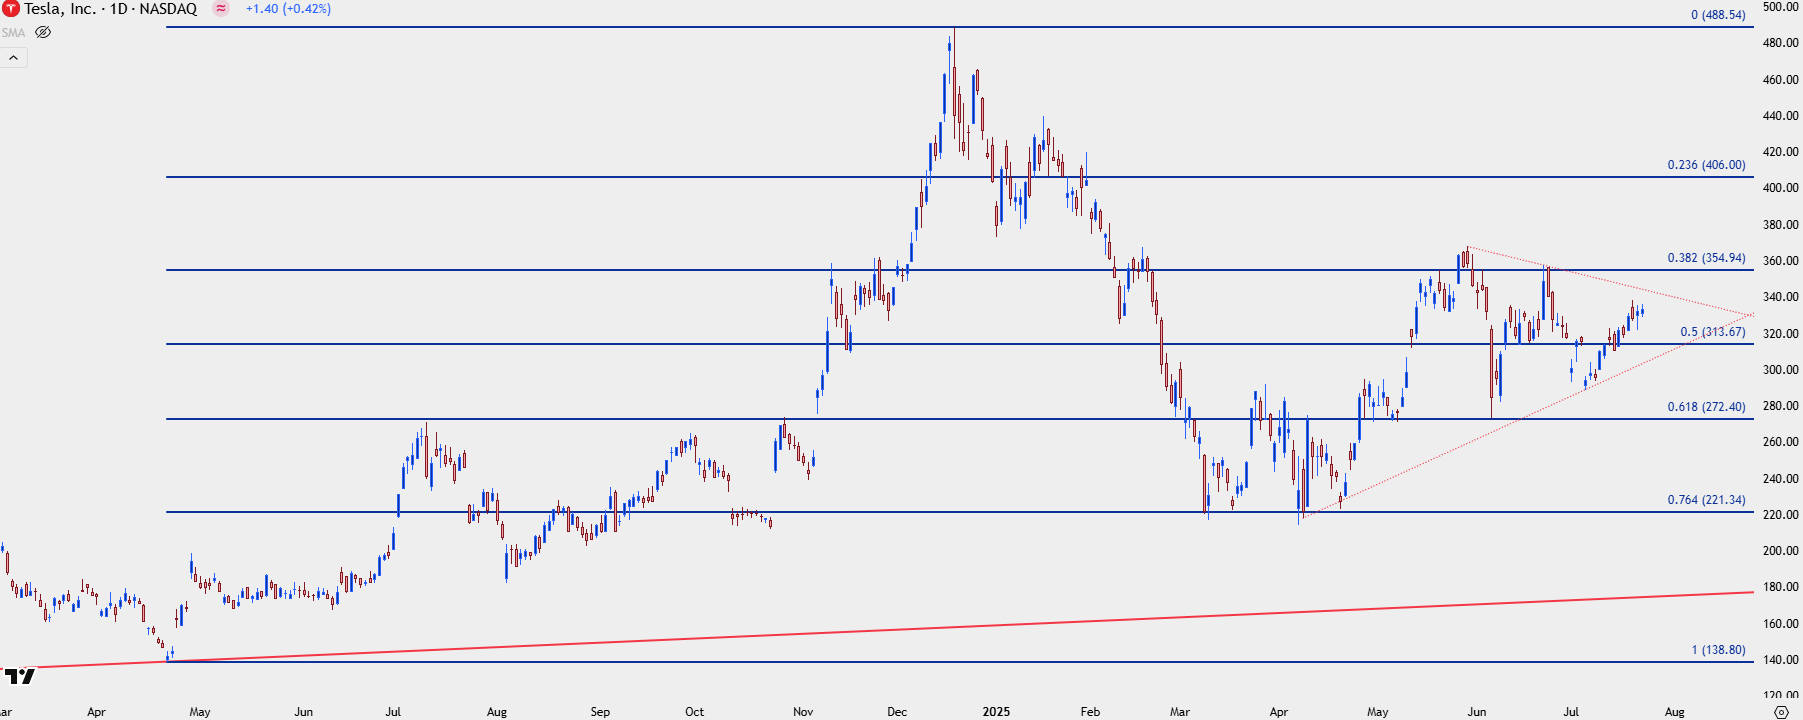
Chart prepared by James Stanley; data derived from Tradingview
Google Goes into the Gap
Compared to Tesla, Google seems downright tame, and perhaps even boring, to a degree (which isn’t necessarily a bad thing for portfolio managers).
It also presents perhaps more of a pure play on AI with their Gemini product. While Tesla has a few different areas of exposure on AI, those are largely unique to Tesla with driver assistance and a social media-driven chat bot. It also hasn’t been a one-way train in Google’s equity, as a massive drop showed on February 5th driven by slowing cloud growth and increased investment into AI infrastructure that they still haven’t recovered from.
That gap goes from the high of 208.21 down to around the current level, with resistance at 192.70. That gap now represents an area of key resistance and if we are to see the AI-driven tech mania continue, then Google’s equity will likely need to begin chipping away at this unfilled gap.
Google Daily Chart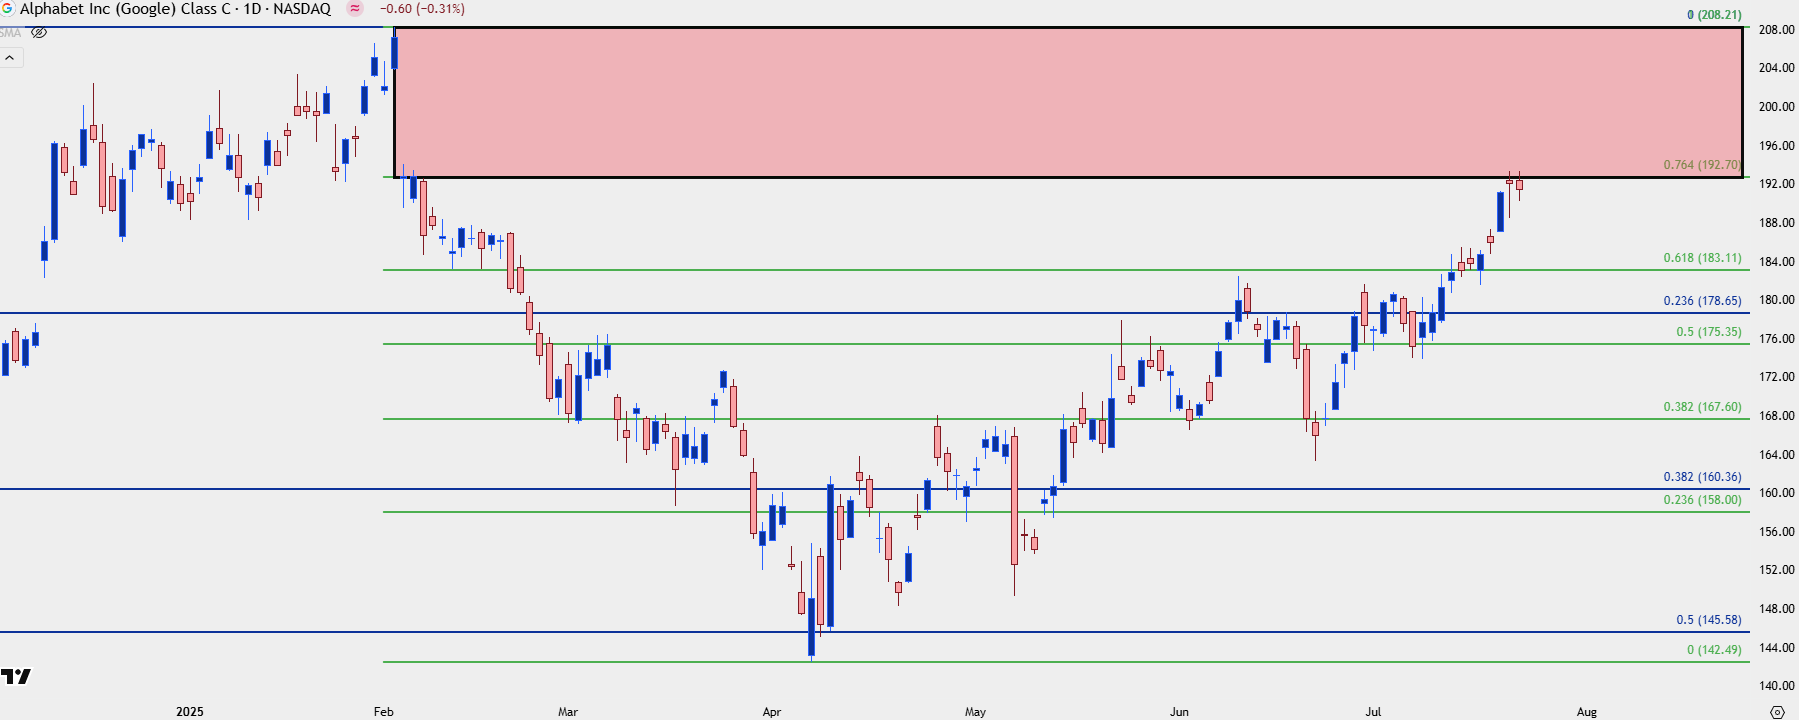
Chart prepared by James Stanley; data derived from Tradingview
--- written by James Stanley, Senior Strategist
Related tags:
Latest market news




Open an account in minutes
Experience award-winning platforms with fast and secure execution, and enjoy tight spreads from 0.5 pts on FX and 0.3 pts on indices.
Economic calendar
Web Trader platform
Our sophisticated web-based platform is packed with features.
Related articles
USD Exhaustion into Bearish Engulf: EUR/USD, GBP/USD, USD/JPY
It was a big week for the Dollar with stronger inflation pushing rate hike themes, with price action diverging as price printed a bearish engulf on the weekly DXY chart.
Magnificent Seven Earnings Preview: Is the AI Boom Facing Its Biggest Test Yet?
After a wobble in the broader AI trade, the Magnificent Seven" stocks are reporting earnings in the coming week - see the key themes and Nasdaq 100 levels to watch!


Nasdaq 100 forecast: Tech stocks not out of woods yet
US index futures pushed higher in the first half of Friday’s session, taking cues from a strong performance from European equities. Both European and US equity futures extending yesterday’s impressive recovery after the sharp sell-off earlier in the week. But the lingering concerns around the AI investment cycle remain, while bond markets were easing lower again, lifting yields.

This report is intended for general circulation only. It should not be construed as a recommendation, or an offer (or solicitation of an offer) to buy or sell any financial products. The information provided does not take into account your specific investment objectives, financial situation or particular needs. Before you act on any recommendation that may be contained in this report, independent advice ought to be sought from a financial adviser regarding the suitability of the investment product, taking into account your specific investment objectives, financial situation or particular needs.
StoneX Financial Pte. Ltd., may distribute reports produced by its respective foreign entities or affiliates within the StoneX group of companies or third parties pursuant to an arrangement under Regulation 32C of the Financial Advisers Regulations. Where the report is distributed to a person in Singapore who is not an accredited investor, expert investor or an institutional investor (as defined in the Securities Futures Act), StoneX Financial Pte. Ltd. accepts legal responsibility to such persons for the contents of the report only to the extent required by law. Singapore recipients should contact StoneX Financial Pte. Ltd. at 6826 9988 for matters arising from, or in connection with the report.
In the case of all other recipients of this report, to the extent permitted by applicable laws and regulations neither StoneX Financial Pte. Ltd. nor its associated companies will be responsible or liable for any loss or damage incurred arising out of, or in connection with, any use of the information contained in this report and all such liability is hereby expressly disclaimed. No representation or warranty is made, express or implied, that the content of this report is complete or accurate.
StoneX Financial Pte. Ltd. is not under any obligation to update this report.
Trading CFDs carries a high level of risk that may not be suitable for some investors. Consider your investment objectives, level of experience, financial resources, risk appetite and other relevant circumstances carefully. The possibility exists that you could lose some or all of your investments, including your initial deposits. If in doubt, please seek independent expert advice. Visit www.forex.com/en-sg/terms-and-policies for the complete Risk Disclosure Statement.