



Pattern Play Golden Star Resources
Bullish trendline breakout and bullish MACD crossover.
Share this:

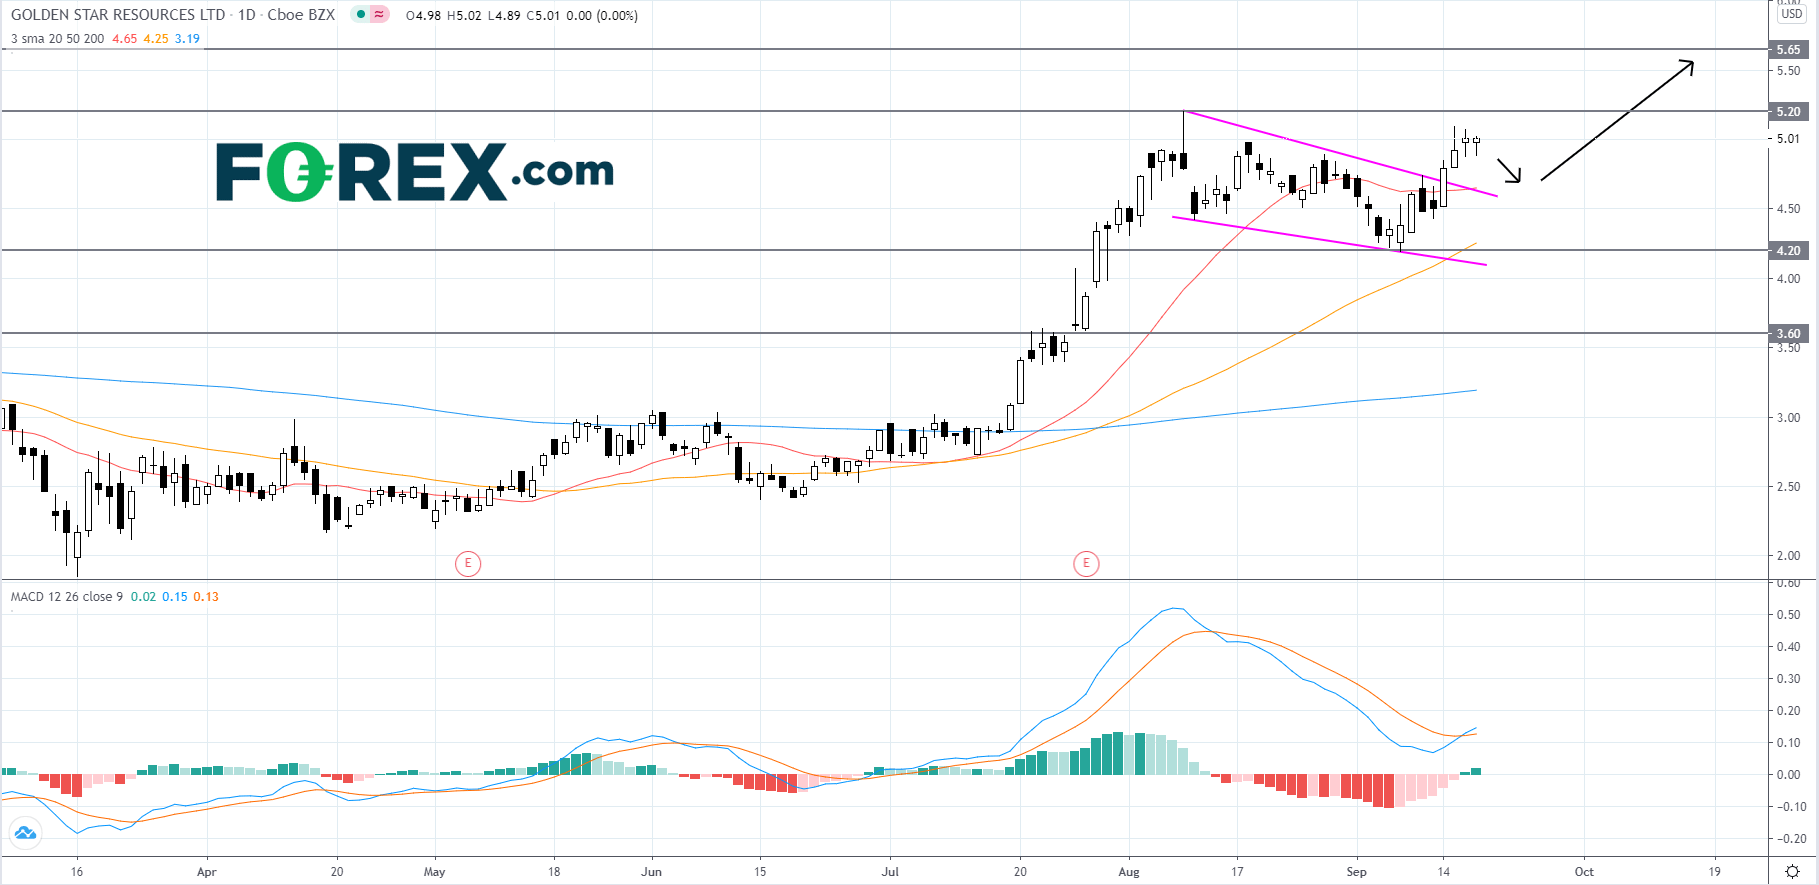
Golden Star Resources (GSS), a Canadian-based gold mining and exploration company, broke to the upside of a falling wedge pattern on Monday, September 14th. On September 16th, the MACD line crossed above the signal line, a bullish indicator. It appears that the majority of gold mining companies are showing similar patterns, which shows traders that there is positive sentiment in the precious metals sector. This is likely the result of U.S. markets showing signs of weakness in the past two weeks, as gold is viewed as a safe haven during poor market conditions.
Given the spinning top candle sticks in the last two days of trading, price action could be hinting that the breakout is stalling and bound for a throwback. Price will likely retrace to the upper trendline where is will probably find support and bounce to retest the 2020 high of 5.20. If 5.20 is penetrated, then price will likely grind higher to the 5.65 resistance level, a high last reached in mid-2016. If price ends up closing below the upper trendline it would be a troubling sign that could indicate that the pattern breakout was false. If that occurs price could slip back to the 4.20 support level, where a rebound may occur, but is less likely. If price breaks below the 4.20 support level it could slip further to 3.60.

Source: GAIN Capital, TradingView
Given the spinning top candle sticks in the last two days of trading, price action could be hinting that the breakout is stalling and bound for a throwback. Price will likely retrace to the upper trendline where is will probably find support and bounce to retest the 2020 high of 5.20. If 5.20 is penetrated, then price will likely grind higher to the 5.65 resistance level, a high last reached in mid-2016. If price ends up closing below the upper trendline it would be a troubling sign that could indicate that the pattern breakout was false. If that occurs price could slip back to the 4.20 support level, where a rebound may occur, but is less likely. If price breaks below the 4.20 support level it could slip further to 3.60.
Source: GAIN Capital, TradingView
Golden Star Resources (GSS), a Canadian-based gold mining and exploration company, broke to the upside of a falling wedge pattern on Monday, September 14th. On September 16th, the MACD line crossed above the signal line, a bullish indicator. It appears that the majority of gold mining companies are showing similar patterns, which shows traders that there is positive sentiment in the precious metals sector. This is likely the result of U.S. markets showing signs of weakness in the past two weeks, as gold is viewed as a safe haven during poor market conditions.
Given the spinning top candle sticks in the last two days of trading, price action could be hinting that the breakout is stalling and bound for a throwback. Price will likely retrace to the upper trendline where is will probably find support and bounce to retest the 2020 high of 5.20. If 5.20 is penetrated, then price will likely grind higher to the 5.65 resistance level, a high last reached in mid-2016. If price ends up closing below the upper trendline it would be a troubling sign that could indicate that the pattern breakout was false. If that occurs price could slip back to the 4.20 support level, where a rebound may occur, but is less likely. If price breaks below the 4.20 support level it could slip further to 3.60.
Source: GAIN Capital, TradingView
Given the spinning top candle sticks in the last two days of trading, price action could be hinting that the breakout is stalling and bound for a throwback. Price will likely retrace to the upper trendline where is will probably find support and bounce to retest the 2020 high of 5.20. If 5.20 is penetrated, then price will likely grind higher to the 5.65 resistance level, a high last reached in mid-2016. If price ends up closing below the upper trendline it would be a troubling sign that could indicate that the pattern breakout was false. If that occurs price could slip back to the 4.20 support level, where a rebound may occur, but is less likely. If price breaks below the 4.20 support level it could slip further to 3.60.
Source: GAIN Capital, TradingView
Related tags:
Latest market news




Open an account in minutes
Experience award-winning platforms with fast and secure execution, and enjoy tight spreads from 0.5 pts on FX and 0.3 pts on indices.
Economic calendar
Web Trader platform
Our sophisticated web-based platform is packed with features.
Related articles
Euro Technical Forecast: EUR/USD Snaps Five-Week Slide at Critical Support 10 17 2026
Euro is attempting to regain its footing as stretched momentum raises the stakes for the next move ahead of key PMI data and central bank decisions.

Gold weekly outlook: XAU/USD remains stuck between a rock and a hard place
Gold remains at risk of staging a deeper correction. Though the dollar has eased back a bit along with yields, both still remain fundamentally supported.

USD/JPY Weekly Outlook: Volatility Has Left the Building
The yen has ignored broad dollar weakness, falling Treasury yields and renewed market turbulence. Yet its relationship with US interest rates remains intact. So why is USD/JPY going absolutely nowhere fast?

This report is intended for general circulation only. It should not be construed as a recommendation, or an offer (or solicitation of an offer) to buy or sell any financial products. The information provided does not take into account your specific investment objectives, financial situation or particular needs. Before you act on any recommendation that may be contained in this report, independent advice ought to be sought from a financial adviser regarding the suitability of the investment product, taking into account your specific investment objectives, financial situation or particular needs.
StoneX Financial Pte. Ltd., may distribute reports produced by its respective foreign entities or affiliates within the StoneX group of companies or third parties pursuant to an arrangement under Regulation 32C of the Financial Advisers Regulations. Where the report is distributed to a person in Singapore who is not an accredited investor, expert investor or an institutional investor (as defined in the Securities Futures Act), StoneX Financial Pte. Ltd. accepts legal responsibility to such persons for the contents of the report only to the extent required by law. Singapore recipients should contact StoneX Financial Pte. Ltd. at 6826 9988 for matters arising from, or in connection with the report.
In the case of all other recipients of this report, to the extent permitted by applicable laws and regulations neither StoneX Financial Pte. Ltd. nor its associated companies will be responsible or liable for any loss or damage incurred arising out of, or in connection with, any use of the information contained in this report and all such liability is hereby expressly disclaimed. No representation or warranty is made, express or implied, that the content of this report is complete or accurate.
StoneX Financial Pte. Ltd. is not under any obligation to update this report.
Trading CFDs carries a high level of risk that may not be suitable for some investors. Consider your investment objectives, level of experience, financial resources, risk appetite and other relevant circumstances carefully. The possibility exists that you could lose some or all of your investments, including your initial deposits. If in doubt, please seek independent expert advice. Visit www.forex.com/en-sg/terms-and-policies for the complete Risk Disclosure Statement.