


S&P 500 Pulls Back From Another Fresh ATH As Yields Soften
Both the S&P and Nasdaq set fresh ATHs on Wednesday, and despite relief in yields, stocks are pulling back again today.
Share this:

S&P 500 Talking Points:
- Stocks have continued to rally even as Treasury yields have continued to jump.
- Higher yields aren’t necessarily a deal-breaker for stocks, as higher levels of growth come with higher levels of inflation, and that erodes the rationale for holding debt. What is a bigger issue, however, is when yields are falling especially if that comes along with recessionary fears. A bull market in bonds can easily zap equity markets as capital flows from stocks to bonds.
- The bigger question is whether this is a ‘right now’ thing or a 2027/2028 theme.
To be sure, higher rates aren’t necessarily a stimulus for corporates. The more unfriendly backdrop does create greater competition for capital, which, in-turn, both erodes profitability and limits expansion potential.
The opposite is easier to digest as low rates make for a far more friendly backdrop, helping companies to borrow capital more cheaply which they can then use to build their businesses. Another effect of that is that lower rate environments make bonds a less attractive medium, and investors are then more incentivized to take on greater risk in an equity investment as opposed to buying a bond that might barely yield above inflation rates.
While these relationships are clear and obvious and even logical, the more confounding part is the in-between periods, because like many other aspects of market dynamics the regime change isn’t always perfect. And, often, there’s an awkward period where one side or the other is going against the grain.
And, realistically, higher yields aren’t necessarily a death-knell for stocks. If we’re in a higher growth backdrop, that will probably come along with higher levels of inflation. And while the common relationship there is higher levels of inflation bringing rate hikes, more reasonably, it’s what actual markets are doing rather than central banks as holding long-term debt makes less sense in a higher inflation backdrop. That leads to greater supply at current rates, and greater supply and lower prices then means higher yields.
It’s easy to look back at this historically and assume the Fed’s function is the big connection point but the reality is it is probably more of a byproduct than anything. And, like we saw in the year 2000, it can fast become problematic. But this is yet another factor that has an inconsistent impact on market behaviors as it just depends on a litany of other factors.
We’re at one of those awkward periods right now as bond yields have continued to jump and, at this point, stocks seem to not care all too much. We have fresh multi-decade highs across the long end of the Treasury curve and both the Nasdaq and S&P 500 set fresh all-time-highs just two days ago. This seems to confound many headline writers as the less friendly corporate backdrop seemingly should make for a less friendly equity market. But, the reality is they’re two entirely different things.
In the Q4 forecasts I looked at a melt up scenario for both indices and I think that holds as we go into the end of the year. To be sure, as I’ve been writing for years now, I do think there is an AI bubble. The parallels to the dot com bubble are quite glaring, even if the sample size is just one. But, like the tech bubble, knowledge of there being a bubble doesn’t necessarily mean that you can perfectly time its popping. And that is where we are at today.
Q4 Forecast for Equities
This content was created by an affiliate of FOREX.com and represents the views and opinions of the author/speakers, not the views and opinions of Forex.com, StoneX Group Inc., or its subsidiaries. The content has not been independently reviewed by FOREX.com.
S&P 500 The Road Ahead
The rally on Wednesday fell just short of the 7900 level and when a psychological level of that nature almost comes into play, it paints a picture that the market was overweight with longs and buyer trepidation took over before a test of the big figure. It also paints a picture that’s more of a pullback rather than a reversal, but it’s how the week finishes that will matter as an extended upper wick on a closed weekly bar does not bode well for near-term bullish continuation.
But, at this point, there’s a big level of prior resistance in play at 7782.50, and the 8k level overhead is probably the bigger item as we trade deeper into Q4.
S&P 500 Daily Price Chart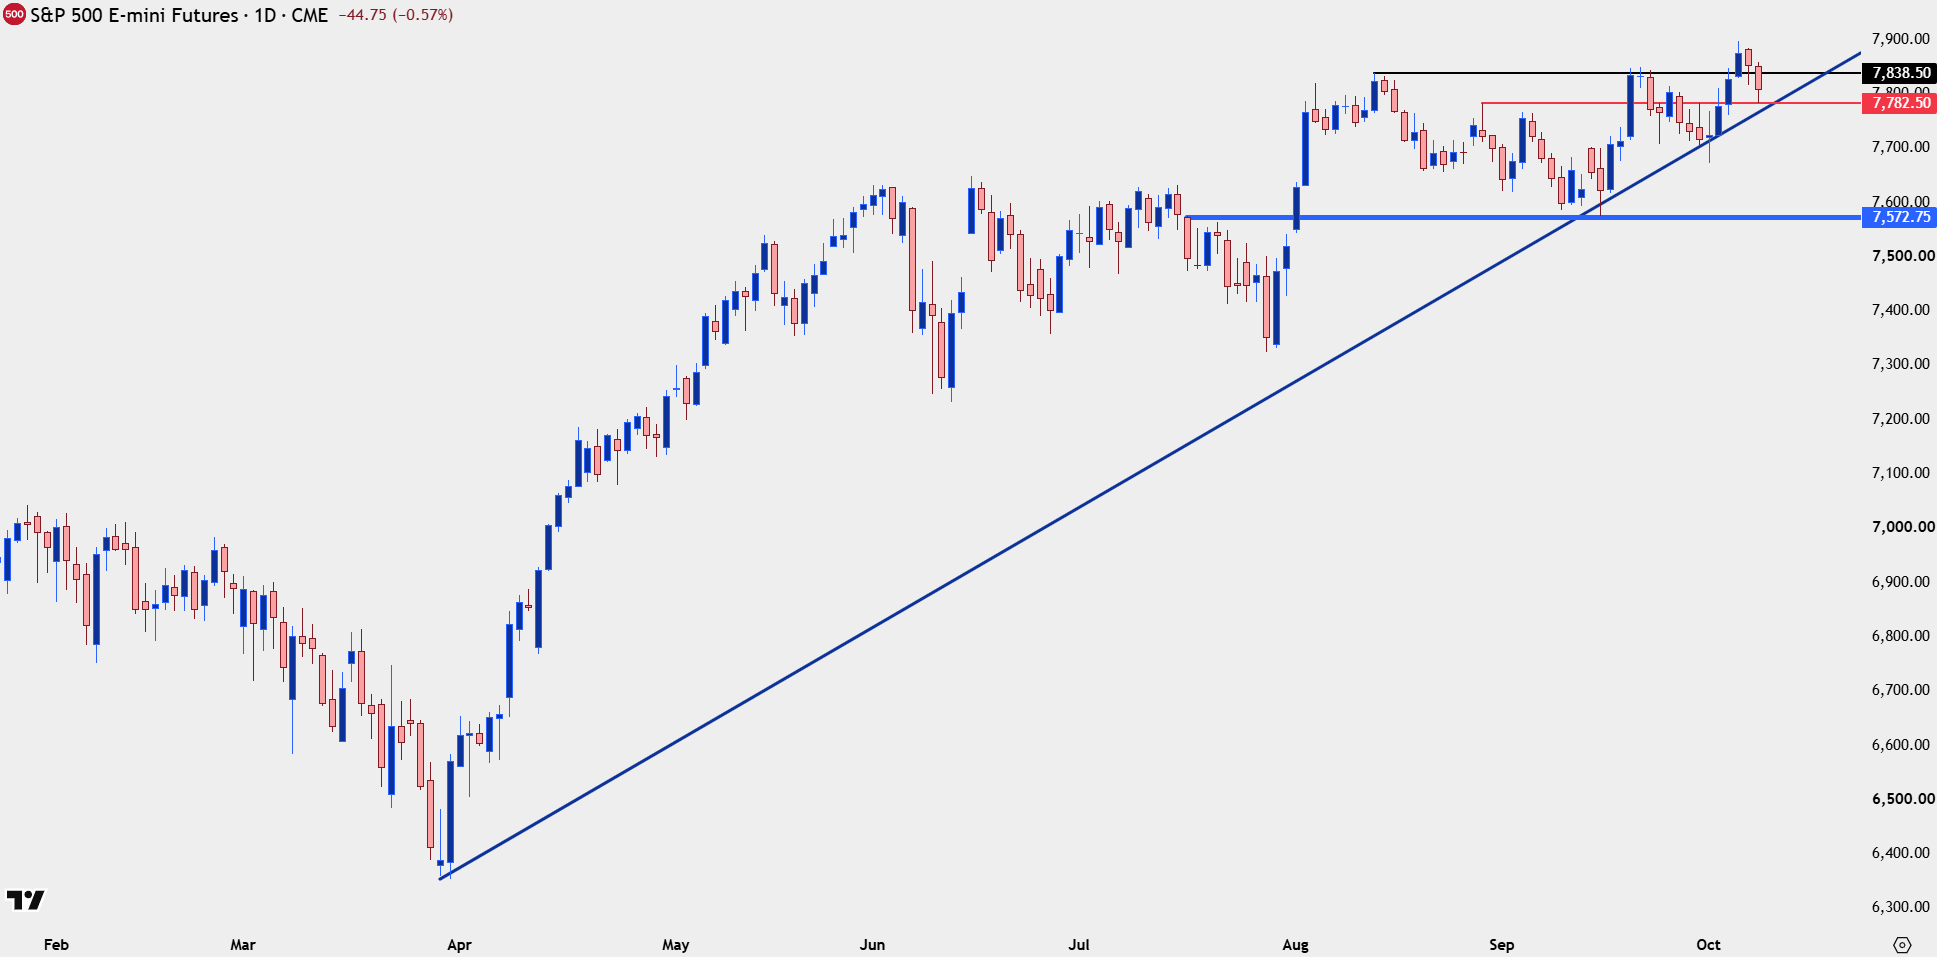
Chart prepared by James Stanley; data derived from Tradingview
S&P 500 Shorter-Term
From the shorter-term look there’s a similar structure in place given the drawdown from the Wednesday highs, and that takes on the form of a bull flag. There was another of those set up into last Friday, which led into the breakout that eventually drove to a fresh ATH this week.
Regarding levels from this structure: Key resistance is the 7838-7848 zone which was resistance in September and then again last week. Bulls still haven’t gained acceptance above this zone so it remains a significant spot on the chart. A closed body break of that zone also illustrates bull flag breakouts and bullish continuation scenarios.
As of this writing, price is testing another key zone spanning from 7798-7808, as this was prior resistance and currently is being tested as support. Below that, it’s the 7782 level that stands out, followed by the zone from 7761-7766. A break of that opens the door for a re-test of 7716-7724.
S&P 500 30-Minute Chart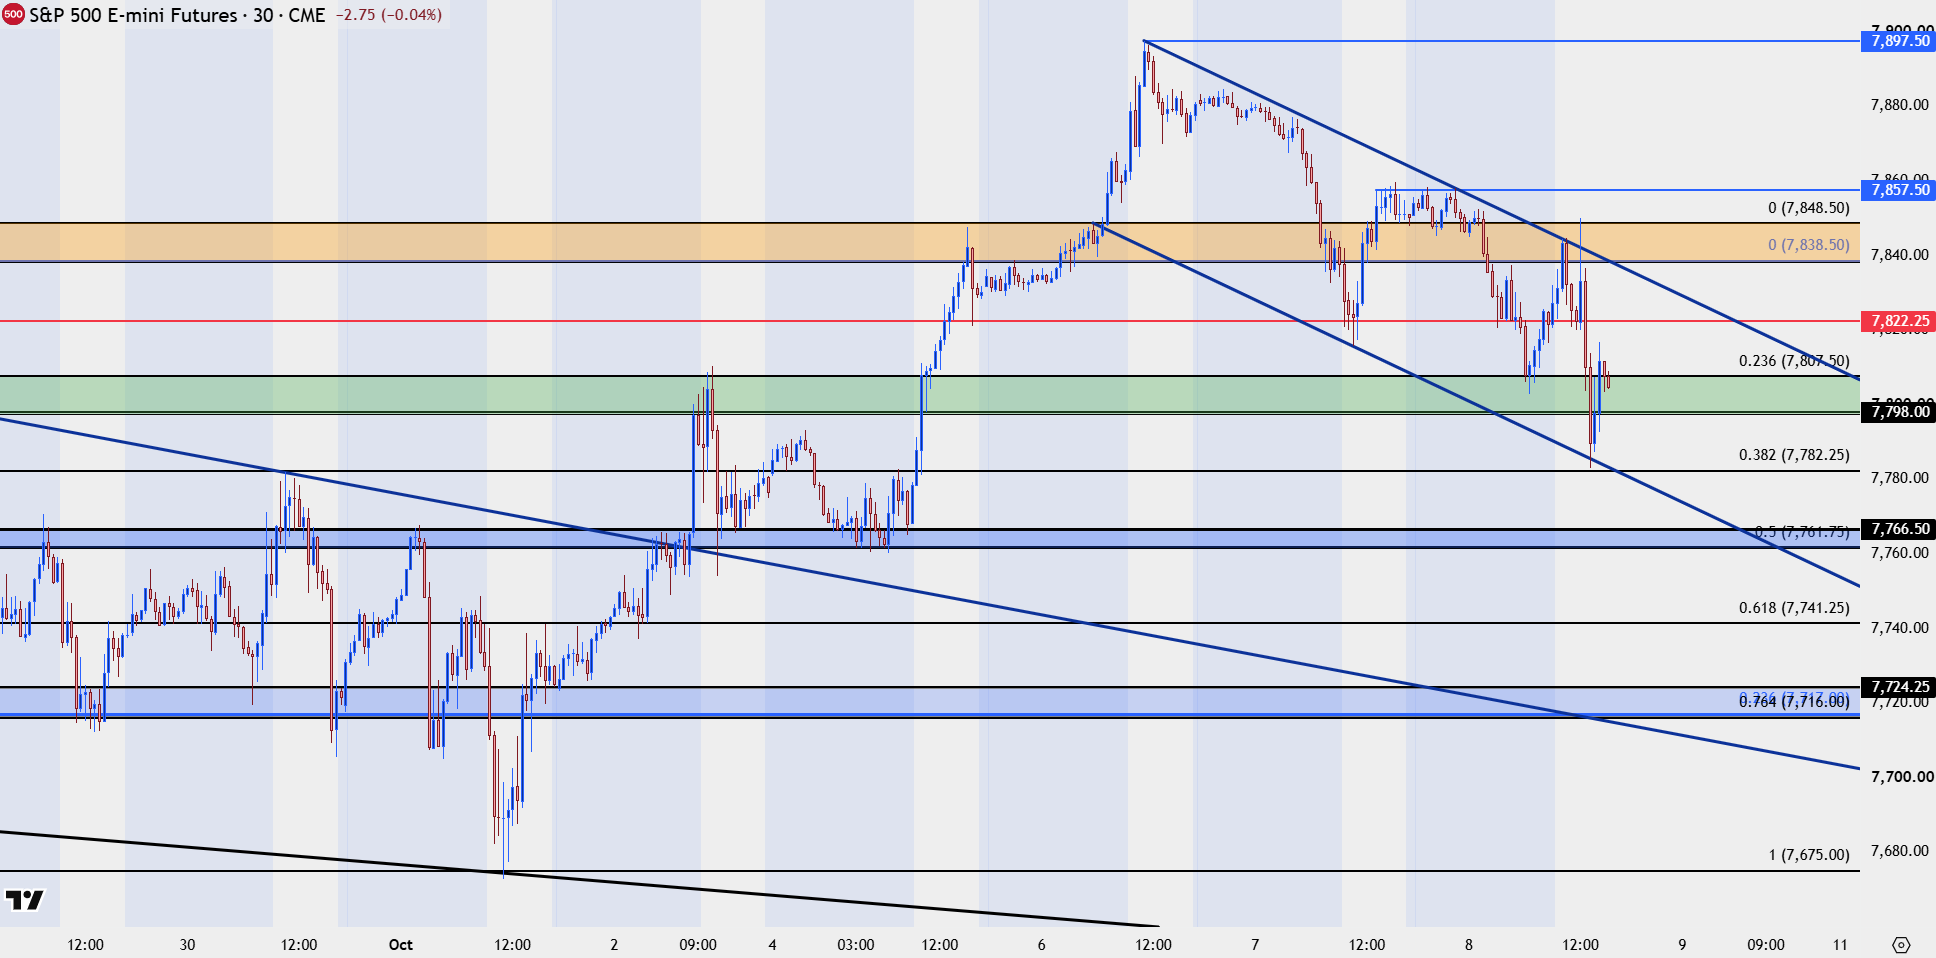
Chart prepared by James Stanley; data derived from Tradingview
--- written by James Stanley, Senior Market Analyst, Global Macro
Related tags:
Latest market news




Open an account in minutes
Experience award-winning platforms with fast and secure execution, and enjoy tight spreads from 0.5 pts on FX and 0.3 pts on indices.
Economic calendar
Web Trader platform
Our sophisticated web-based platform is packed with features.
Related articles
S&P 500 Pulls Back From Another Fresh ATH As Yields Soften
Both the S&P and Nasdaq set fresh ATHs on Wednesday, and despite relief in yields, stocks are pulling back again today.
Gold Bounces From Lows But Are Brighter Days Ahead?
Gold put in a sizable underside wick on the daily chart yesterday and this speaks to the possibility of near-term bottoming in the metal following a strong sell-off over the past six weeks.

EUR/USD Tests Most Oversold Levels in a Decade
It’s been a painful run for EUR/USD as the pair has lost more than 500 pips in a month and a half, but with the pair now deeply oversold the big question is whether sellers can stretch.
This report is intended for general circulation only. It should not be construed as a recommendation, or an offer (or solicitation of an offer) to buy or sell any financial products. The information provided does not take into account your specific investment objectives, financial situation or particular needs. Before you act on any recommendation that may be contained in this report, independent advice ought to be sought from a financial adviser regarding the suitability of the investment product, taking into account your specific investment objectives, financial situation or particular needs.
StoneX Financial Pte. Ltd., may distribute reports produced by its respective foreign entities or affiliates within the StoneX group of companies or third parties pursuant to an arrangement under Regulation 32C of the Financial Advisers Regulations. Where the report is distributed to a person in Singapore who is not an accredited investor, expert investor or an institutional investor (as defined in the Securities Futures Act), StoneX Financial Pte. Ltd. accepts legal responsibility to such persons for the contents of the report only to the extent required by law. Singapore recipients should contact StoneX Financial Pte. Ltd. at 6826 9988 for matters arising from, or in connection with the report.
In the case of all other recipients of this report, to the extent permitted by applicable laws and regulations neither StoneX Financial Pte. Ltd. nor its associated companies will be responsible or liable for any loss or damage incurred arising out of, or in connection with, any use of the information contained in this report and all such liability is hereby expressly disclaimed. No representation or warranty is made, express or implied, that the content of this report is complete or accurate.
StoneX Financial Pte. Ltd. is not under any obligation to update this report.
Trading CFDs carries a high level of risk that may not be suitable for some investors. Consider your investment objectives, level of experience, financial resources, risk appetite and other relevant circumstances carefully. The possibility exists that you could lose some or all of your investments, including your initial deposits. If in doubt, please seek independent expert advice. Visit www.forex.com/en-sg/terms-and-policies for the complete Risk Disclosure Statement.