






S&P 500 Technical Analysis: Sharp SPX Sell Off Runs into Support
Stocks took a hit over the past two weeks, but support has started to show at a familiar spot, the same that led to a sharp reversal earlier in the year.
Share this:

S&P 500 Talking Points:
- The S&P 500 is now down for the year of 2025 and has threatened to erase the gains from the day of the election in November of last year.
- Yesterday saw bulls show up to defend the 200-day moving average, and a wide underside wick remains on the daily chart, keeping the door open for bounces. If this zone doesn’t hold, however, there’s a couple of additional spots to look for support to play, as I had highlighted in the 2025 forecast for indices.
- The test of the election gap led to a strong bounce up to a fresh ATH earlier in the year, and that election gap is back in the picture to go along with the 200-dma.
- To get the 2025 equities forecast, the link below will allow for registration.
My top trade idea for this year was the long side of U.S. equities, but only after a pullback. The rationale being that still-too-high inflation combined with the incoming Trump administration, and his penchant for demanding attention, could allow for a volatile backdrop for stocks. But, also given his tendency to point to equity performance as a barometer of his administration’s success, it seemed unlikely that he would allow stocks to put in a full reversal, as there was ample opportunity for the incoming President to use hope and commentary to drive buyers back into stocks.
We’ve seen that play out to a degree so far this year. While trends haven’t lasted for long, intra-day volatility has been exceptional, with multiple trips to both support and resistance.
The first support zone that I had highlighted in both that top trade idea article as well as the 2025 forecast was the election gap in SPX. That came into play in the first couple weeks of the New Year, and once the gap had filled, bulls took back-over, eventually driving to a fresh all-time-high.
That all-time-high printed at an interesting spot, as 6145 is the 100% extension of the 2022 sell-off in SPX. The 61.8% extension of that move had similarly set resistance back in July and then again in August before bulls were eventually able to drive a breakout. And, so far, that Fibonacci extension at 6145 is what’s marked the top in SPX for this year.
Notably, there was another area of support that came into play yesterday as the 200-day moving average was vigorously defended by bulls as it had come into the picture for the first time since November of 2023.
SPX Weekly Price Chart
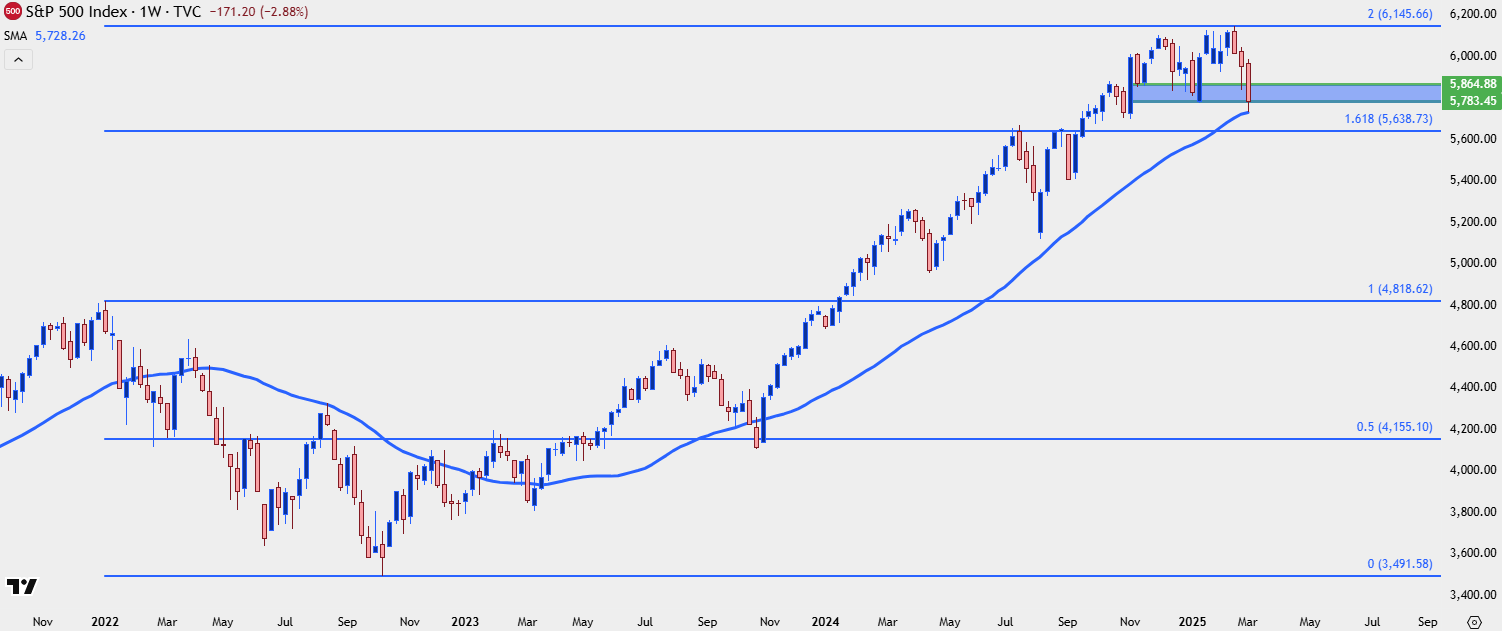 Chart prepared by James Stanley; data derived from Tradingview
SPX Swings and Support
Predicting turns is notoriously difficult in markets, but what makes it attractive is the prospect of asymmetry, or the potential to risk a smaller amount to produce a larger gain. This is why support and resistance are so important in trading, those are the areas where asymmetry can be possible, particularly if the levels hold.
With a Trump administration there’s another form of drive or volatility in markets and it's seemingly far more subjective than what would traditionally be driving capital flows. It can be as simple as a social media comment or a remark to a reporter, but of late, hints around tariffs have had an incredible impact on market moves and that’s something that I think can continue.
But, with that said, it also seems unlikely that Trump or his representatives would be too aggressive after a threatening move in stocks; and as we saw or heard yesterday, with Trump’s Commerce Secretary of Howard Lutnick highlighting that a compromise could be met with Canada and Mexico, there’s the possibility of bullish catalysts after sell-offs or pullbacks.
Again, this isn’t too dismiss the possibility of a continued turn or another extension in the sell-off, or to say that Trump or his team won’t continue to drive the tariff topic. But, at this point SPX is testing at a big spot of support and that keeps the door open for bullish swing potential.
The 200-dma is an obvious point of reference but also of interest in SPX is the prior election gap, which had previously helped to hold the lows before leading to a big bounce earlier in the year. From the daily chart below, you can see where today’s daily candle is holding right around the bottom of that prior gap, with respect to the swing-low from yesterday around the 200-dma.
SPX Daily Chart
Chart prepared by James Stanley; data derived from Tradingview
SPX Bigger Picture
If this support does not hold, there’s more support just below. I had referenced the 61.8% extension of the 2022 sell-off move a little earlier, and that was resistance on two separate occasions but, as yet, hasn’t been tested as support. That level plots at 5638 and I’ve spanned it up to the swing high of 5670 to create a zone.
And below that, I’m tracking a third zone of support from 5340-5402, which was resistance in the first-half of last year before becoming support in September, leading to the strong rally that eventually set a fresh ATH.
SPX Weekly Price Chart
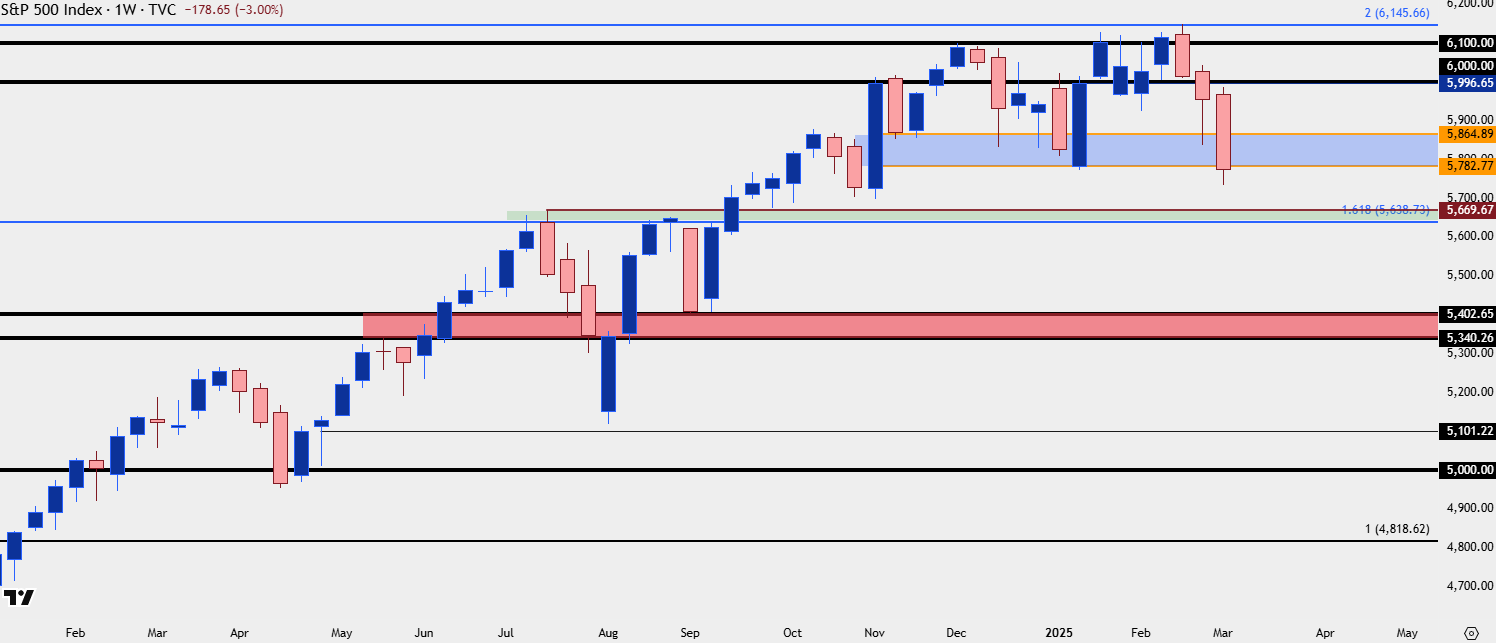
Chart prepared by James Stanley; data derived from Tradingview
--- written by James Stanley, Senior Strategist
S&P 500 Talking Points:
- The S&P 500 is now down for the year of 2025 and has threatened to erase the gains from the day of the election in November of last year.
- Yesterday saw bulls show up to defend the 200-day moving average, and a wide underside wick remains on the daily chart, keeping the door open for bounces. If this zone doesn’t hold, however, there’s a couple of additional spots to look for support to play, as I had highlighted in the 2025 forecast for indices.
- The test of the election gap led to a strong bounce up to a fresh ATH earlier in the year, and that election gap is back in the picture to go along with the 200-dma.
- To get the 2025 equities forecast, the link below will allow for registration.
My top trade idea for this year was the long side of U.S. equities, but only after a pullback. The rationale being that still-too-high inflation combined with the incoming Trump administration, and his penchant for demanding attention, could allow for a volatile backdrop for stocks. But, also given his tendency to point to equity performance as a barometer of his administration’s success, it seemed unlikely that he would allow stocks to put in a full reversal, as there was ample opportunity for the incoming President to use hope and commentary to drive buyers back into stocks.
We’ve seen that play out to a degree so far this year. While trends haven’t lasted for long, intra-day volatility has been exceptional, with multiple trips to both support and resistance.
The first support zone that I had highlighted in both that top trade idea article as well as the 2025 forecast was the election gap in SPX. That came into play in the first couple weeks of the New Year, and once the gap had filled, bulls took back-over, eventually driving to a fresh all-time-high.
That all-time-high printed at an interesting spot, as 6145 is the 100% extension of the 2022 sell-off in SPX. The 61.8% extension of that move had similarly set resistance back in July and then again in August before bulls were eventually able to drive a breakout. And, so far, that Fibonacci extension at 6145 is what’s marked the top in SPX for this year.
Notably, there was another area of support that came into play yesterday as the 200-day moving average was vigorously defended by bulls as it had come into the picture for the first time since November of 2023.
SPX Weekly Price Chart
Chart prepared by James Stanley; data derived from Tradingview
SPX Swings and Support
Predicting turns is notoriously difficult in markets, but what makes it attractive is the prospect of asymmetry, or the potential to risk a small amount to produce a larger gain. This is why support and resistance are so important in trading, those are the areas where asymmetry can be possible, particularly if the levels hold.
With a Trump administration there’s another form of drive or volatility in markets and it seemingly far more subjective than what would traditionally be driving capital flows. It can be as simple as a social media comment or a remark to a reporter, but of late, hints around tariffs have had an incredible impact on market moves and that’s something that I think can continue.
But, with that said, it also seems unlikely that Trump or his representatives would be too aggressive after a threatening move in stocks; and as we saw or heard yesterday, with Trump’s Commerce Secretary of Howard Lutnick highlighting that a compromise could be met with Canada and Mexico, there’s the possibility of a bullish catalyst around-the-corner.
Again, this isn’t too dismiss the possibility of a continued turn or another extension in the sell-off, or to say that Trump or his team won’t continue to drive the tariff topic. But, at this point SPX is holding at a big spot of support and that keeps the door open for bullish swing potential.
The 200-dma is an obvious point of reference but also of interest in SPX is the prior election gap, which had previously helped to hold the lows before leading to a big bounce earlier in the year. From the daily chart below, you can see where today’s daily candle is holding right around the bottom of that prior gap, with respect to the swing-low from yesterday around the 200-dma.
SPX Daily Chart
Chart prepared by James Stanley; data derived from Tradingview
SPX Bigger Picture
If this support does not hold, there’s more support just below. I had referenced the 61.8% extension of the 2022 sell-off move a little earlier, and that was resistance on two separate occasions but, as yet, hasn’t been tested as support. That level plots at 5638 and I’ve spanned it up to the swing high of 5670 to create a zone.
And below that, I’m tracking a third zone of support from 5340-5402, which was resistance in the first-half of last year before becoming support in September, leading to the strong rally that eventually set a fresh ATH.
SPX Weekly Price Chart
Chart prepared by James Stanley; data derived from Tradingview
--- written by James Stanley, Senior Strategist
Related tags:
Latest market news




Open an account in minutes
Experience award-winning platforms with fast and secure execution, and enjoy tight spreads from 0.5 pts on FX and 0.3 pts on indices.
Economic calendar
Web Trader platform
Our sophisticated web-based platform is packed with features.
Related articles

Oil Quietly Hands the Fed a Reason to Stay Hawkish
Oil prices and the U.S. dollar are both on the front foot as elevated energy costs feed Fed warnings that inflation may prove sticky.


S&P 500 forecast: Stocks extend drop as correction risks grow
US and global equity markets have extended Wednesday’s sell-off, with Wall Street opening lower after a weak handover from Asia and Europe. The deterioration in risk appetite has been spreading across global markets. The dollar was firmer, Treasury yields were holding onto yesterday’s gains, while gold, silver and bitcoin were all under pressure alongside equities and major currencies.

Gold forecast: XAU/USD could take a larger dive after the big rise in yields
Gold prices have been falling in the last few days after last week’s post-FOMC pop faded amid rising interest rate expectations, higher oil prices and a strengthening US dollar. As before, I wasn’t convinced gold would thrive in the current macro backdrop.
This report is intended for general circulation only. It should not be construed as a recommendation, or an offer (or solicitation of an offer) to buy or sell any financial products. The information provided does not take into account your specific investment objectives, financial situation or particular needs. Before you act on any recommendation that may be contained in this report, independent advice ought to be sought from a financial adviser regarding the suitability of the investment product, taking into account your specific investment objectives, financial situation or particular needs.
StoneX Financial Pte. Ltd., may distribute reports produced by its respective foreign entities or affiliates within the StoneX group of companies or third parties pursuant to an arrangement under Regulation 32C of the Financial Advisers Regulations. Where the report is distributed to a person in Singapore who is not an accredited investor, expert investor or an institutional investor (as defined in the Securities Futures Act), StoneX Financial Pte. Ltd. accepts legal responsibility to such persons for the contents of the report only to the extent required by law. Singapore recipients should contact StoneX Financial Pte. Ltd. at 6826 9988 for matters arising from, or in connection with the report.
In the case of all other recipients of this report, to the extent permitted by applicable laws and regulations neither StoneX Financial Pte. Ltd. nor its associated companies will be responsible or liable for any loss or damage incurred arising out of, or in connection with, any use of the information contained in this report and all such liability is hereby expressly disclaimed. No representation or warranty is made, express or implied, that the content of this report is complete or accurate.
StoneX Financial Pte. Ltd. is not under any obligation to update this report.
Trading CFDs carries a high level of risk that may not be suitable for some investors. Consider your investment objectives, level of experience, financial resources, risk appetite and other relevant circumstances carefully. The possibility exists that you could lose some or all of your investments, including your initial deposits. If in doubt, please seek independent expert advice. Visit www.forex.com/en-sg/terms-and-policies for the complete Risk Disclosure Statement.