



The US Dollar Index (DXY): How much higher can it go?
There are plenty of reasons the DXY can continue higher, whether it’s a flight to safety, higher inflation, or for technical reasons.
Share this:

On February 11th, the US announced that Russia could invade Ukraine any day. Since then, the US Dollar Index has moved from a low on February 11th of 95.64 to a high today of 99.42, a move of nearly 4% in less than a month. The US Dollar, the Japanese Yen, and gold are a few examples of safe haven assets that investors buy when risk moves lower. The markets hate uncertainty. Therefore, with the uncertainty surrounding the onset of the Russia/Ukraine conflict, stocks began moving lower and sentiment moved from “risk-on” towards “risk-off”. Flows began moving into the DXY.
However, war isn’t the only reason that the DXY is moving higher. It is also moving higher due to inflation and interest rate expectations. The higher the inflation, the higher the cost of money and the greater the expectation that the Federal Reserve will hike interest rates. The US releases February CPI (Consumer Price Index, a key measure of inflation) on Thursday. Expectations are for a reading of 7.9% YoY for February. If this print is “as expected”, it would mean that prices have risen nearly 8% from one year ago. Fed Chairman Powell has already said that the FOMC will hike rates on March 16th. However, investors expect more to come, thus pushing the price of DXY higher.
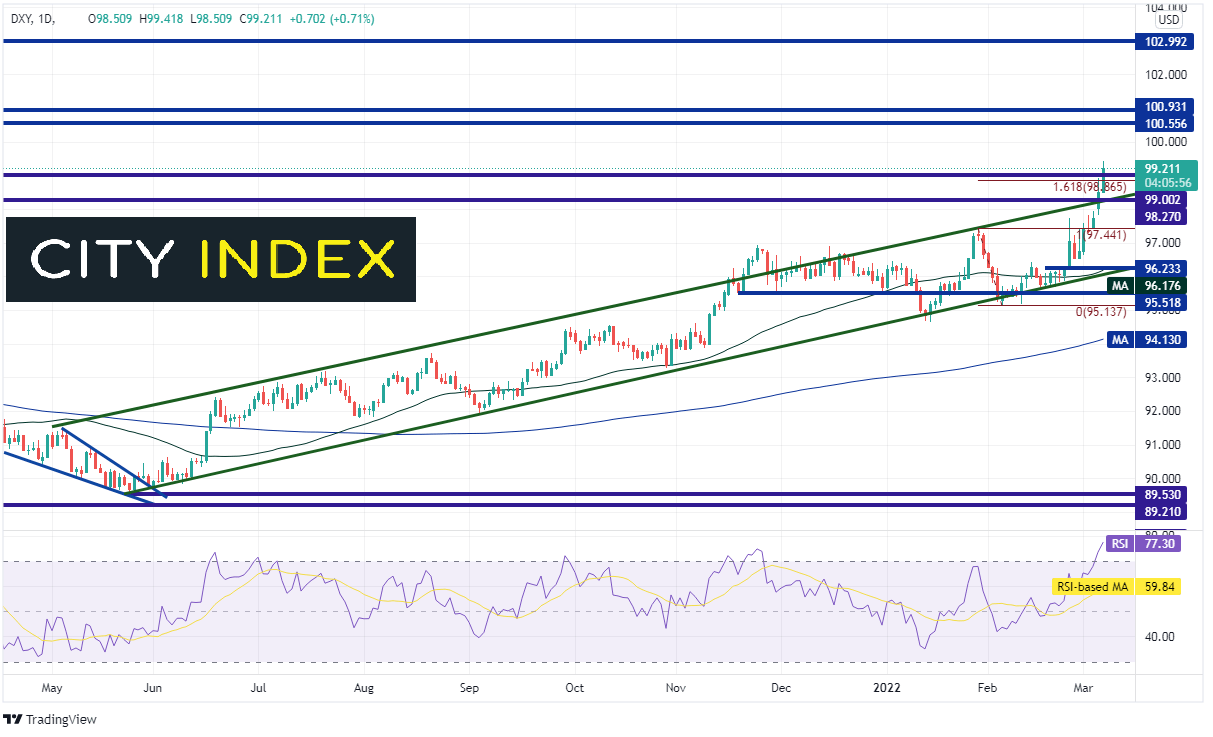
The US Dollar Index has been moving higher since May 2021 in an orderly channel. The index briefly traded above the top trendline of the channel in late November to 96.94, only to move back inside channel. When price fails to break above one side of a channel, it often moves to test the other side of the channel. Indeed, price moved back inside the channel and tested the bottom trendline in January, near 94.66. Since then, price continued higher. On Friday, the DXY closed back above the top trendline of the channel and above horizontal resistance. Today, it continued higher, breaking through additional horizontal resistance, as well as the 161.8% Fibonacci extension from the high of January 28th to the low of February 4th near 98.87. If price is to continue higher, if must pass through the psychological round number resistance level at 100.00, horizontal resistance at 100.87, and the March 2020 highs of 102.99. However, notice the RSI is in overbought territory, indication the DXY may be ready for a pullback.

Source: Tradingview, Stone X
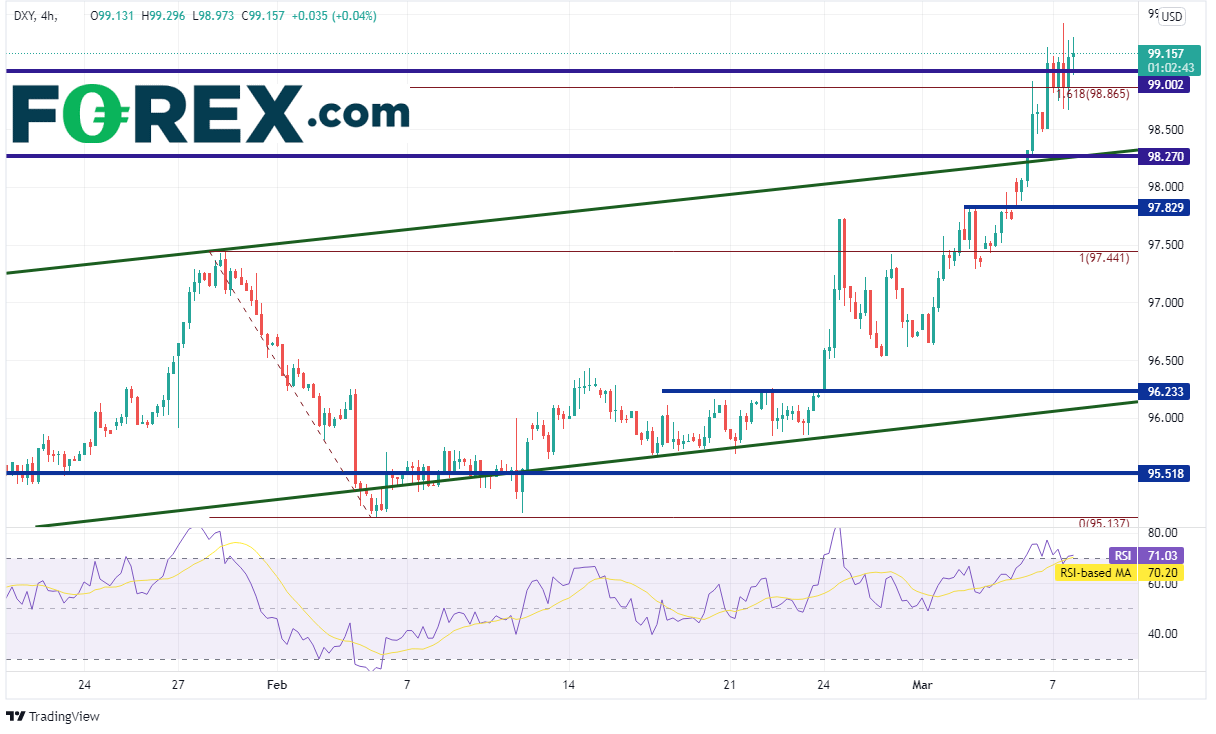
On a 240-minute timeframe, near-term support levels come into play. The first support is the top trendline of the long-term channel (green) and horizontal support near 98.27. Below there is horizontal support near 97.82, then the January 28th highs at 97.44.
Source: Tradingview, Stone X
There are plenty of reasons the DXY can continue higher, whether it’s a flight to safety, higher inflation, or for technical reasons. However, traders need to watch the headlines. Any talks of a breakthrough in diplomacy which could lead to a ceasefire (or a lower than expected CPI on Thursday) could send the DXY lower.
On February 11th, the US announced that Russia could invade Ukraine any day. Since then, the US Dollar Index has moved from a low on February 11th of 95.64 to a high today of 99.42, a move of nearly 4% in less than a month. The US Dollar, the Japanese Yen, and gold are a few examples of safe haven assets that investors buy when risk moves lower. The markets hate uncertainty. Therefore, with the uncertainty surrounding the onset of the Russia/Ukraine conflict, stocks began moving lower and sentiment moved from “risk-on” towards “risk-off”. Flows began moving into the DXY.
However, war isn’t the only reason that the DXY is moving higher. It is also moving higher due to inflation and interest rate expectations. The higher the inflation, the higher the cost of money and the greater the expectation that the Federal Reserve will hike interest rates. The US releases February CPI (Consumer Price Index, a key measure of inflation) on Thursday. Expectations are for a reading of 7.9% YoY for February. If this print is “as expected”, it would mean that prices have risen nearly 8% from one year ago. Fed Chairman Powell has already said that the FOMC will hike rates on March 16th. However, investors expect more to come, thus pushing the price of DXY higher.
How do interest rates affect financial markets?
The US Dollar Index has been moving higher since May 2021 in an orderly channel. The index briefly traded above the top trendline of the channel in late November to 96.94, only to move back inside channel. When price fails to break above one side of a channel, it often moves to test the other side of the channel. Indeed, price moved back inside the channel and tested the bottom trendline in January, near 94.66. Since then, price continued higher. On Friday, the DXY closed back above the top trendline of the channel and above horizontal resistance. Today, it continued higher, breaking through additional horizontal resistance, as well as the 161.8% Fibonacci extension from the high of January 28th to the low of February 4th near 98.87. If price is to continue higher, if must pass through the psychological round number resistance level at 100.00, horizontal resistance at 100.87, and the March 2020 highs of 102.99. However, notice the RSI is in overbought territory, indication the DXY may be ready for a pullback.
Source: Tradingview, Stone X
Trade the DXY now: Login or Open a new account!
• Open an account in the UK
• Open an account in Australia
• Open an account in Singapore
On a 240-minute timeframe, near-term support levels come into play. The first support is the top trendline of the long-term channel (green) and horizontal support near 98.27. Below there is horizontal support near 97.82, then the January 28th highs at 97.44.

Source: Tradingview, Stone X
There are plenty of reasons the DXY can continue higher, whether it’s a flight to safety, higher inflation, or for technical reasons. However, traders need to watch the headlines. Any talks of a breakthrough in diplomacy which could lead to a ceasefire (or a lower than expected CPI on Thursday) could send the DXY lower.
Learn more about forex trading opportunities.
Related tags:
Latest market news




Open an account in minutes
Experience award-winning platforms with fast and secure execution, and enjoy tight spreads from 0.5 pts on FX and 0.3 pts on indices.
Economic calendar
Web Trader platform
Our sophisticated web-based platform is packed with features.
Related articles
Canadian Dollar Analysis: USD/CAD Returns to July Highs Ahead of NFP
The Canadian dollar continues to face one of its most challenging environments in recent months when it comes to maintaining strength against the U.S. dollar. The weakness of the Canadian currency is clearly reflected in USD/CAD, which has now recorded nine consecutive bullish sessions and gained more than 1.7% during that period.
US Dollar Technical Outlook: DXY Bulls Meet Resistance at Yearly Highs 10 1 2026
The U.S. Dollar has held firm despite fading Fed hike bets, but Friday’s payrolls could test the rally’s staying power.


EUR/USD, GBP/USD Outlook: RSI Hits 2020 Oversold Levels
EUR/USD, GBP/USD Outlook: The EUR/USD daily RSI has fallen to oversold levels last seen in 2020, raising the risk of a reversal across correlated currency pairs, including the US dollar and GBP/USD.

This report is intended for general circulation only. It should not be construed as a recommendation, or an offer (or solicitation of an offer) to buy or sell any financial products. The information provided does not take into account your specific investment objectives, financial situation or particular needs. Before you act on any recommendation that may be contained in this report, independent advice ought to be sought from a financial adviser regarding the suitability of the investment product, taking into account your specific investment objectives, financial situation or particular needs.
StoneX Financial Pte. Ltd., may distribute reports produced by its respective foreign entities or affiliates within the StoneX group of companies or third parties pursuant to an arrangement under Regulation 32C of the Financial Advisers Regulations. Where the report is distributed to a person in Singapore who is not an accredited investor, expert investor or an institutional investor (as defined in the Securities Futures Act), StoneX Financial Pte. Ltd. accepts legal responsibility to such persons for the contents of the report only to the extent required by law. Singapore recipients should contact StoneX Financial Pte. Ltd. at 6826 9988 for matters arising from, or in connection with the report.
In the case of all other recipients of this report, to the extent permitted by applicable laws and regulations neither StoneX Financial Pte. Ltd. nor its associated companies will be responsible or liable for any loss or damage incurred arising out of, or in connection with, any use of the information contained in this report and all such liability is hereby expressly disclaimed. No representation or warranty is made, express or implied, that the content of this report is complete or accurate.
StoneX Financial Pte. Ltd. is not under any obligation to update this report.
Trading CFDs carries a high level of risk that may not be suitable for some investors. Consider your investment objectives, level of experience, financial resources, risk appetite and other relevant circumstances carefully. The possibility exists that you could lose some or all of your investments, including your initial deposits. If in doubt, please seek independent expert advice. Visit www.forex.com/en-sg/terms-and-policies for the complete Risk Disclosure Statement.