



US Jobs Outlook: Payroll Declines, Rising Wages Test USD, Fed Policy
Weak US payrolls and rising wages weigh on the dollar and complicate the Fed’s path to rate cuts.
Share this:

US payrolls are faltering while wage growth accelerates, leaving the US dollar and Federal Reserve policy at a crossroads. Traders will closely watch Friday’s jobs report to see whether labour market weakness and rising pay can coexist without derailing the Fed’s rate-cut plans.
View related analysis:
View related analysis:
US Jobs Market Outlook: Payroll Weakness and Wage Pressures in Focus
To say the last Nonfarm Payrolls (NFP) report caused a stir would be an understatement. Not only did it spark market volatility, but it also led to the head of the Bureau of Labor Statistics being dismissed within hours of the release.
President Trump accused the revised figures of being “rigged” in favour of Democrats, particularly after June’s NFP was slashed from 147k to just 14k. July’s headline print of 73k jobs, against expectations of 111k, did little to calm the storm.
Markets were quick to react, with the US dollar falling on renewed bets of Federal Reserve (Fed) cuts. EUR/USD and gold rallied 1.5% by the day’s close, AUD/USD was up 0.7%, while USD/JPY fell -2.2%.
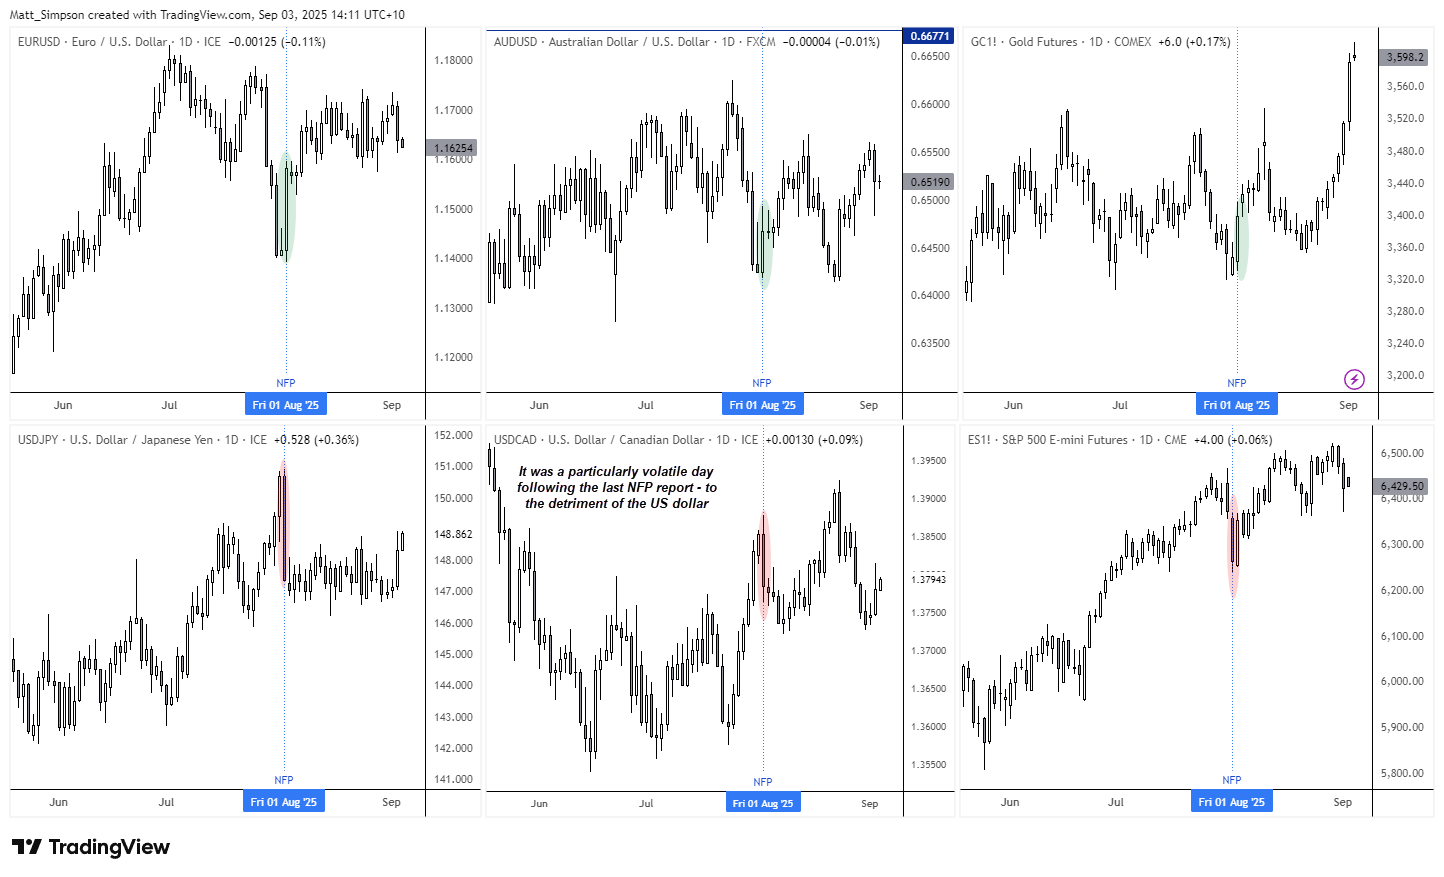
Chart prepared by Matt Simpson - data source: London Stock Exchange Group (LSEG)
Naturally, traders will be watching this Friday’s NFP closely to see whether July’s disappointment was an anomaly or the start of a more worrying trend. Looking through the data, however, I suspect we may need to brace for further weakness.
US job growth has been trending lower since its 2020 peak, making negative prints appear increasingly likely. In some ways, we’re already seeing cracks emerge. And that could favour another disappointing set of employment figures this week, which would no doubt fuel further calls from Trump for the Fed to cut rates and sink the US dollar.
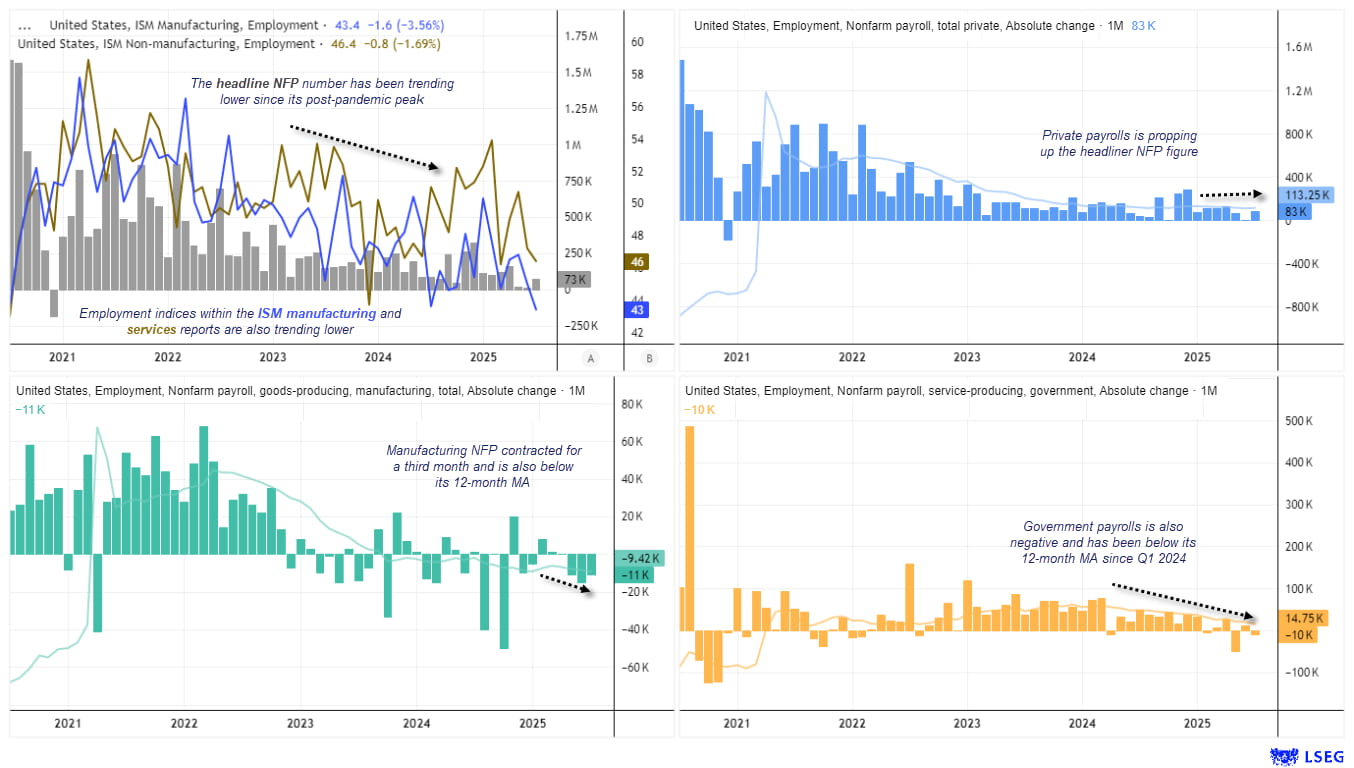
US Nonfarm Payrolls (NFP) trends show private payrolls propping up the headline figure, while manufacturing and government payrolls continue to weaken. Chart prepared by Matt Simpson - data source: Bureau of Labor Statistics (LBS), London Stock Exchange Group (LSEG).
- Manufacturing payrolls have contracted for three straight months, shedding a combined 36k jobs.
- Government payrolls dropped by 10k in July, 75k in May, and have tracked below their 12-month moving average since Q1 2024.
- Private payrolls remain the key support, adding 83k jobs in July compared to the headline 74k. Even so, they’ve been below their own 12-month moving average for three months and continue to trend lower alongside the headline figure.
- ISM manufacturing and services PMIs reinforce signs of labour market weakness, with both employment sub-indices trending lower. The manufacturing index has been in contraction, while services is steadily softening.
US Unemployment and Labour Participation
The unemployment rate remains historically low at 4.2%, but the participation rate has declined for three consecutive months to a 31-month low. With job growth barely positive and close to contraction, a rise in unemployment towards 5% by early next year seems increasingly likely. Such a shift could cap the recent uptick in wage growth, though the Federal Reserve will have noted its upward turn.
Wage Growth and Inflation Implications
While the US labour market is showing signs of fatigue, wage growth has begun to turn higher again, rising 3.9% year-on-year. That may not sound alarming in isolation, but with participation falling and unemployment edging higher, it creates an uneven backdrop for policymakers.
For the Federal Reserve, a sustained pickup in wages would complicate the path to rate cuts. Inflationary pressures could remain sticky even as the jobs market weakens, forcing the Fed to balance rising slack in employment with the risk of renewed price growth.
For traders, this means Friday’s NFP report isn’t just about the headline jobs number — the wage growth component may prove equally market-moving. A hotter-than-expected print could lift US yields and the dollar in the short term, while a miss would reinforce expectations for earlier Fed easing.
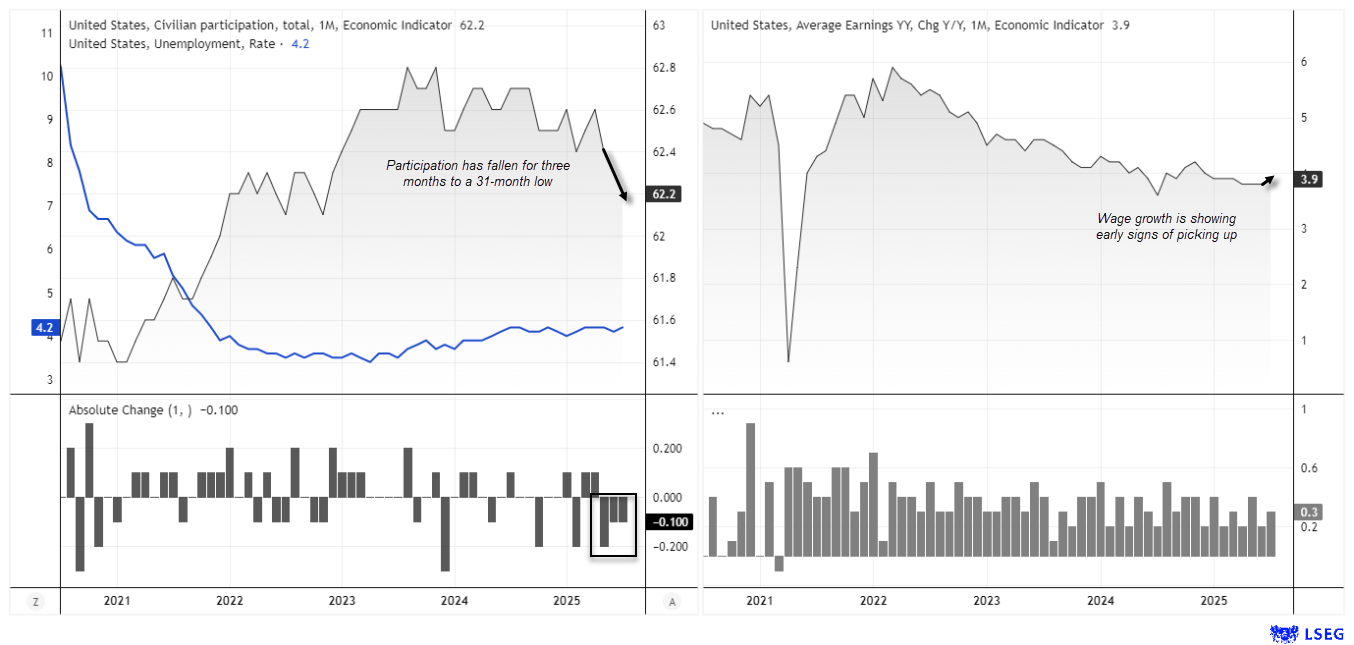
US unemployment rate steady at 4.2% while labour force participation falls to a 31-month low. Wage growth shows early signs of picking up. Source: LSEG
U6 Unemployment – Gauging Hidden Labour Market Slack
For a broader look at unemployment in the US, economists and the Fed often consider U6 unemployment. This includes the official unemployment rate (U3), plus:
- Marginally attached workers (want a job but are not actively searching)
- Discouraged workers (have stopped looking due to lack of perceived opportunities)
- Involuntary part-time workers (seeking full-time work but stuck in part-time roles)

US labour market slack is widening, with the U6–U3 spread rising as underemployment climbs, though not yet at recessionary levels. Chart prepared by Matt Simpson - data source: Bureau of Labor Statistics (LBS), London Stock Exchange Group (LSEG)
Because of these additions, U6 is always higher than U3, but the spread between them can highlight labour market slack that headline unemployment misses.
- U6 unemployment has trended higher since July 2023 and now sits at 7.9%, close to its highest since June 2021.
- This is above its 7.3% average since the December 2022 post-pandemic trough.
- However, it remains well below its long-term average of 10.4%, which includes recessionary periods.
- The U6–U3 spread is also widening, signalling more underemployment relative to headline unemployment. While not yet recessionary, it highlights growing slack in the labour market.
US Dollar Index (DXY) Technical Analysis
Bulls have successfully defended the 97.45 support level, leaving the US dollar index (DXY) at risk of a larger rebound if wage growth accelerates and Friday’s NFP does not deliver another weak print. While a move towards 100 remains questionable, a temporary break above 99 cannot be ruled out before the next leg lower.
My broader bias remains bearish into Q4, with expectations that the Federal Reserve will eventually signal further cuts beyond September. The timing of renewed downside momentum may hinge on this week’s payrolls: a weak jobs report coupled with capped earnings would likely push the dollar decisively below 97.45, resuming its downtrend.
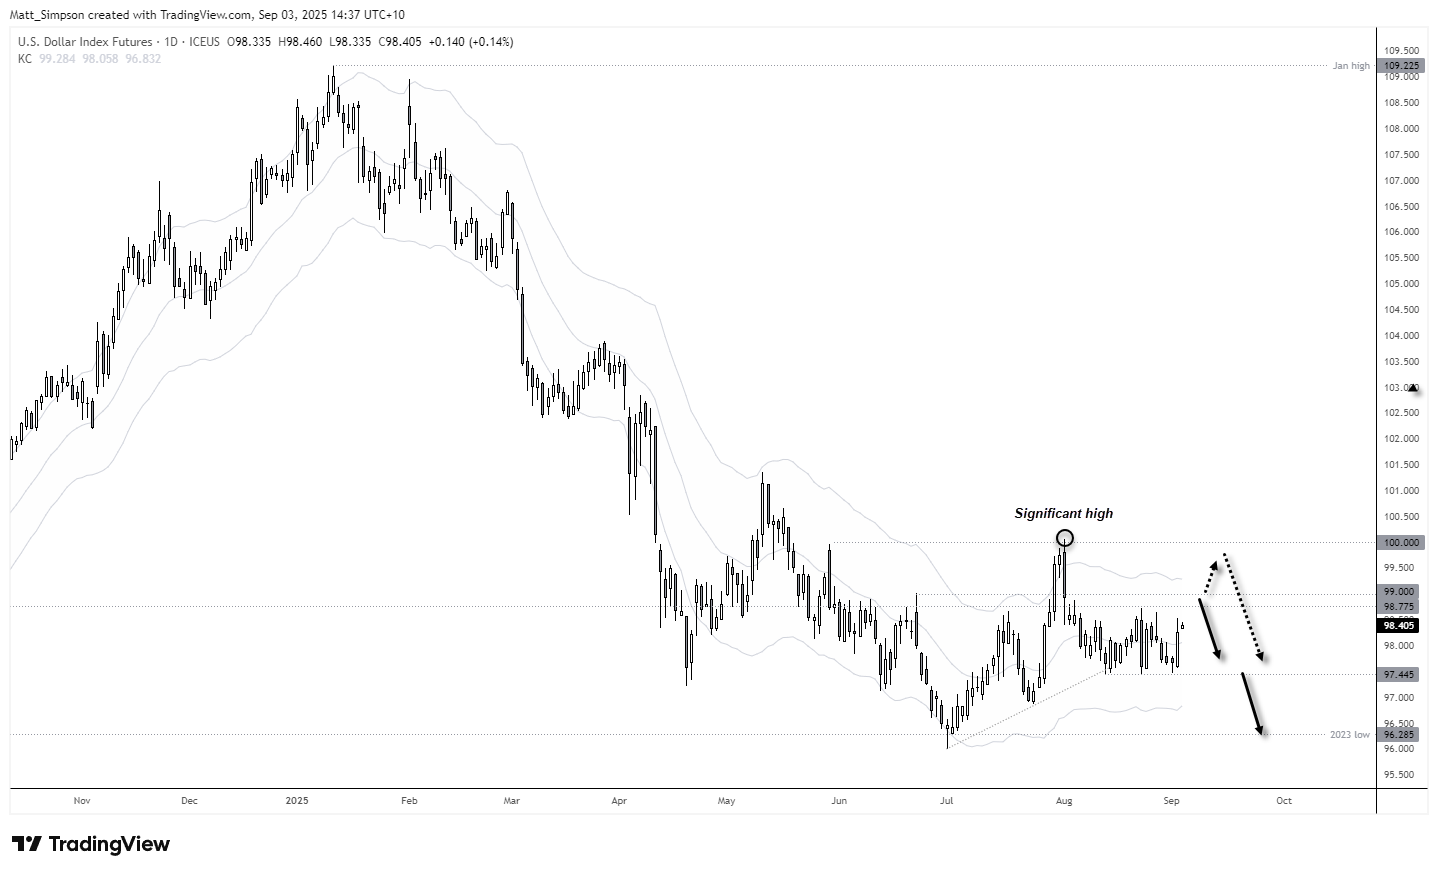

Chart analysis by Matt Simpson - data source: TradingView U.S. Dollar Index Futures
View the full economic calendar
View the full economic calendar
-- Written by Matt Simpson
Follow Matt on Twitter @cLeverEdge
How to trade with City Index
You can trade with City Index by following these four easy steps:
- Open an account, or log in if you’re already a customer
• Open an account in the UK
• Open an account in Australia
• Open an account in Singapore
- Search for the market you want to trade in our award-winning platform
- Choose your position and size, and your stop and limit levels
- Place the trade
Related tags:



Open an account in minutes
Experience award-winning platforms with fast and secure execution, and enjoy tight spreads from 0.5 pts on FX and 0.3 pts on indices.
Economic calendar
Web Trader platform
Our sophisticated web-based platform is packed with features.
Related articles

USD/JPY Forecast: Is Rising Japanese Inflation Supporting the Yen?
As the trading week comes to an end, one of the most relevant developments in the FX market has been the renewed strength of the Japanese yen. This can be seen in the recent performance of USD/JPY, which has fallen nearly 1.0% over the last two trading sessions, highlighting a meaningful recovery in the Japanese currency against the U.S. dollar.


Australian Dollar Forecast: AUD/USD Support Reversal Sparks Monthly Range Breakout 10 23 2026
A sharp reversal off key support has fueled the AUD/USD recovery, with resistance now in focus ahead of next week’s Fed decision and Australian CPI.

USD/JPY, Nikkei Break Lower as AI Meltdown Spreads
Thursday’s tech tantrum has become Friday’s fire sale. With Nikkei support giving way and the yen strengthening, could the selling start feeding on itself?

This report is intended for general circulation only. It should not be construed as a recommendation, or an offer (or solicitation of an offer) to buy or sell any financial products. The information provided does not take into account your specific investment objectives, financial situation or particular needs. Before you act on any recommendation that may be contained in this report, independent advice ought to be sought from a financial adviser regarding the suitability of the investment product, taking into account your specific investment objectives, financial situation or particular needs.
StoneX Financial Pte. Ltd., may distribute reports produced by its respective foreign entities or affiliates within the StoneX group of companies or third parties pursuant to an arrangement under Regulation 32C of the Financial Advisers Regulations. Where the report is distributed to a person in Singapore who is not an accredited investor, expert investor or an institutional investor (as defined in the Securities Futures Act), StoneX Financial Pte. Ltd. accepts legal responsibility to such persons for the contents of the report only to the extent required by law. Singapore recipients should contact StoneX Financial Pte. Ltd. at 6826 9988 for matters arising from, or in connection with the report.
In the case of all other recipients of this report, to the extent permitted by applicable laws and regulations neither StoneX Financial Pte. Ltd. nor its associated companies will be responsible or liable for any loss or damage incurred arising out of, or in connection with, any use of the information contained in this report and all such liability is hereby expressly disclaimed. No representation or warranty is made, express or implied, that the content of this report is complete or accurate.
StoneX Financial Pte. Ltd. is not under any obligation to update this report.
Trading CFDs carries a high level of risk that may not be suitable for some investors. Consider your investment objectives, level of experience, financial resources, risk appetite and other relevant circumstances carefully. The possibility exists that you could lose some or all of your investments, including your initial deposits. If in doubt, please seek independent expert advice. Visit www.forex.com/en-sg/terms-and-policies for the complete Risk Disclosure Statement.