



Japanese Yen Rebound, USD Weakness, Commodity FX Diverge: COT Report
COT report shows dollar shorts steady, yen longs rebounding, and commodity FX diverging as AUD strengthens, CAD weakens, and NZD underperforms.
Share this:

The latest Commitment of Traders (COT) report reveals mixed positioning across currencies and commodities, with the US dollar still in a downtrend, yen longs climbing, and commodity FX showing contrasting trends. AUD/USD is supported by renewed bullish conviction, CAD bears have grown more aggressive, and NZD remains the laggard despite light net-short exposure. These shifts come as traders balance Fed cut expectations against domestic central bank outlooks.
View related analysis:
View related analysis:
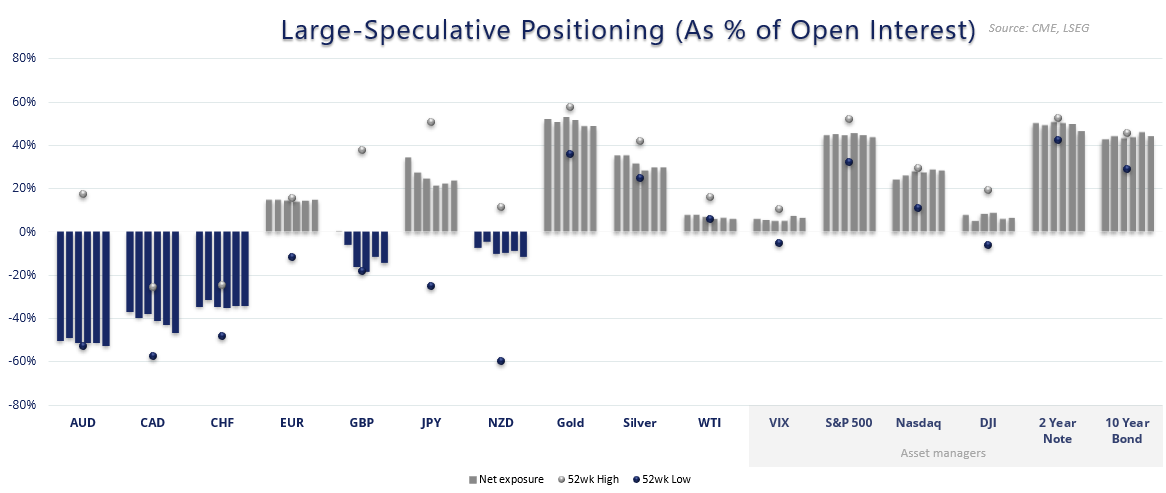
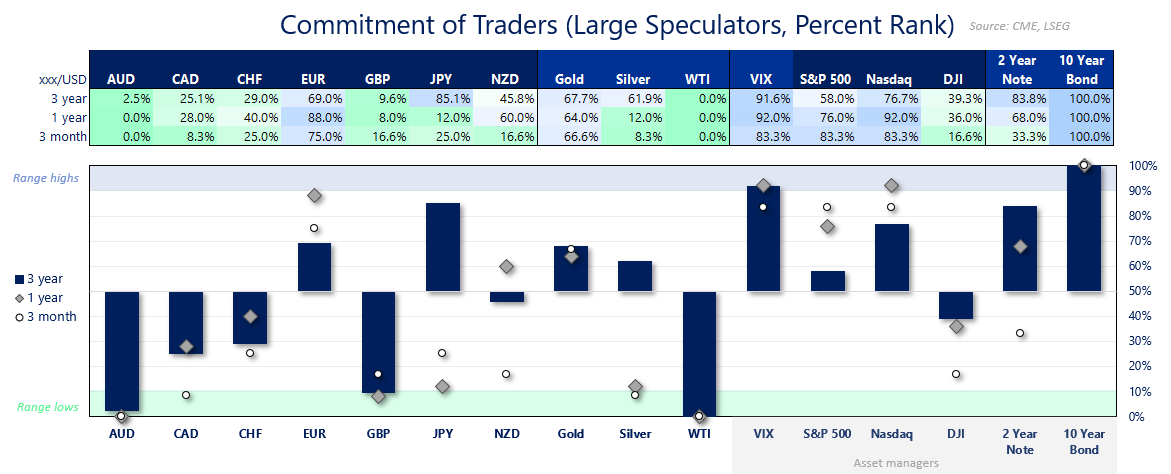
Chart analysis by Matt Simpson - data source: CME, LSEG
Weekly COT Report Highlights:
- US Dollar (USD): Traders were net-short the US dollar by -6.1 billion (-0.5b w/w)
- European dollar (EUR): Asset managers increased net-long exposure to a 19-month high
- British pound (GBP): Large speculators increased net-short exposure by 6.2k contracts
- Japanese yen (JPY): Net-long exposure rose 12.5k contracts combined across large specs and asset managers
- Australian dollar (AUD): Traders most bearish in 16 months
- Canadian dollar (CAD): Net-short exposure increased by 12k contracts
- Crude Oil (WTI): Managed funds cut net-long exposure by -10.7k contracts, a 15-year low
US Dollar Positioning (IMM Data): Weekly COT Report Analysis
The US dollar index remains in a broader downtrend and for a second week printed an inverted hammer candle. For now, this suggests bears have been unable to extend gains, though a weekly close above last week’s high could confirm a swing low. Until then, the preference is to fade into rallies.
Traders were net-short the US dollar by -6.1k contracts, while asset managers held net-short exposure of -5,712 contracts. Neither reading points to a bearish sentiment extreme, leaving scope for positioning to extend further if dollar weakness persists.
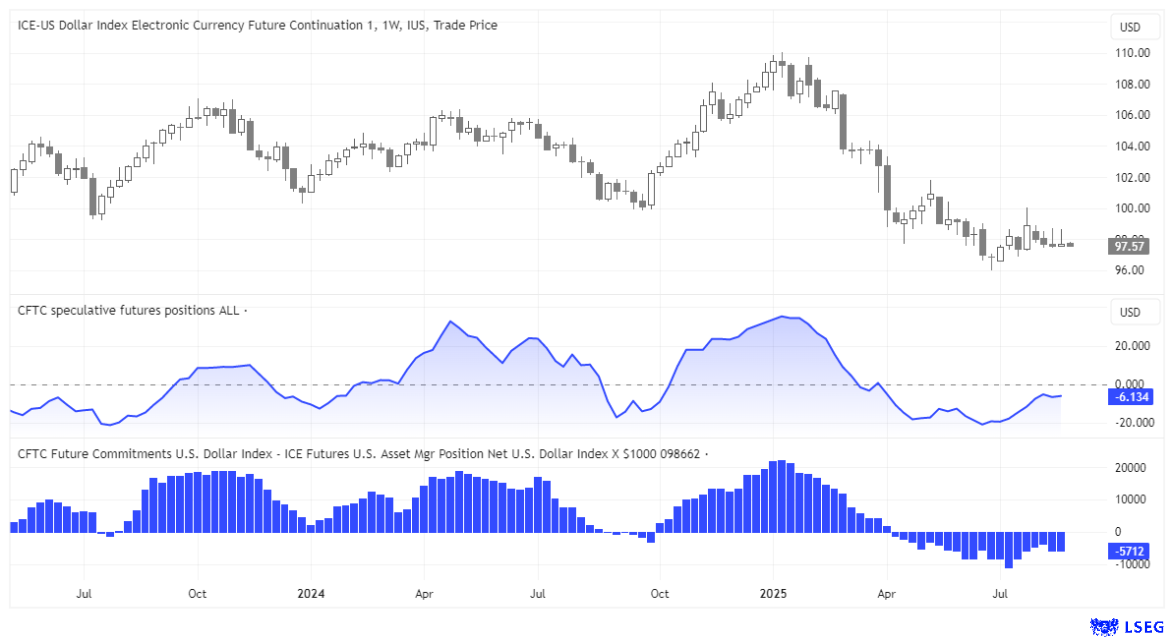
Chart prepared by Matt Simpson - data source: CME, IMM, LSEG
JPY/USD Positioning: Japanese Yen Futures – Weekly COT Report Analysis
Net-long exposure to Japanese yen futures continued to edge higher, with asset managers adding for a third straight week and large speculators for a second. Both groups increased gross-longs and trimmed shorts, lifting overall net-long exposure.
Since net-longs have been trending lower from their May peak, this renewed pickup suggests a trough may now be in place. If so, it implies that a swing high has already formed on USD/JPY, reinforcing downside risks for the dollar against the yen.
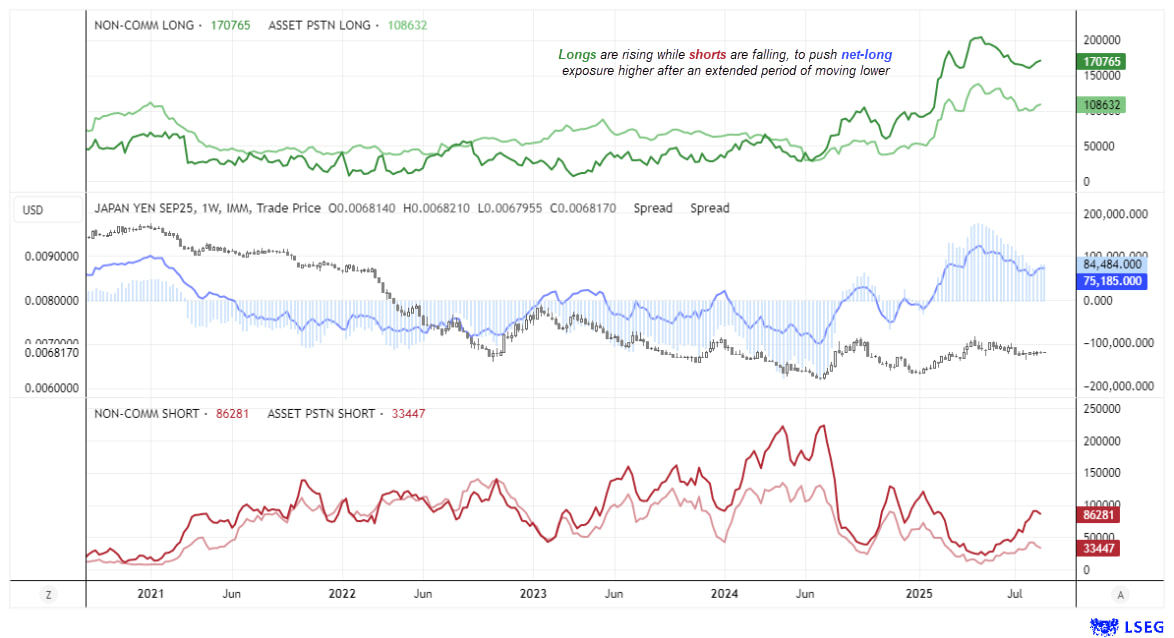
Chart analysis by Matt Simpson - data source: CME, LSEG
Commodity FX Positioning (AUD, CAD, NZD): Weekly COT Report Analysis
Traders remain net-short on the major commodity-FX futures, though last week’s price action suggests bears could face challenges if the US dollar continues to weaken. With that said, the Australian and Canadian dollars show the most potential to perform a rebound compared to the lagging New Zealand dollar.
AUD/USD Positioning: Australian Dollar Futures – Weekly COT Report Analysis
Net-long exposure to AUD/USD futures climbed to a 16-month high among both asset managers and large speculators. Gross-longs rose while gross-shorts declined last week, showing renewed bullish conviction.
This suggests traders are betting that the Reserve Bank of Australia (RBA) will be forced to cut rates sooner than its guidance implies. Even so, I maintain my view that a 25bp cut in Q4 remains a finely balanced decision. And with odds of a Fed cut rising, AUD/USD should remain supported, forcing some of these bears to cover shorts against the Australian dollar.
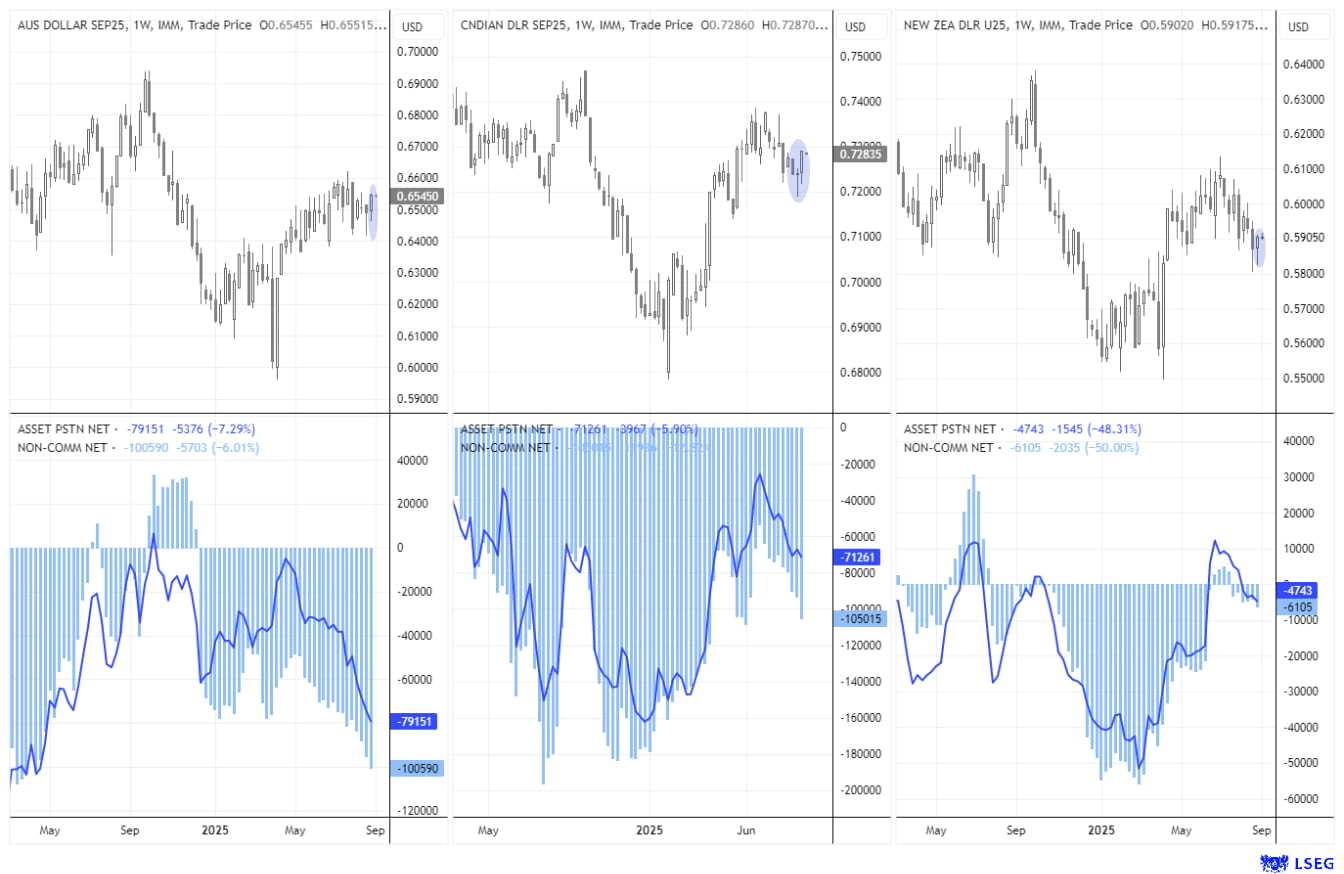
Chart analysis by Matt Simpson, Source: CME Futures, LSEG
CAD/USD Positioning: Canadian Dollar Futures – Weekly COT Report Analysis
Bears added to their net-short exposure in Canadian dollar futures for a fourth consecutive week, marking the most bearish stance since early June. This positioning shift occurred ahead of softer GDP figures, which strengthened bets of another Bank of Canada (BoC) cut.
Despite this, the Canadian dollar closed last week strongly, buoyed by US dollar weakness. The price action also formed a Morning Star reversal pattern on CAD/USD futures — the inverse of an Evening Star on USD/CAD, which reinforces a bearish outlook for the greenback.
NZD/USD Positioning: New Zealand Dollar Futures – Weekly COT Report Analysis
The Reserve Bank of New Zealand (RBNZ) delivered a dovish cut two weeks ago, yet net-short exposure to New Zealand dollar futures remains relatively light among both asset managers and large speculators.
However, this has not translated into stronger NZD/USD performance compared to the Australian or Canadian dollar. NZD/USD has endured the deepest pullback from its June high and the weakest rebound. Last week’s price action only managed to produce a modest bullish inside candle — a muted response that underscores the kiwi’s relative underperformance.
View the full economic calendar
View the full economic calendar
-- Written by Matt Simpson
Follow Matt on Twitter @cLeverEdge
How to trade with City Index
You can trade with City Index by following these four easy steps:
- Open an account, or log in if you’re already a customer
• Open an account in the UK
• Open an account in Australia
• Open an account in Singapore
- Search for the market you want to trade in our award-winning platform
- Choose your position and size, and your stop and limit levels
- Place the trade
Related tags:


Open an account in minutes
Experience award-winning platforms with fast and secure execution, and enjoy tight spreads from 0.5 pts on FX and 0.3 pts on indices.
Economic calendar
Web Trader platform
Our sophisticated web-based platform is packed with features.
Related articles

USD/JPY Weekly Outlook: AI earnings could overshadow the Fed and BoJ
AI sentiment has become a major driver of US Treasury yields and USD/JPY. With Microsoft, Alphabet and Amazon reporting this week, central bank decisions may have competition for traders' attention.


USD/JPY Forecast: Is Rising Japanese Inflation Supporting the Yen?
As the trading week comes to an end, one of the most relevant developments in the FX market has been the renewed strength of the Japanese yen. This can be seen in the recent performance of USD/JPY, which has fallen nearly 1.0% over the last two trading sessions, highlighting a meaningful recovery in the Japanese currency against the U.S. dollar.


US Dollar Price Action Setups: EUR/USD, USD/JPY, GBP/USD, USD/CAD
The Dollar is working on its second consecutive red week and while sellers didn’t exactly pounce on fresh lows, there’s an opening door for bears to make a move.

This report is intended for general circulation only. It should not be construed as a recommendation, or an offer (or solicitation of an offer) to buy or sell any financial products. The information provided does not take into account your specific investment objectives, financial situation or particular needs. Before you act on any recommendation that may be contained in this report, independent advice ought to be sought from a financial adviser regarding the suitability of the investment product, taking into account your specific investment objectives, financial situation or particular needs.
StoneX Financial Pte. Ltd., may distribute reports produced by its respective foreign entities or affiliates within the StoneX group of companies or third parties pursuant to an arrangement under Regulation 32C of the Financial Advisers Regulations. Where the report is distributed to a person in Singapore who is not an accredited investor, expert investor or an institutional investor (as defined in the Securities Futures Act), StoneX Financial Pte. Ltd. accepts legal responsibility to such persons for the contents of the report only to the extent required by law. Singapore recipients should contact StoneX Financial Pte. Ltd. at 6826 9988 for matters arising from, or in connection with the report.
In the case of all other recipients of this report, to the extent permitted by applicable laws and regulations neither StoneX Financial Pte. Ltd. nor its associated companies will be responsible or liable for any loss or damage incurred arising out of, or in connection with, any use of the information contained in this report and all such liability is hereby expressly disclaimed. No representation or warranty is made, express or implied, that the content of this report is complete or accurate.
StoneX Financial Pte. Ltd. is not under any obligation to update this report.
Trading CFDs carries a high level of risk that may not be suitable for some investors. Consider your investment objectives, level of experience, financial resources, risk appetite and other relevant circumstances carefully. The possibility exists that you could lose some or all of your investments, including your initial deposits. If in doubt, please seek independent expert advice. Visit www.forex.com/en-sg/terms-and-policies for the complete Risk Disclosure Statement.