



USD/JPY, DXY Outlook: Short-Term Weakness, Long-Term Strength?
USD/JPY and DXY Price Outlook: Key Scenarios to Watch Amid Rising Crude Oil Prices, Treasury Yields and Geopolitical Uncertainty
Share this:

The USD/JPY and DXY charts are approaching defining support levels, creating a conflict between short-term weakness, long-term bullish continuation risks, and the risk of a broader structural bearish shift.
Several factors are contributing to volatility risks across both charts:
- Rising U.S. Treasury yields: The U.S. 10-year Treasury yield recently reached a new 2026 high near 4.8%, widening the interest-rate differential between the United States and Japan
- Bank of Japan rate-hike expectations: Markets are pricing in the possibility of a 25-basis-point rate hike at the BOJ meeting scheduled for September 17–18. This expectation is providing short-term support for the yen.
- Crude oil and geopolitical risks: Crude oil prices have broken above a 7-month resistance level, increasing concerns about supply disruptions and inflation. This could support the dollar through safe-haven demand, although persistently higher oil prices could also raise concerns about global growth.
As of September 7, the fundamental and technical picture remains tilted towards geopolitical risks. Short-term dollar weakness is visible, but the broader risk narrative continues to support the possibility of renewed dollar strength if inflation, yields, and geopolitical tensions remain elevated.
DXY Price Outlook: Monthly Time Frame — Log Scale
Source: TradingView
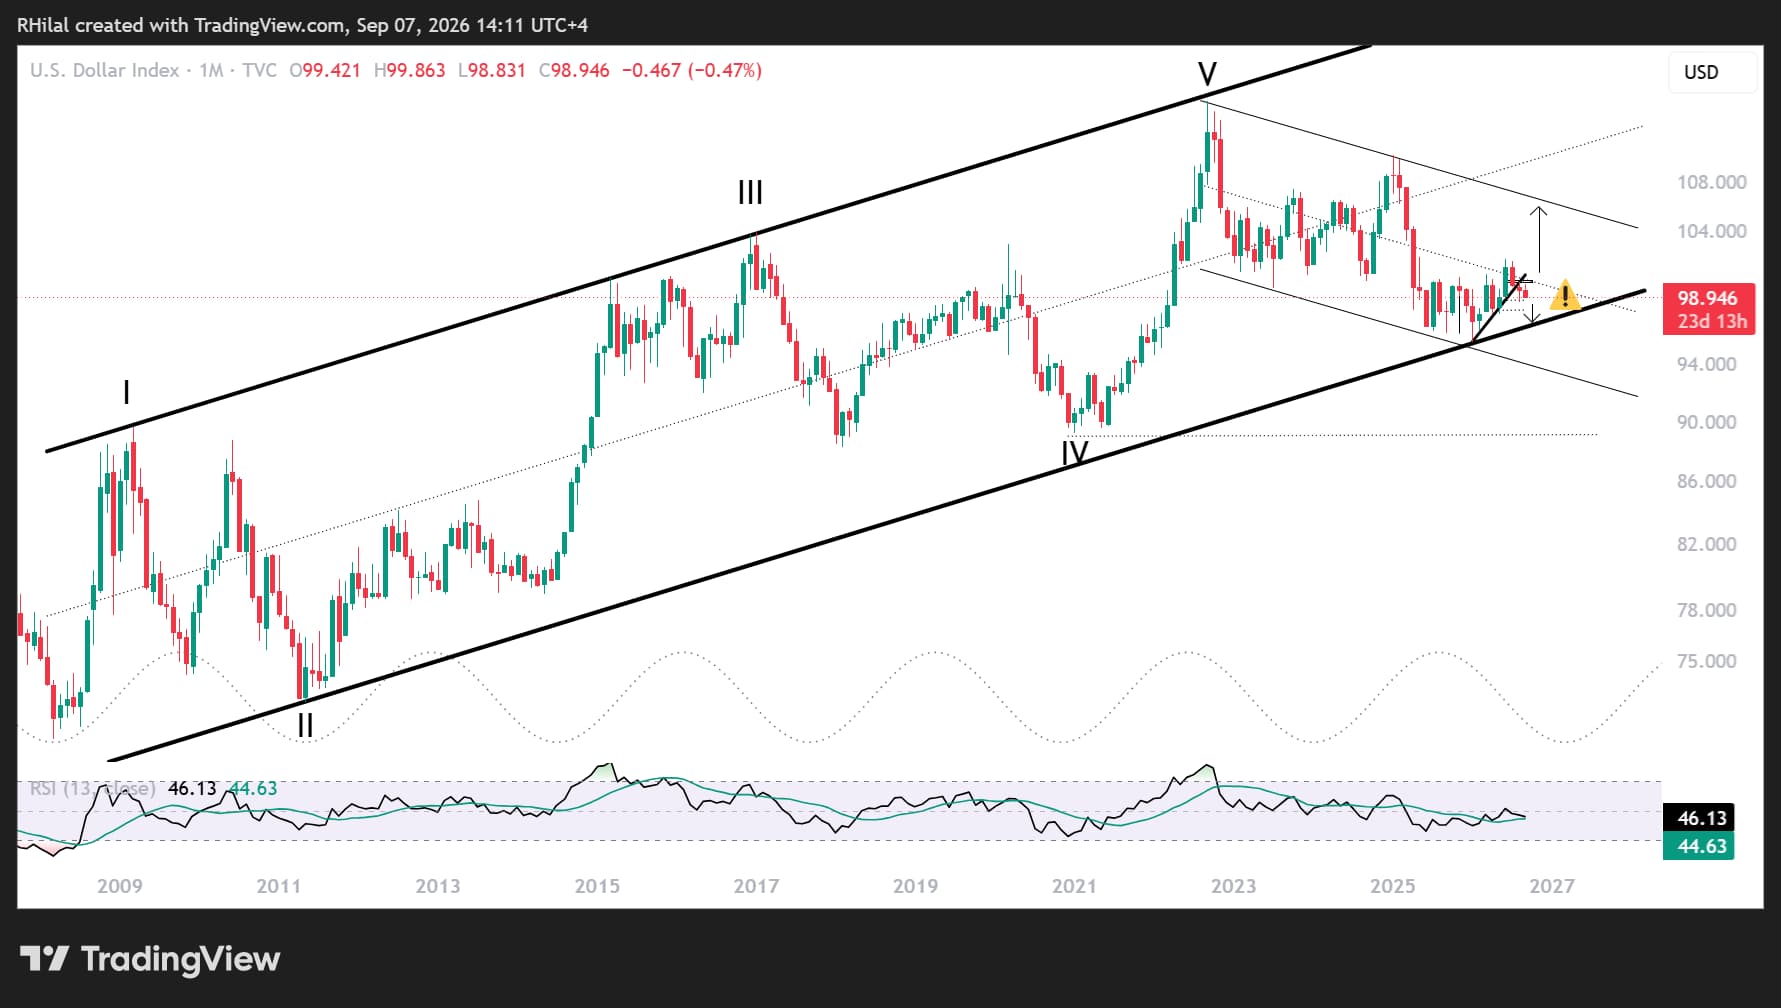
Despite the DXY breaking below its 2026 uptrend, signaling short-term weakness, the longer-term structure remains tilted to the upside.
The key downside levels I am watching align with the Fibonacci retracement levels of the 2026 uptrend: 98.50, 98, 97 and 95.50. The 95.50 area is the defining barrier between a structural breakdown of the 18-year uptrend and a potential continuation of the longer-term bullish structure.
On the upside, reclaiming the 2026 uptrend near 100.30, followed by a move above 101 and 101.70, would restore the dollar’s strength against major markets. Such a move could lift the DXY toward new 2026 highs and add further pressure on Japanese officials facing persistent yen weakness.
This situation could become more critical if the interest-rate differential between the United States and Japan continues to widen.
Key DXY Scenarios
Bullish scenario: A recovery above 100.30, followed by a breakout above 101 and 101.70, would signal renewed dollar strength and support a move toward new yearly highs.
Bearish scenario: A sustained breakdown below 98.50 and 98 would increase the risk of a deeper correction toward 97 and 95.50. A clear break below 95.50 would confirm a more significant structural shift and challenge the long-term bullish trend.
USD/JPY Price Outlook: Weekly Time Frame — Log Scale
Source: TradingView
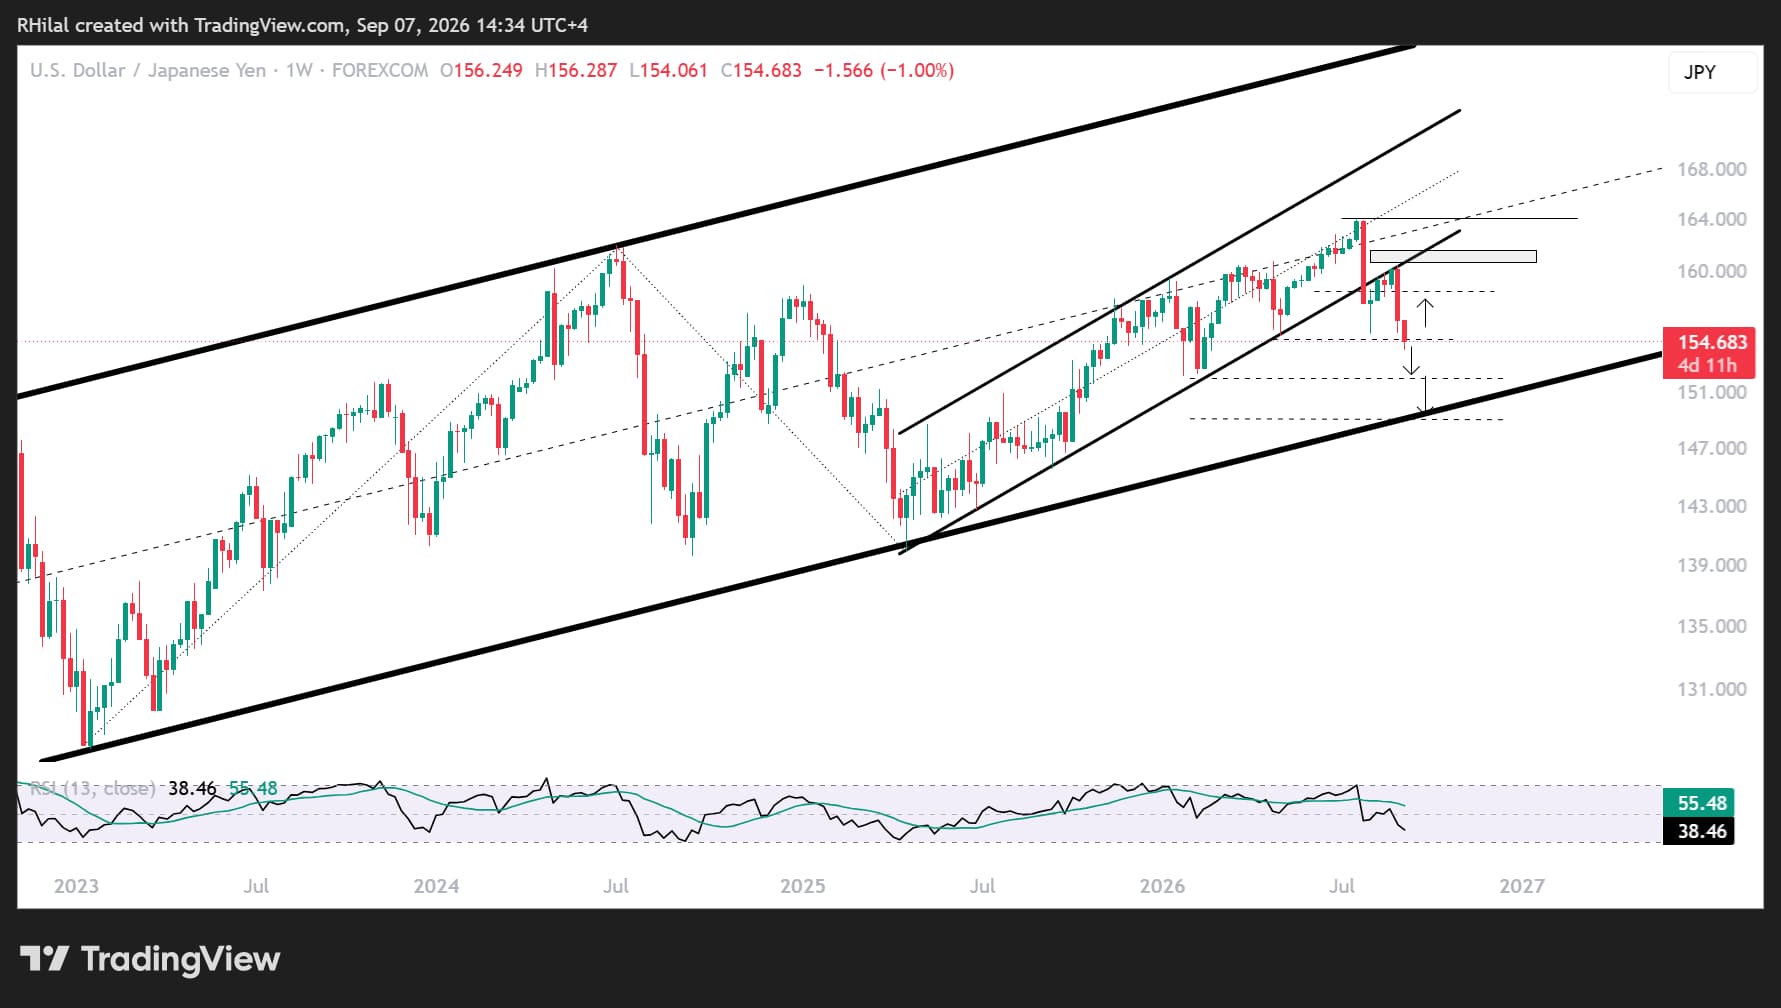
Technically, USD/JPY is breaking below a 3-month support level, signaling short-term yen strength while simultaneously approaching an uptrend support zone that has been in place since 2023.
Key Patterns and Scenarios in Focus
The breakdown below the April 2025–July 2026 channel points to short-term weakness and aligns with the Fibonacci retracement levels of that advance.
Price action is currently testing a breakdown below 154.80, the 38.2% retracement level. A sustained move below this level could target 152, corresponding to the 50% retracement, followed by 149 near the 61.8% retracement level.
The 149 area could become an important zone for a potential long-term rebound, aligning with the golden ratio, the broader 2023–2026 uptrend and increasingly oversold momentum conditions.
Bearish scenario: A clear breakdown below 149 would confirm broader structural weakness and increase the risk of a deeper correction in USD/JPY.
Bullish scenario: Holding above 149 would preserve the broader bullish structure. On the upside, reclaiming the 2026 uptrend boundaries near 158.40, 161 and 164 would restore USD/JPY strength and expose the upper channel boundary near 170.
Short-term weakness, the potential for long-term dollar strength and persistent geopolitical risks are shaping the outlook for USD/JPY and the DXY.
The next major catalysts include the U.S. CPI report on Friday, the BOJ meeting on September 17–18 and the FOMC meeting on September 16. The reaction in Treasury yields and the direction of crude oil prices will remain critical in determining whether the current weakness develops into a deeper structural decline or becomes another correction within a broader bullish trend.
Written by Razan Hilal, CMT
Follow on X: @Rh_waves
Related tags:
Latest market news




Open an account in minutes
Experience award-winning platforms with fast and secure execution, and enjoy tight spreads from 0.5 pts on FX and 0.3 pts on indices.
Economic calendar
Web Trader platform
Our sophisticated web-based platform is packed with features.
Related articles
Silver Analysis: XAG/USD Falls Back to Annual Lows
Recent sessions have been particularly challenging for silver prices in the short term. Selling pressure has intensified considerably, resulting in three consecutive losing sessions and pushing the metal to a decline of nearly 8.5% over this period.
Canadian Dollar Short-term Outlook: USD/CAD Five-Week Rally Hits a Wall at Major Resistance 10 14 2026
USD/CAD is holding near fresh yearly highs, but bearish divergence and a well-defined October range raise the stakes at major resistance.

EUR/USD Analysis: Euro Loses Ground After a Stronger-Than-Expected U.S. CPI Report
The trading week continues to unfold and weakness around the euro has once again become increasingly evident in the short term. This can be seen in the recent performance of EUR/USD, which has declined roughly 0.3% over the last three trading sessions, highlighting renewed strength in the U.S. dollar.
This report is intended for general circulation only. It should not be construed as a recommendation, or an offer (or solicitation of an offer) to buy or sell any financial products. The information provided does not take into account your specific investment objectives, financial situation or particular needs. Before you act on any recommendation that may be contained in this report, independent advice ought to be sought from a financial adviser regarding the suitability of the investment product, taking into account your specific investment objectives, financial situation or particular needs.
StoneX Financial Pte. Ltd., may distribute reports produced by its respective foreign entities or affiliates within the StoneX group of companies or third parties pursuant to an arrangement under Regulation 32C of the Financial Advisers Regulations. Where the report is distributed to a person in Singapore who is not an accredited investor, expert investor or an institutional investor (as defined in the Securities Futures Act), StoneX Financial Pte. Ltd. accepts legal responsibility to such persons for the contents of the report only to the extent required by law. Singapore recipients should contact StoneX Financial Pte. Ltd. at 6826 9988 for matters arising from, or in connection with the report.
In the case of all other recipients of this report, to the extent permitted by applicable laws and regulations neither StoneX Financial Pte. Ltd. nor its associated companies will be responsible or liable for any loss or damage incurred arising out of, or in connection with, any use of the information contained in this report and all such liability is hereby expressly disclaimed. No representation or warranty is made, express or implied, that the content of this report is complete or accurate.
StoneX Financial Pte. Ltd. is not under any obligation to update this report.
Trading CFDs carries a high level of risk that may not be suitable for some investors. Consider your investment objectives, level of experience, financial resources, risk appetite and other relevant circumstances carefully. The possibility exists that you could lose some or all of your investments, including your initial deposits. If in doubt, please seek independent expert advice. Visit www.forex.com/en-sg/terms-and-policies for the complete Risk Disclosure Statement.