
Australian Technical Forecast: AUD/USD Weekly Trade Levels
- AUD/USD consolidates within multi-week range below trend resistance
- Aussie major breakout risk building while below multi-year slope – Core PCE on tap
- Resistance 6550/77 (key), 6671, 6795-6810- Support 6445, 6409, 6354/6357 (key)
The Australian Dollar is in consolidation just below multi-year downtrend resistance, with AUD/USD trading within a well-defined range into the close of August. This pattern highlights a critical inflection point and the focus is on a breakout in the weeks ahead with the bulls vulnerable below key resistance. Battle lines drawn on the AUD/USD weekly technical chart.
Review my latest Weekly Strategy Webinar for an in-depth breakdown of this Aussie setup and more. Join live on Monday’s at 8:30am EST.
Australian Dollar Price Chart – AUD/USD Weekly
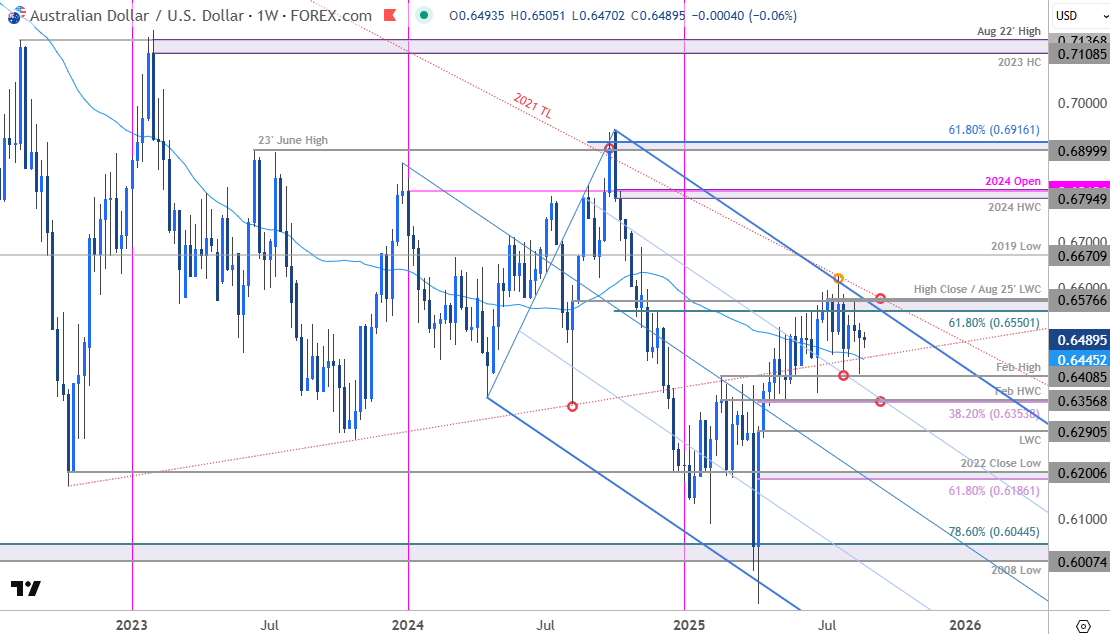
Chart Prepared by Michael Boutros, Sr. Technical Strategist; AUD/USD on TradingView
Technical Outlook: In last month’s Australian Dollar Forecast we noted that, “A reversal off downtrend resistance is now approaching initial support- risk for trend resumption heading into August. From a trading standpoint, the immediate focus is on the weekly close with respect to 6400…” Aussie held support that week with the entire August range holding within that single week’s range- looking for the breakout in the days ahead.
Initial support rests with the 52-week moving average (currently ~6445) and is backed closely by the February high at 6408 and the 38.2% retracement of the yearly range / February high-week close (HWC) at 6354/57- look for a larger reaction there IF reached. Losses below this threshold would suggest a more significant high is in place / threaten resumption of the broader downtrend. Subsequent support objectives rest at the yearly low-week close (LWC) at 6290 and the 61.8% retracement / 2022 close-low at 6186-6200.
Key resistance / bearish invalidation is eyed at 6550/77- a region defined by the 61.8% retracement of the 2024 decline, the August 2024 LWC, and the 2025 HWC. A topside breach / close above this threshold is needed mark resumption of the April advance / invalidate the 2021 downtrend with subsequent resistance eyed at the 2016 low at 6671 and the 2024 HWC / 2024 open at 6795-6810- both areas of interest for possible exhaustion / price inflection IF reached.

Bottom line: AUD/USD is trading just below multi-year downtrend resistance with the immediate focus still on a breakout of the July 28th weekly candle for guidance. From a trading standpoint, rallies should be limited to 6577 IF price is heading lower on this stretch with a close below 6357 needed to fuel the next leg of the decline.
Keep in mind we get the release of key U.S. inflation data this week with the Core Personal Consumption Expenditure (PCE) on tap Friday. Stay nimble into the release and watch the weekly close here for guidance. Review my latest Australian Dollar Short-term Outlook for a closer look at the near-term AUD/USD technical trade levels.
Australia / US Economic Calendar
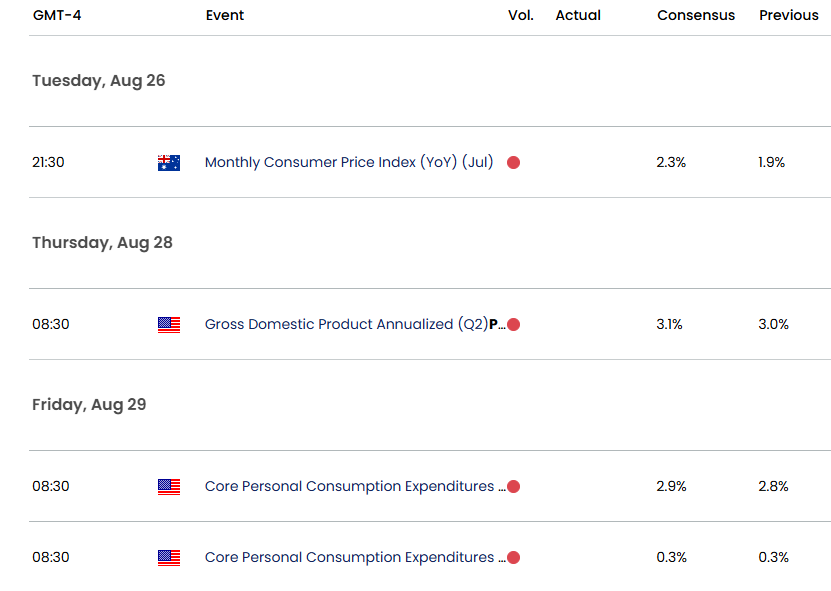
Economic Calendar - latest economic developments and upcoming event risk.
Active Weekly Technical Charts
- Crude Oil (WTI)
- Euro (EUR/USD)
- US Dollar Index (DXY)
- Canadian Dollar (USD/CAD)
- Japanese Yen (USD/JPY)
- British Pound (GBP/USD)
- Swiss Franc (USD/CHF)
- Gold (XAU/USD)
- S&P 500, Nasdaq, Dow
--- Written by Michael Boutros, Sr Technical Strategist
Follow Michael on X @MBForex