
On Wednesday, after market, NetApp (NTAP) is anticipated to report 4Q EPS of $1.09 compared to $1.22 the prior year on revenue of approximately $1.4B vs. $1.6B last year. The company is a leading provider of data management and storage solutions, and on May 12th, Cesar Cernuda was appointed as President of the company.
Looking at a weekly chart, NetApp's stock price is falling inside of a descending channel that began to form after the company topped out in September, 2018. Price has just found resistance at the 20-week moving average. We expect price to pull back before regaining momentum, breaking through the 20-week moving average and continuing towards the top of the channel, as price has done two prior times inside the descending channel.

Source: GAIN Capital, TradingView
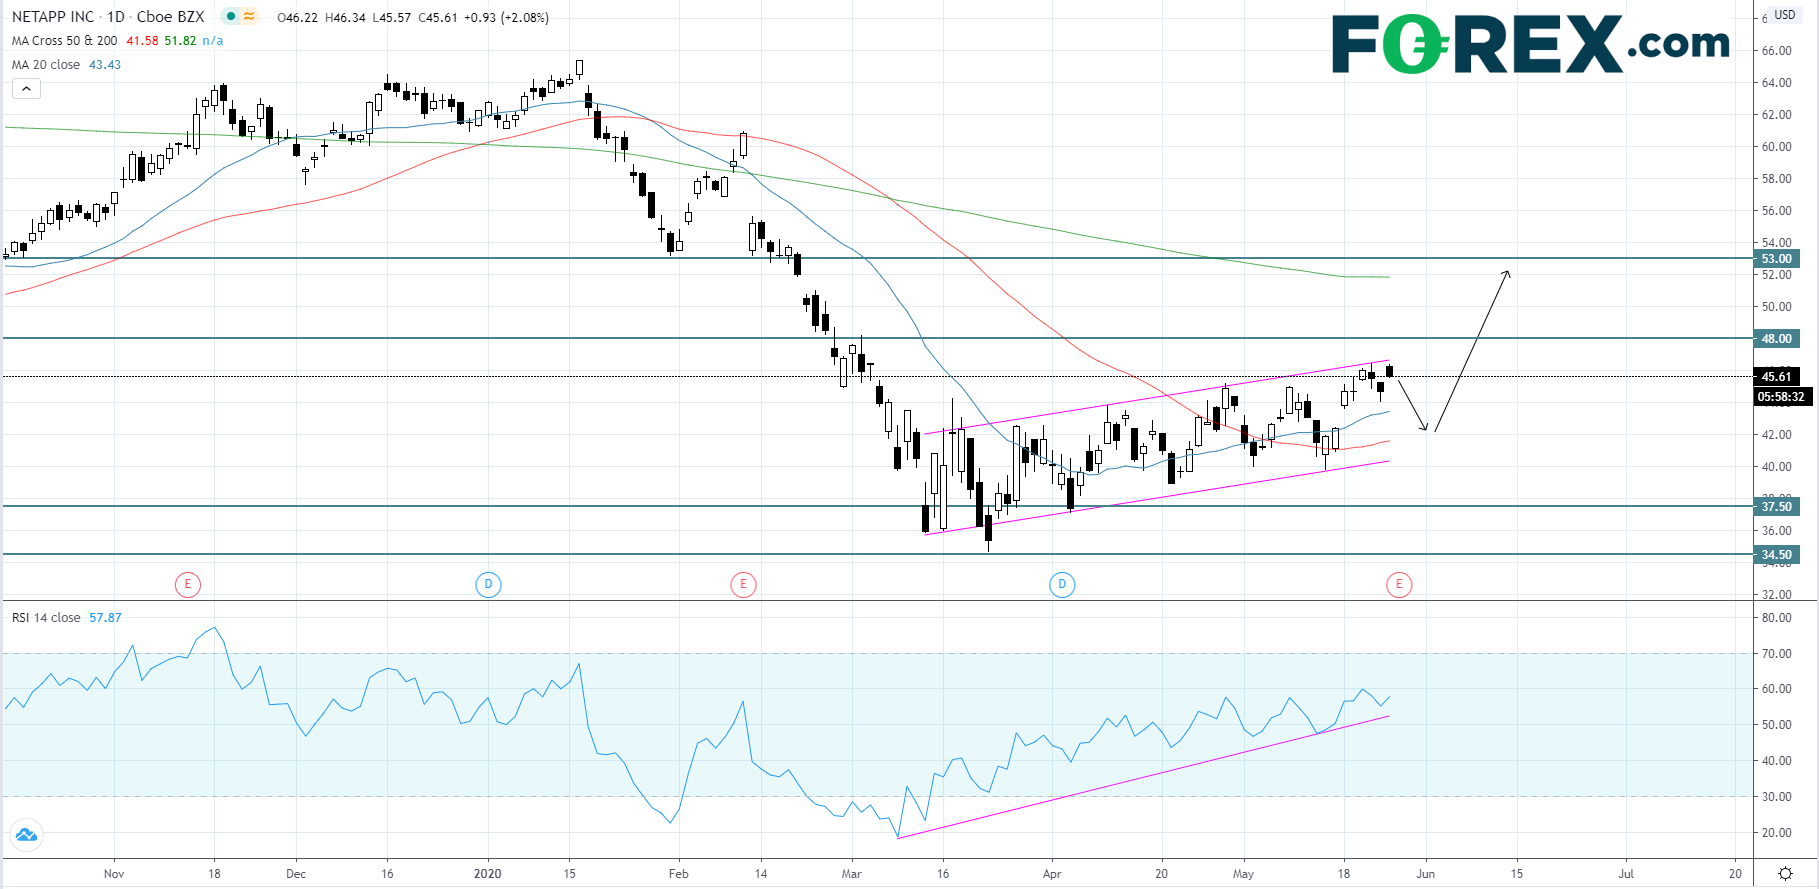
Looking at a daily chart, NetApp's stock price is rising inside of an ascending channel that began to form around the recent market bottom in late-March. Since price is at the top of the channel we expect it to pull back before bouncing off of the lower trend line around the 50-day moving average. The RSI is holding above a rising trend line and above 50. If price can hold inside the lower trend line then we are likely to see price reach the $48.00 resistance level and cut through it on the way to the $53.00 level. If price breaks below the lower trend we may see a fall towards $37.50 and $34.50.
Source: GAIN Capital, TradingView
Looking at a weekly chart, NetApp's stock price is falling inside of a descending channel that began to form after the company topped out in September, 2018. Price has just found resistance at the 20-week moving average. We expect price to pull back before regaining momentum, breaking through the 20-week moving average and continuing towards the top of the channel, as price has done two prior times inside the descending channel.
Source: GAIN Capital, TradingView
Looking at a daily chart, NetApp's stock price is rising inside of an ascending channel that began to form around the recent market bottom in late-March. Since price is at the top of the channel we expect it to pull back before bouncing off of the lower trend line around the 50-day moving average. The RSI is holding above a rising trend line and above 50. If price can hold inside the lower trend line then we are likely to see price reach the $48.00 resistance level and cut through it on the way to the $53.00 level. If price breaks below the lower trend we may see a fall towards $37.50 and $34.50.
Source: GAIN Capital, TradingView