
Crude Oil Technical Forecast: WTI Weekly, Daily & Intraday Trade Levels
- Oil prices plunge more than 5.7% off the December high with WTI now testing pivotal support
- WTI broader downtrend remains intact- focus on a possible inflection off this zone with the immediate short-bias vulnerable while above support
- Resistance 58.47, 60.18, 61.43/45 (key), 62.55/90- Support 56.83-57.20 (key), 54.36-55.10, 51.67
Crude oil plunged into support today with WTI now testing a critical pivot-zone at multi-week lows. This region has produced numerous inflections throughout the year, and a reaction here will be key for near-term direction. A sustained break beneath support would open the door for the next major leg lower and while the broader outlook remains weighted to the downside, the immediate short-bias may be vulnerable while above this high-stakes inflection point. Battle lines drawn on the weekly, daily, and 240min technical charts.
Review my latest Weekly Strategy Webinar for an in-depth breakdown of this crude oil setup and more. Join live on Monday’s at 8:30am EST.
Oil Price Chart – WTI Weekly
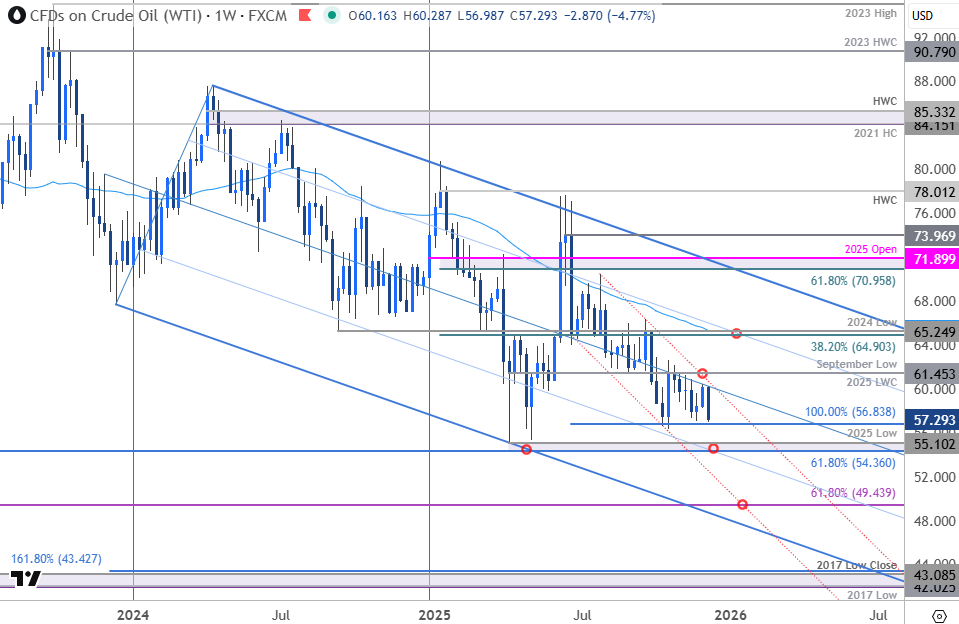
Chart Prepared by Michael Boutros, Technical Strategist; WTI on TradingView
Technical Outlook: In last month’s Oil Price Forecast we noted that WTI was, “trading just above a critical support zone on building momentum divergence with the weekly opening-range intact just above. Look for the breakout to offer guidance in the days ahead. From a trading standpoint, rallies should be limited to 60.18 IF price is heading lower on this stretch with a close below 56.83 needed to fuel the next major leg of the decline.” The range broke higher the following day with WTI extending more than 5.9% off the November low to briefly register an intraday high at 60.48 before exhausting (close high registered at 60.18). The subsequent reversal has now plunged nearly 5.8% off the December high with price once again approaching key support near the October and November lows. Risk for inflection into this threshold with a break below needed mark resumption of the July downtrend into the close of the year.

Oil Price Chart – WTI Daily
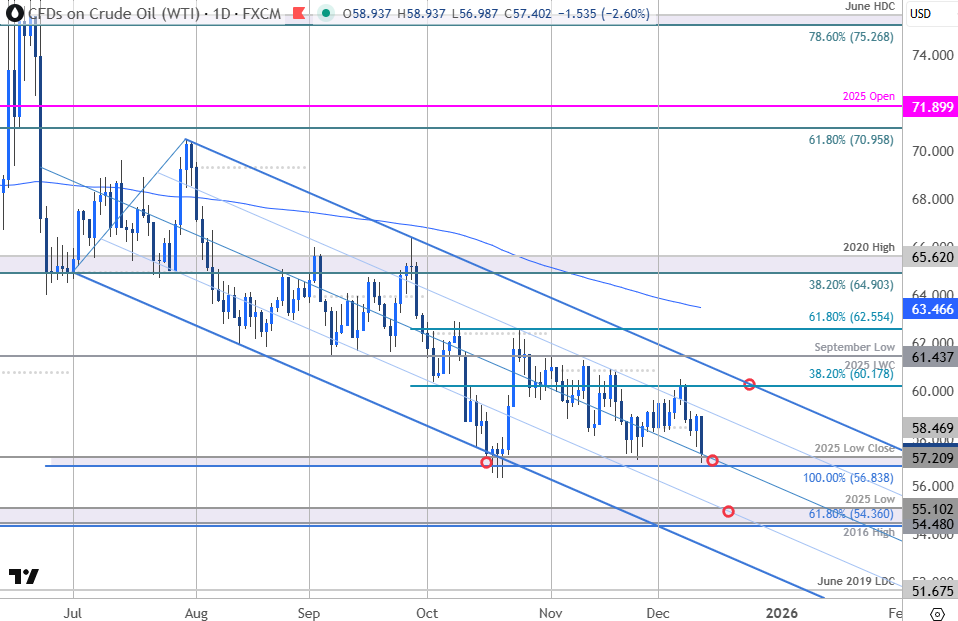
Chart Prepared by Michael Boutros, Technical Strategist; WTI on TradingView
A look at the daily chart shows WTI continuing to trade within the confines of a descending pitchfork formation extending off the late-July high with the median-line now converging on key support at 56.84-57.21- a region defined by the 100% extension the June decline, the November swing low, and the 2025 low-close. Looking for a reaction into this pivotal support in the days ahead.
Oil Price Chart – WTI 240min
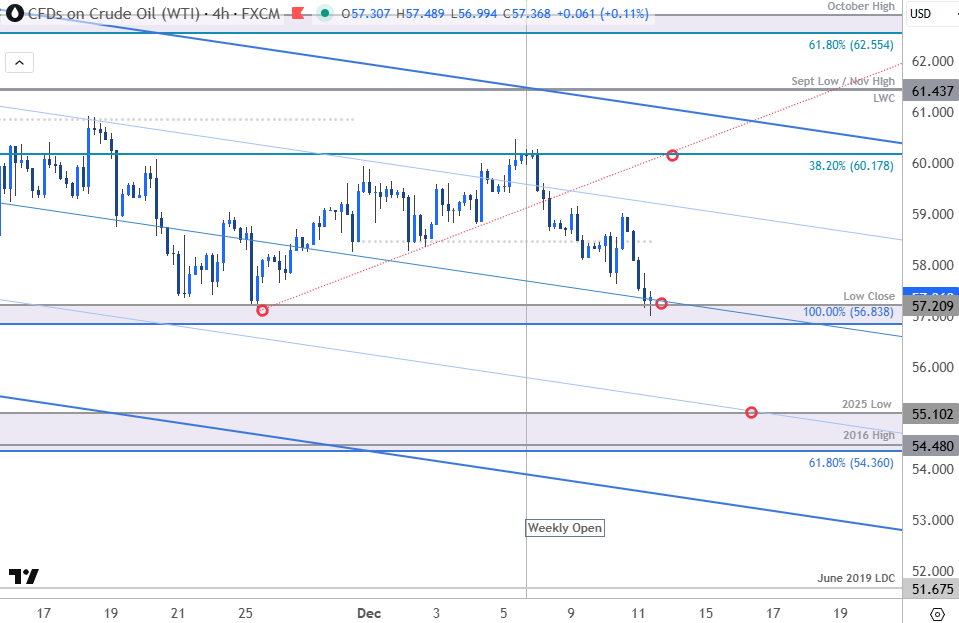
Chart Prepared by Michael Boutros, Technical Strategist; WTI on TradingView
A closer look at oil price action shows WTI testing confluent support today in US trade. Monthly open resistance is eyed at 58.47 and is backed by the 38.2% retracement of the September decline at 60.18. Key resistance / bearish invalidation stands at 61.44/48- a level defined by the 2025 low-week close (LWC), the September low and the November high. A breach / daily close above this level would be needed to suggest a more significant low is in place and that a larger trend reversal is underway. The next major technical consideration is eyed at the 61.8% retracement and the October high at 62.55/90.
A break / close below this key pivot zone would threaten another bout of accelerated losses with subsequent support objectives eyed at the 61.8% extension of the broader 2022 decline, the 2016 high, and the 2025 swing low at 54.36-55.10. Note that the 25% parallel converges on this threshold over the next few weeks- look for a larger reaction there IF reached. Subsequent support rests with the lower parallel (currently ~53.30s) and the June 2019 low-day close (LDC at 51.68.
Bottom line: Oil is trading into a critical support pivot and while the broader outlook remains tilted to the downside, the focus is on inflection into this zone with the immediate short-bias vulnerable while above. From a trading standpoint, a good region to reduce short-exposure / lower protective stops- rallies should be limited to 58.47 IF price is heading lower on this stretch with a close below 56.83 still needed to fuel the next major leg of the decline- watch the weekly closes here for guidance.
Active Weekly Technical Charts
- British Pound (GBP/USD)
- US Dollar Index (DXY)
- Euro (EUR/USD)
- Canadian Dollar (USD/CAD)
- Swiss Franc (USD/CHF)
- Japanese Yen (USD/JPY)
- Australian Dollar (AUD/USD)
- S&P 500, Nasdaq, Dow
- Bitcoin (BTC/USD)
- Gold (XAU/USD)
--- Written by Michael Boutros, Senior Technical Strategist
Follow Michael on X @MBForex