



Stocks rebound after sharp drop
…. it could be a dead-cat bounce
Share this:

After last week’s central-bank-induced sell-off, European markets rebounded along with US futures to trade in the positive territory in the first half of Monday’s session. A rebound was always on the cards as the major indices reached oversold levels and hit some key technical levels. But heightened volatility could be with us as we head into the final weeks of the year.
Though there is some optimism in the air that US inflation has peaked, this alone might not be enough to keep investors optimistic for too long. We are continuing to see signs that world’s largest economy is heading towards a recession, as indicated for example by the latest S&P Global PMI data released on Friday. In case you missed it, the services PMI fell to 44.4 from 46.2, while the manufacturing PMI slipped to 46.2 from 47.7. A reading below 50.0 points to contraction, so these numbers were not good by any measure. A day earlier, we saw the Empire State and Philly Fed Manufacturing indices, as well as US retail sales and industrial production all disappoint expectations.
Investors are also worried about the Fed and ECB potentially over-tightening their respective monetary policies, which could tip the economy into a recession that might otherwise be avoided. The Fed has projected that interest rates will rise to around 5.00-5.25% before hiking is paused, while the ECB President Christine Lagarde warned that “we should expect to raise interest rates at a 50 basis-point pace for a period of time.”
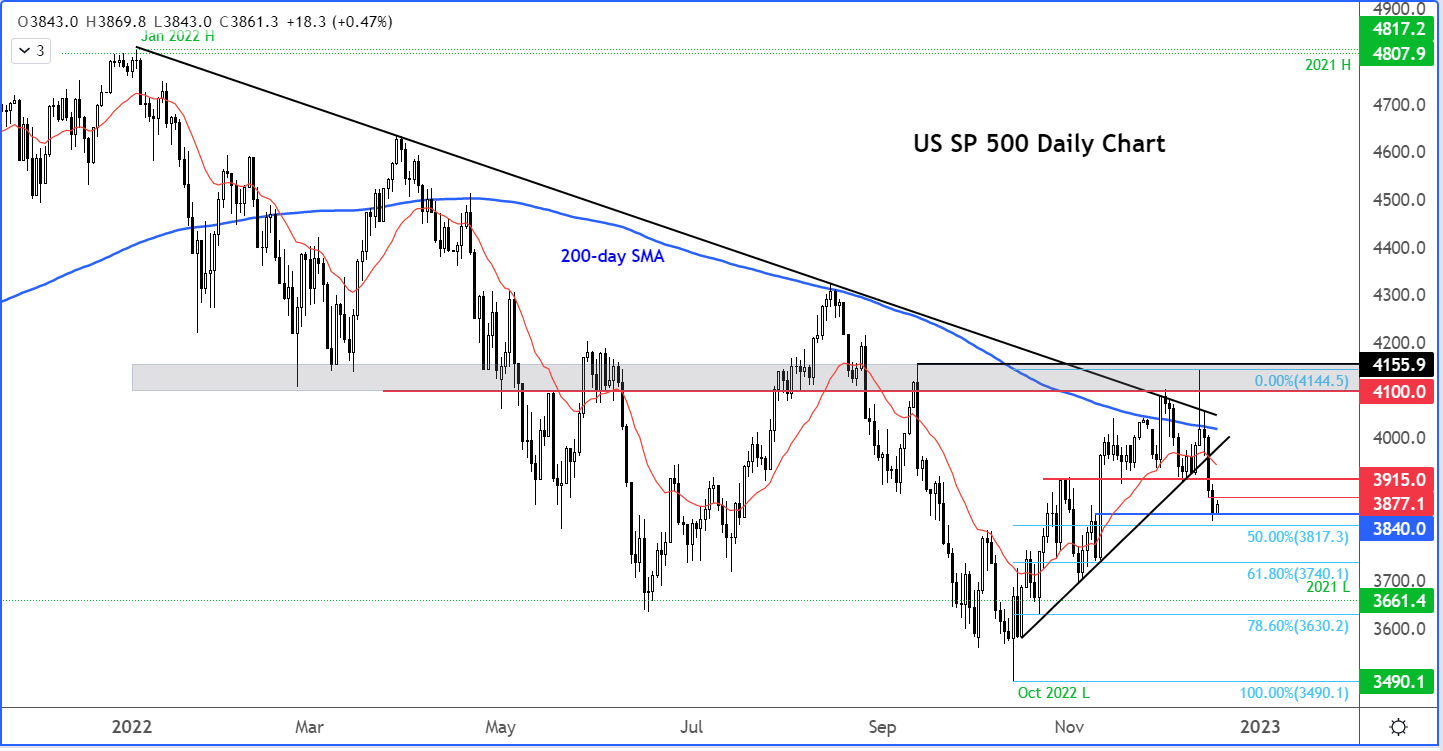
As a result of these hawkish central banks and worries about the economy, the major indices such as the S&P plunged and broke some key technical levels last week. This means the technical path of least resistance is once again to the downside.
The S&P broke its bullish trend line after several attempts to break above the longer-term bearish trend and 200-day average failed. With key support around 3915 broken, the bears will remain happy for as long as the index holds below this level now. Thursday’s low at 3877 is an additional resistance level that needs to be monitored closely.
On the downside, the S&P has dropped to the level where we were expecting a bounce i.e., around 3840. This was the base of the previous breakout, which meant that the market was always going to respect this level. That’s proved to be the case as the S&P has bounced here. But the damage is already done. I wouldn’t be surprised if the S&P resumed lower.
How to trade with FOREX.com
Follow these easy steps to start trading with FOREX.com today:
- Open a Forex.com account, or log-in if you’re already a customer.
- Search for the pair you want to trade in our award-winning platform.
- Choose your position and size, and your stop and limit levels.
- Place the trade.
How to trade with City Index
You can trade with City Index by following these four easy steps:
- Open an account, or log in if you’re already a customer
• Open an account in the UK
• Open an account in Australia
• Open an account in Singapore
- Search for the company you want to trade in our award-winning platform
- Choose your position and size, and your stop and limit levels
- Place the trade
Related tags:
Latest market news




Open an account in minutes
Experience award-winning platforms with fast and secure execution.
Economic calendar
Web Trader platform
Our sophisticated web-based platform is packed with features.
Related articles
EUR/USD outlook: euro back above 1.1000 as dollar rally loses steam
EUR/USD has recovered back above 1.1000 after a brief break lower, a sign the dollar's inflation-driven rally may be losing momentum. With a December Fed hike largely priced in and oil a potential tailwind for the euro, the risks are starting to tilt to the upside.
British Pound Technical Outlook: GBP/USD Tests Pivotal Support—Breakdown Risk Rises 11 17 2026
Sterling bears are pressing critical support near the yearly lows, with the next reaction likely to determine whether the broader trading range survives.


S&P 500 forecast: Why US stocks have largely defied gravity and what could trigger a correction
Though we have seen some weakness in US stock markets recently, this has been nothing compared to the percentage drops we have seen this year for Bitcoin, silver and several major Asia pacific equity markets. The divergence raises an important question: is S&P 500 genuinely insulated from the forces weighing on other assets, or is it simply taking longer for the weakness to spread?
StoneX Financial Ltd (trading as "FOREX.com") is an execution-only service provider. This material, whether or not it states any opinions, is for general information purposes only and it does not take into account your personal circumstances or objectives. This material has been prepared using the thoughts and opinions of the author and these may change. However, FOREX.com does not plan to provide further updates to any material once published and it is not under any obligation to keep this material up to date.
This material is short term in nature and may only relate to facts and circumstances existing at a specific time or day. Nothing in this material is (or should be considered to be) financial, investment, legal, tax or other advice and no reliance should be placed on it. No opinion given in this material constitutes a recommendation by FOREX.com or the author that any particular investment, security, transaction or investment strategy is suitable for any specific person.
The material has not been prepared in accordance with legal requirements designed to promote the independence of investment research. Although FOREX.com is not specifically prevented from dealing before providing this material, FOREX.com does not seek to take advantage of the material prior to its dissemination. This material is not intended for distribution to, or use by, any person in any country or jurisdiction where such distribution or use would be contrary to local law or regulation. For further details see our full non-independent research disclaimer and quarterly summary.