



GBP/USD, DJIA Outlook: Support Levels Meet Oversold Risks
GBP/USD and the Dow test key support levels as rising Treasury yields, Fed rate-hike expectations and oversold momentum increase reversal risks.
Share this:

Rising Federal Reserve rate-hike expectations, higher Treasury yields and renewed dollar strength are increasing downside pressure across markets.
The GBP/USD and Dow Jones charts are now testing defining support levels, while daily momentum indicators point to oversold conditions and potential reversal risks.
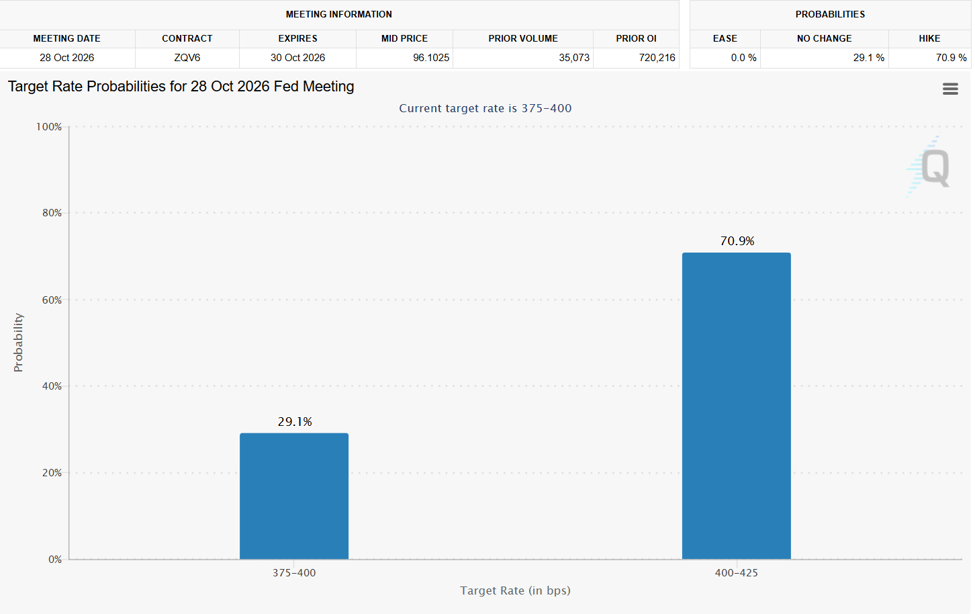
Source: CME FedWatch Tool
The probability of a 25-basis-point rate hike at the October meeting has risen above 70%, according to the CME FedWatch Tool. This has supported the U.S. Dollar Index and helped push it back toward its 2026 uptrend near 101.
Although the latest advance has been steep across currency and bond markets, momentum is becoming increasingly stretched. Important technical patterns are also emerging across major charts:
-
The dollar and euro are testing daily overbought and oversold conditions last seen in June and near yearly extremes, increasing reversal risks below 101 in the DXY and above 1.13 in EUR/USD.
-
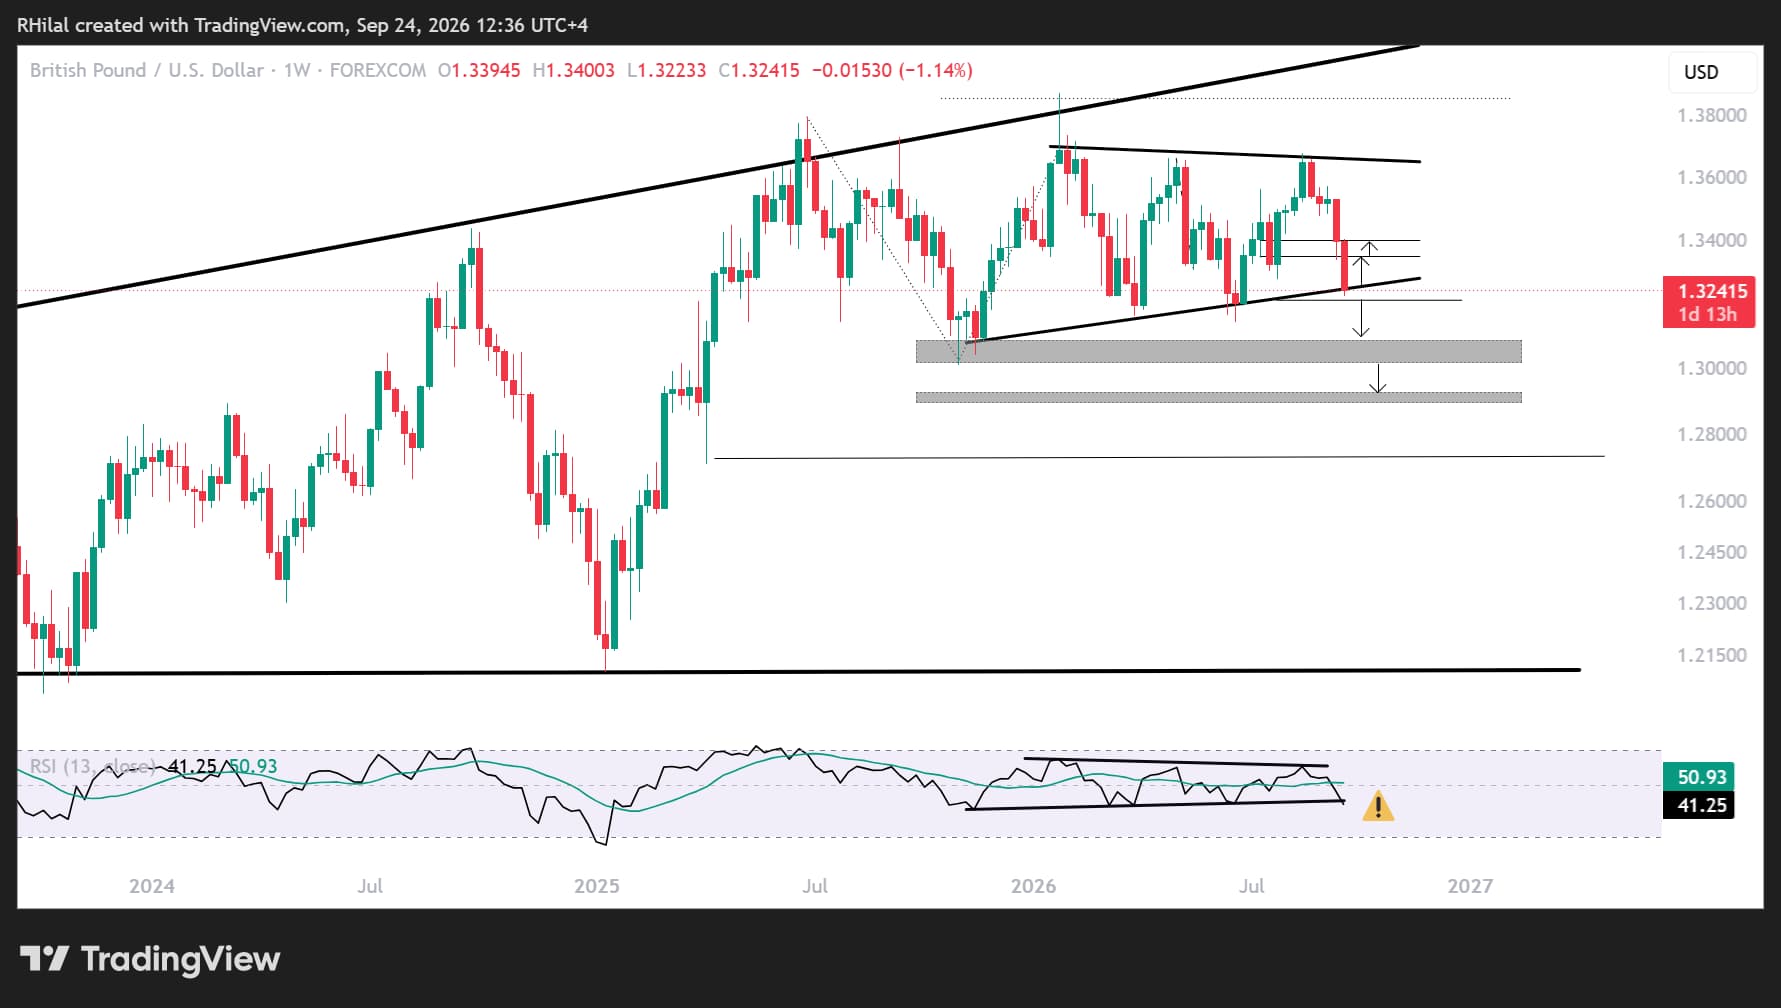
GBP/USD is testing support extending from November 2025 near 1.32.
-
Gold and silver are testing the boundaries of the July–September advance while maintaining their bullish bias, although that structure is increasingly challenged by the resurgence in Treasury yields and the dollar.
-
U.S. indices are experiencing a pullback after the Nasdaq surged by more than 1,000 points this week toward its record highs, while the Dow has extended its decline to 4-month lows.
The broader cross-asset picture is becoming increasingly stretched, with the U.S. 10-year Treasury yield rising toward highs last seen in 2007 and overbought momentum conditions last seen in 2023.
Markets may now be one move away from confirming another wave of distress or reversing the current risk-off pressure.
I go over these charts in my weekly webinars
Register here for the next session
GBP/USD Price Outlook: Weekly Time Frame — Log Scale
Source: TradingView
The GBP/USD chart has been trading within a contracting sideways range since November 2025.
The latest dollar rally has pressured the pound toward the lower boundary of this range, near the yearly lows and the 1.32 area.
A close below 1.3200 would expose 1.3100 and the psychological level at 1.3000, increasing the risk of further downside.
However, oversold RSI readings on both the hourly and daily time frames, combined with year-long support, could help trigger a bullish rebound.
A close back above 1.3340 and 1.3400 would help reinstate the short-term bullish bias.
Dow Jones Price Outlook: Daily Time Frame — Log Scale
Source: TradingView
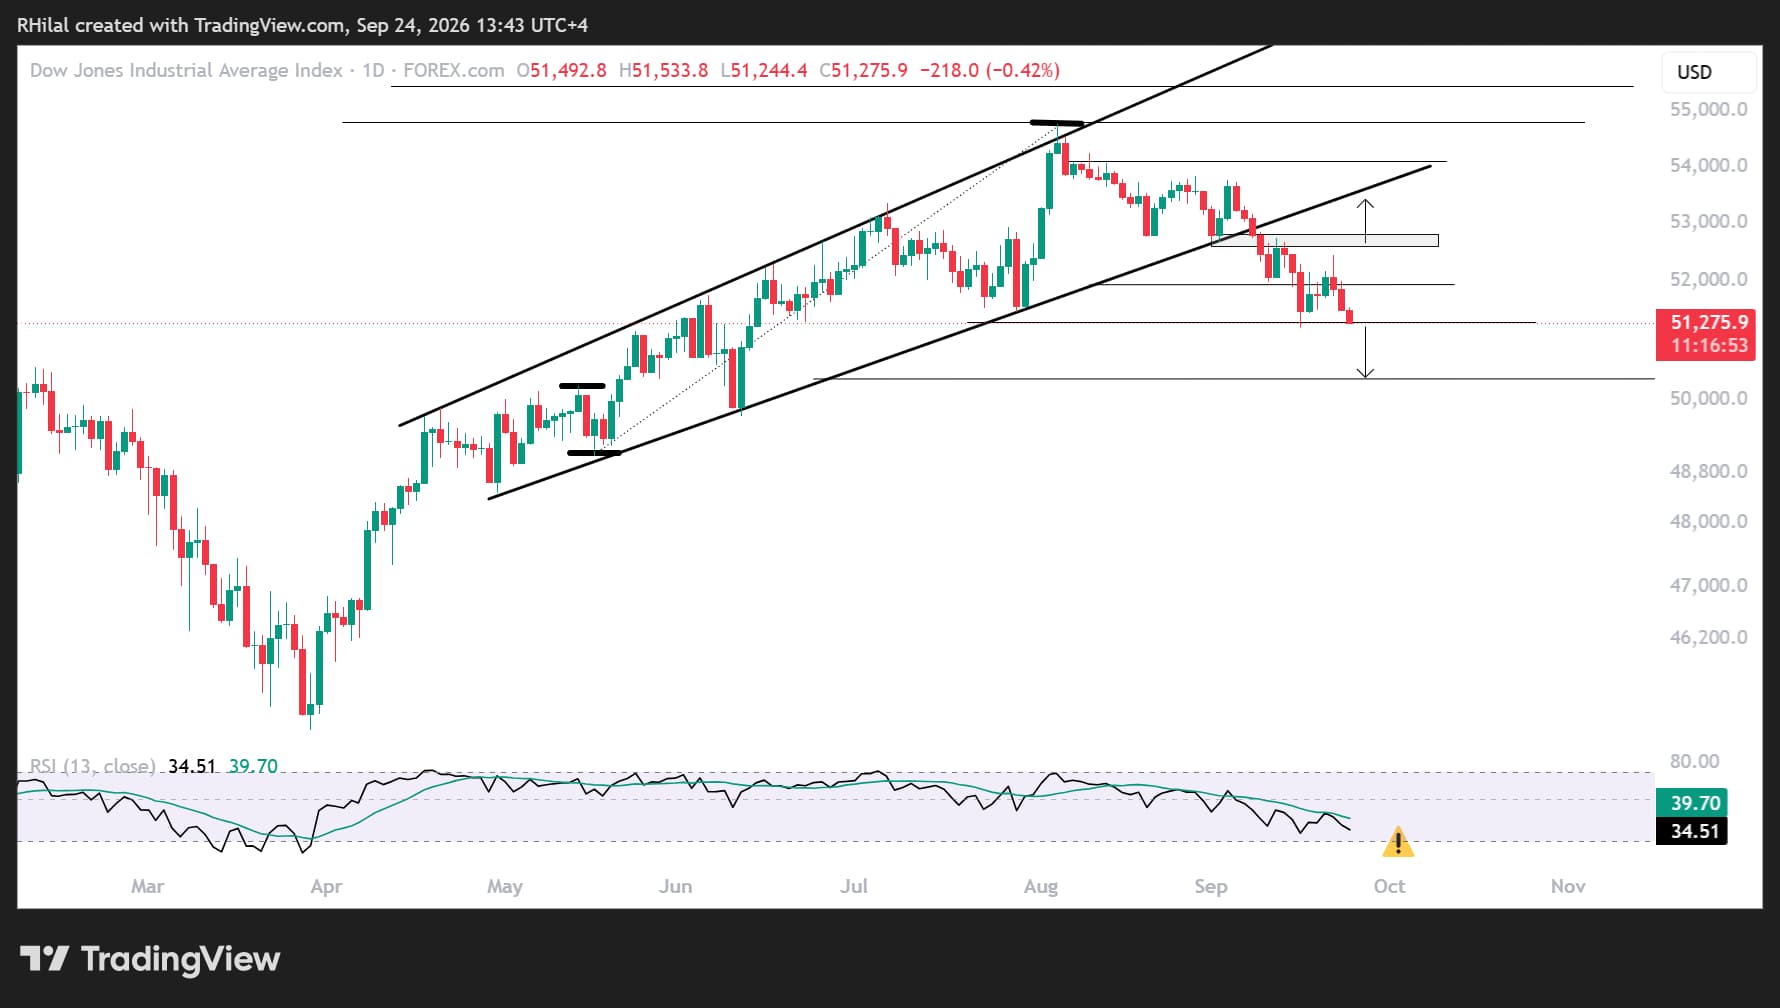
From a daily perspective, the Dow Jones is still holding below the uptrend support line that has been in place since the April 2026 lows.
The index is also holding above the 61.8% Fibonacci retracement of the May–August advance near 51,200.
Bearish scenario: A breakdown below 51,200 would target the 78.6% and 100% Fibonacci retracement levels near 50,300 and 49,000, respectively.
A sustained move below these levels would increase the risk of a broader bearish outlook for the year.
Bullish scenario: Reclaiming 51,900, 52,700 and 53,400 would support the continuation of the bullish bias toward 54,000 and the yearly high near 54,800.
These levels are defined using the Fibonacci extension tool applied to the May–August–September wave.
A move above 54,800 would reinforce the uptrend and expose the trendline connecting the higher highs since April 2026, near 57,000.
The Fed’s tone, U.S. Treasury yields and crude oil’s price direction will likely play a key role in shaping the next potential market trends.
Written by Razan Hilal, CMT
Follow on X: @Rh_waves

Open an account in minutes
Experience award-winning platforms with fast and secure execution.
Economic calendar
Web Trader platform
Our sophisticated web-based platform is packed with features.
Related articles

Bitcoin's Bigger Problem Isn't AI
Bitcoin, semis and even gold are getting hammered. Our research suggests an overlooked macro force may help explain why, with Bitcoin now approaching a major support zone.


US dollar rally loses yield support as Nvidia looms
US yields are retreating, but the dollar isn't following. With risk aversion potentially keeping it supported, Nvidia's results could determine whether emerging reversal signals in AUD/USD and EUR/USD develop further.

GBP/USD, GBP/JPY, GBP/AUD: Sterling Eyes UK Inflation Catalyst
Sterling faces a pivotal UK inflation test as traders weigh BoE tightening, Fed minutes and Australian employment data across GBP/USD, GBP/JPY and GBP/AUD.
StoneX Financial Ltd (trading as "FOREX.com") is an execution-only service provider. This material, whether or not it states any opinions, is for general information purposes only and it does not take into account your personal circumstances or objectives. This material has been prepared using the thoughts and opinions of the author and these may change. However, FOREX.com does not plan to provide further updates to any material once published and it is not under any obligation to keep this material up to date.
This material is short term in nature and may only relate to facts and circumstances existing at a specific time or day. Nothing in this material is (or should be considered to be) financial, investment, legal, tax or other advice and no reliance should be placed on it. No opinion given in this material constitutes a recommendation by FOREX.com or the author that any particular investment, security, transaction or investment strategy is suitable for any specific person.
The material has not been prepared in accordance with legal requirements designed to promote the independence of investment research. Although FOREX.com is not specifically prevented from dealing before providing this material, FOREX.com does not seek to take advantage of the material prior to its dissemination. This material is not intended for distribution to, or use by, any person in any country or jurisdiction where such distribution or use would be contrary to local law or regulation. For further details see our full non-independent research disclaimer and quarterly summary.