
Bitcoin has now posted a five-day losing streak, with bearish momentum becoming increasingly dominant in the short term. The price decline has surpassed 8%, marking one of the most significant drops in recent months. Persistent selling pressure has intensified as risk aversion grows within the cryptocurrency market, driven by global economic uncertainty. As this sentiment continues, Bitcoin, viewed as a risk asset, is likely to remain under downward pressure in the near term.

Is Risk Aversion Rising?
In recent sessions, global markets have adopted a more cautious tone as the trade war between the United States and China continues to escalate. The tariff threats announced last Friday point to potential new duties on Chinese imports — a measure that could directly impact global supply chains and raise import costs across several regions. This development has already started to raise concerns over global economic growth prospects.
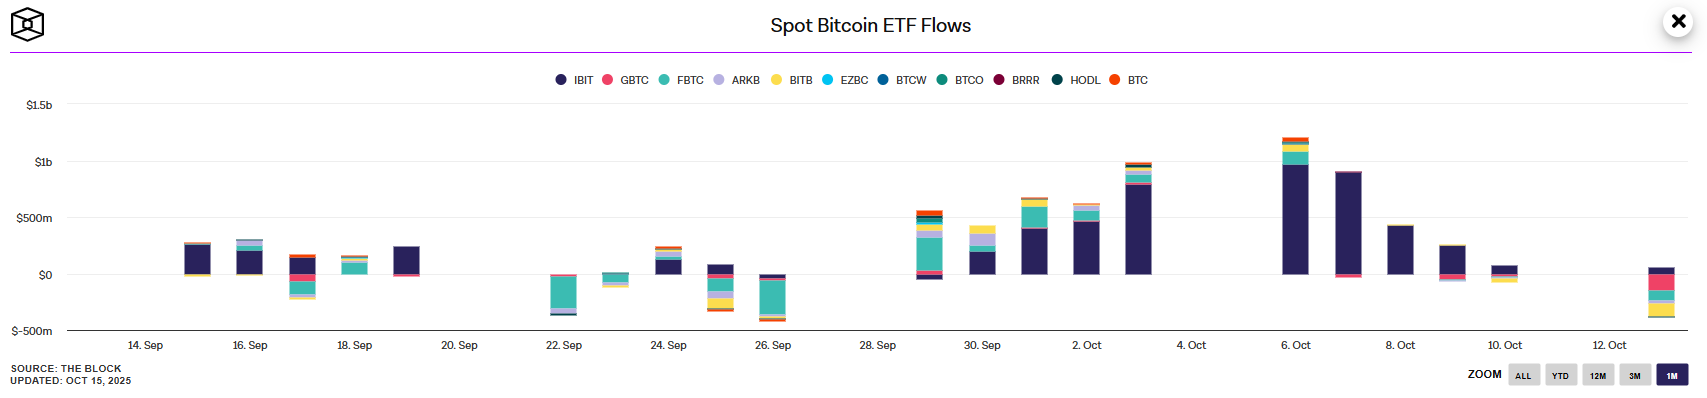
The impact has been felt not only across traditional assets but also in the cryptocurrency market, which weeks ago had assumed the role of a temporary safe haven. However, the market has begun to show a shift in risk appetite, leading to capital outflows from Bitcoin and other risk assets. This is evident in Bitcoin ETF flows, which have shown a decisively bearish trend in recent sessions. According to the latest data from October 13, there was an outflow of approximately $386 million from Bitcoin-linked ETFs, confirming that demand for the cryptocurrency has been affected by the prevailing risk sentiment in the markets over the past few sessions.
Source: Theblock
This capital flight is the result of investors, faced with renewed risk aversion, reallocating funds into safer assets and reducing exposure to volatile instruments such as Bitcoin. If this trend continues and market indecision persists, selling pressure is likely to remain dominant in the BTC market in the short term.
How Is Market Confidence Holding Up?
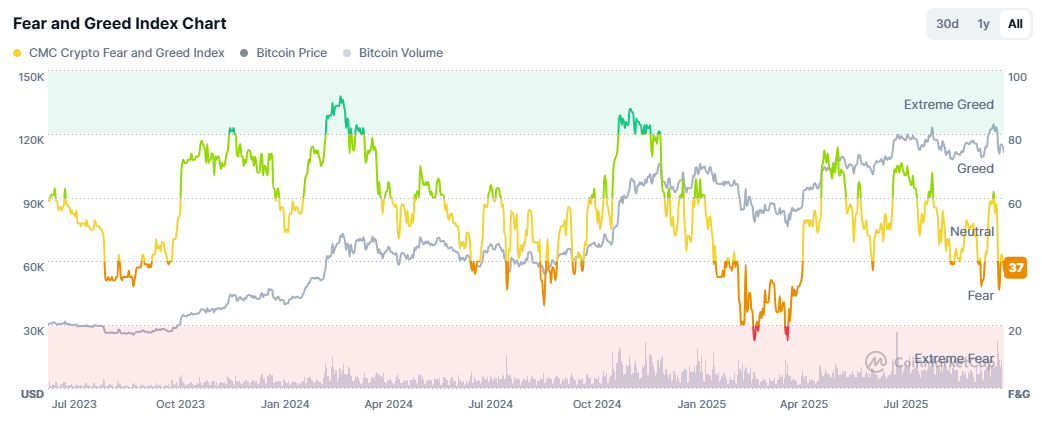
The current economic uncertainty has also affected Bitcoin’s overall market sentiment, as shown by the Fear & Greed Index, which continues on a steady downward trajectory, now standing at 37 points, entering the “fear” zone. This indicates a gradual erosion of confidence in the cryptocurrency market in the short term.
Source: Coinmarketcap
The continued decline in confidence suggests that Bitcoin demand has weakened significantly, prompting capital outflows and profit-taking from several positions. If the index remains in negative territory, this could further undermine market sentiment, limiting sustained demand and maintaining notable selling pressure on BTC in the coming sessions.
Technical Outlook for Bitcoin
Source: StoneX, Tradingview
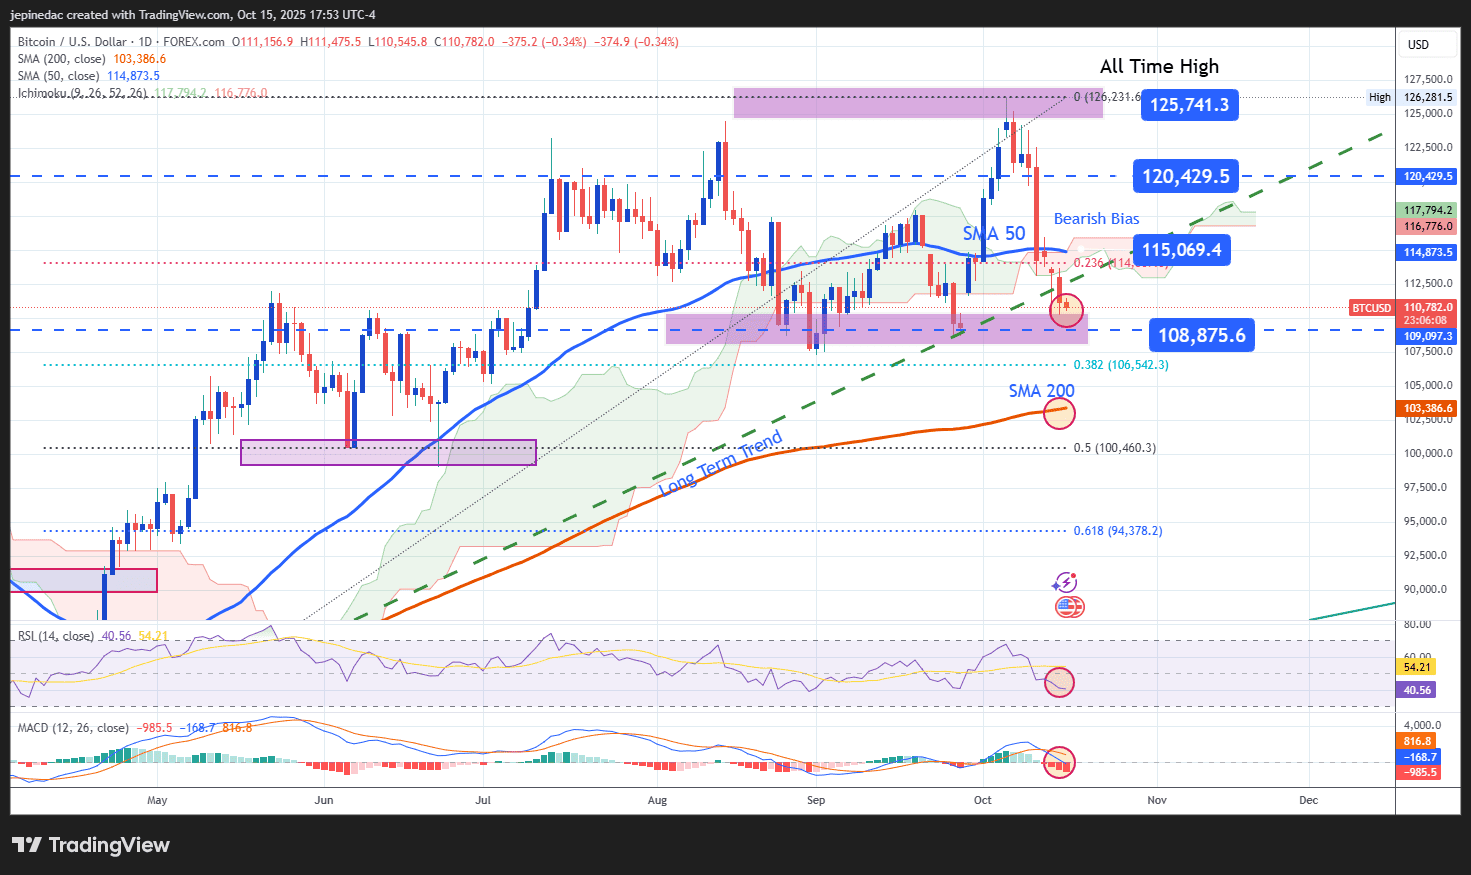
- Uptrend at Risk: The bullish trendline, which had held firm in recent weeks, has started to break down, as the bearish bias strengthens in the short term. For now, the price appears to have stabilized within a lateral range between $120,000 and $108,000 per BTC, where the most significant retracements of recent months have occurred. If the bullish momentum fails to recover, price indecision could increase, putting the uptrend structure that aimed for new highs at risk.
- RSI: The RSI line continues to oscillate below the 50 level, indicating a dominant bearish momentum over the past 14 sessions. If the RSI keeps trending lower, selling pressure could remain consistent in the near term.
- MACD: Similarly, the MACD histogram remains below the zero line, showing that the average strength of short-term moving averages continues to reflect a bearish bias. If the histogram continues to diverge from the neutral level, it could lead to a more aggressive selling scenario in the coming days.
Key Levels:
- $120,000 – Major Resistance: Represents the most significant retracement area of recent weeks and serves as the primary barrier for buyers. A move back above this level could revive the bullish bias and reactivate the trendline seen in prior months.
- $115,069 – Near-Term Barrier: Aligns with the 50-period moving average and the Ichimoku cloud, forming an intermediate support zone where sideways consolidation may occur.
- $108,000 – Critical Support: Marks the lower boundary of the current lateral range, aligned with key retracement zones seen since May. A break below this level would confirm a structural shift in trend, signaling the start of a new bearish phase in the short term.
Written by Julian Pineda, CFA – Market Analyst
Follow him on: @julianpineda25