Bitcoin, BTC/USD, Gold Talking Points:
- Gold is controversial as an investment asset because it carries no yield and pays no dividend, but it’s most important quality is perhaps what governments cannot do to it, which is dilute it with further spending and currency printing.
- Gold trading shifted in the Financial Collapse backdrop which drove the metal towards the $2k/oz level, but it wasn’t until 2020 that that price could come into play. Interestingly once it did, gold went into a range for the next three and a half years. Meanwhile, Bitcoin came to life as a competitor for anti-fiat flows and when gold rallies calmed last year and again this year, investors flocked into BTC/USD.
- With gold showing resistance at the $4k/oz level, the question now is whether the metal is going to take a breather, which could benefit Bitcoin.

It's difficult to consider Bitcoin a laggard by any stretch of the definition. But, if we compare it to gold so far this year, it is, as the rally has been about half of what’s shown in Gold so far in 2025 trade (gold is up 51.93% against Bitcoin’s current 26.1% so far in 2025).
Gold (blue) v/s Bitcoin (red) in 2025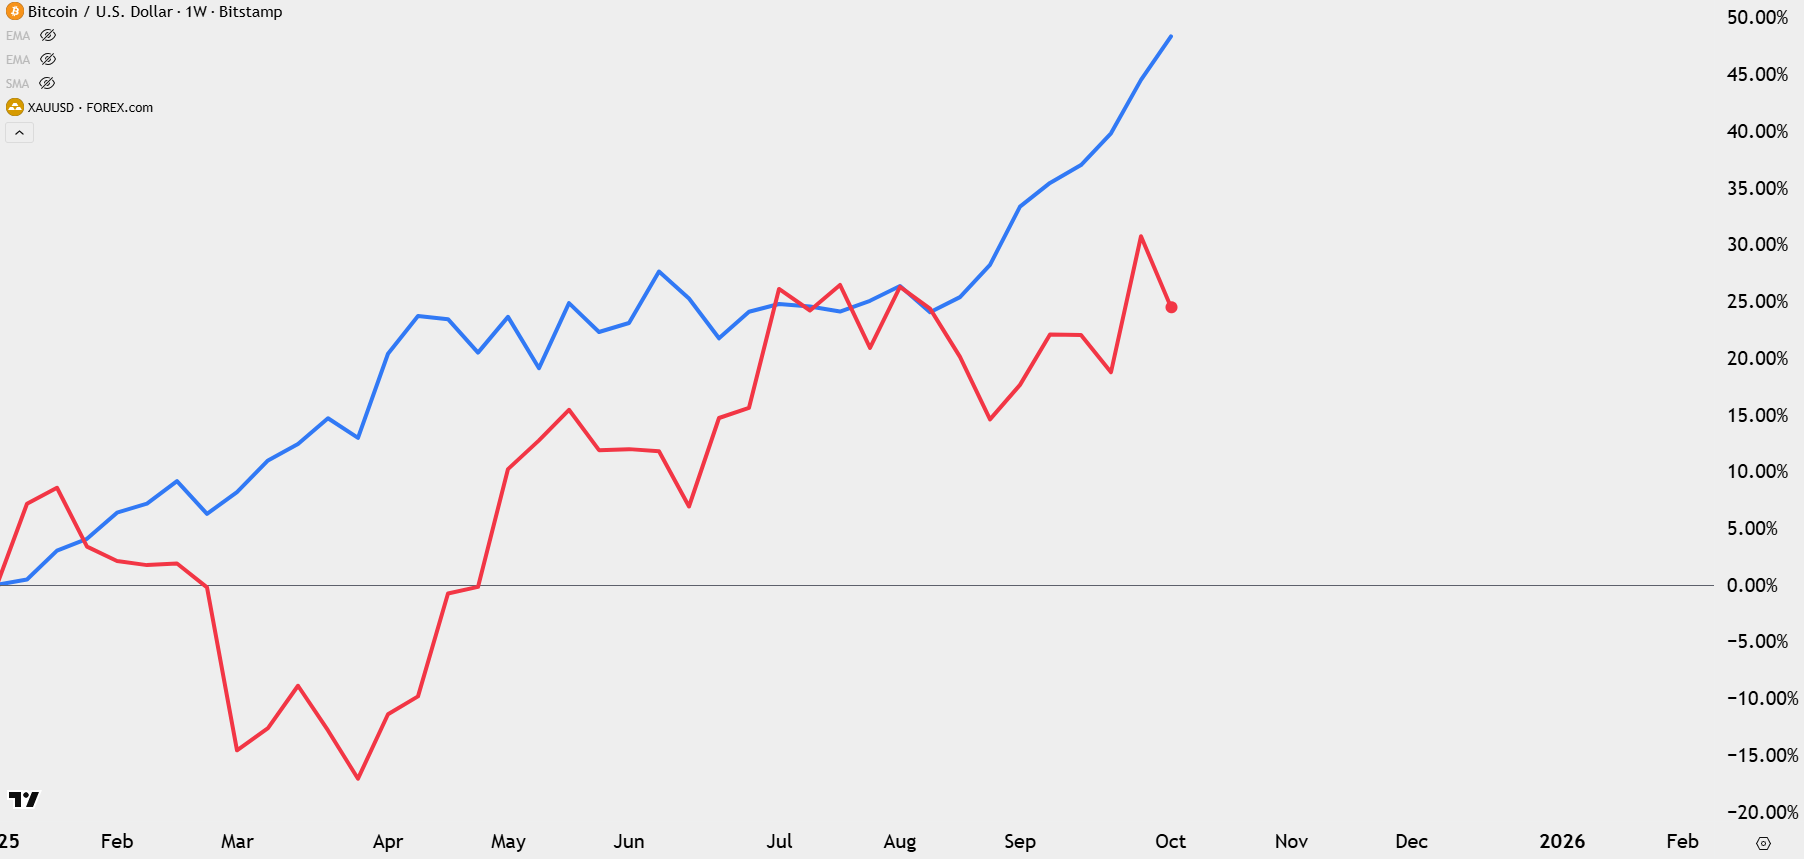
Chart prepared by James Stanley; data derived from Tradingview
The reason behind the push in both markets has been a Federal Reserve willing to cut rates even with inflation remaining high. This speaks to debasement in fiat currencies that isn’t quite so noticeable if we measures currencies against each other, as a similar form of dilution can show elsewhere as global central banks become more accepting of lower real rates of return. As a case in point, in Japan they’re talking about stimulus even with inflation remaining at a high level, something that seemingly backs the Bank of Japan further into a corner and makes it more difficult to tighten policy to reign in inflation.
And from the comments of President Trump, this doesn’t seem to be an item relegated to Japan – or the US – as President Trump has said, “we are becoming a country that is so rich, so powerful, with the kind of growth we have now, the debt is very low, relatively speaking. You grow yourself out of that debt.”
This doesn’t seem to even be in the ballpark of fiscal prudence and to be sure, this isn’t the first insinuation of pedal-to-the-floor monetary policy, and it’s not relegated to President Trump’s pro-growth drives; as it was Austan Goolsbee’s comment last February, a day after CPI came in above expectations again, when he seemingly dismissed high inflation to instead hint at rate cuts down-the-road. And then in September the Fed cut rates even with inflation remaining above target.
The market responded in a rude way, with higher Treasury yields and a stronger US Dollar, to the point where the Fed had to step back from rate cuts in early 2025. But, they’re right back at it after the cut a couple weeks ago – and it was Powell’s speech at Jackson Hole opening the door for that move when both Gold and Silver started their parabolic runs that continue today.
In Bitcoin, the response has been more muted – at least so far – but that doesn’t necessarily mean that it will continue in that way.
At this point it’s the 125k level that’s acting like a brick wall in Bitcoin, and given the longer-term trend seeing resistance at a psychological level of that nature makes sense. The bigger question is for how long it draws in sellers – to the degree that it restrains bullish continuation scenarios. This would be similar to how 120k had acted back in July.
Bitcoin Daily Price Chart
Chart prepared by James Stanley; data derived from Tradingview
Bitcoin as a Gold Alt
If a slow response to the Fed’s start of a cutting cycle seems pessimistic, it shouldn’t, as it would resemble the way both gold and Bitcoin reacted in the aftermath of the Fed’s first rate cut last year.
And perhaps more importantly, we can draw back to the source of much of today’s monetary drive – Covid – to evaluate the way Bitcoin reacted. When the Fed threw the kitchen sink at the economy in April and May, it was gold that initially rallied – finally testing the $2k/oz level for the first time ever in early-August of 2020.
But that major psychological level (perhaps not too different than 125k in Bitcoin right now, on a different time basis) was too much for bulls to plow through. It led to profit taking, and a pullback. At the time that gold tested above $2k for the first time ever, Bitcoin was struggling to get back above 12k.
And then as gold spent the next three-and-a-half years ranging, with $2k holding as resistance, Bitcoin went through a couple of different cycles that found fresh all-time-highs. It was as if the preferred anti-fiat vehicle had suddenly and quickly shifted away from gold and into Bitcoin.
That’s not an isolated incident, as last year saw a similar scenario as noted above, around the Fed’s first rate cut of 2024. Initially Bitcoin was restrained while Gold broke out to fresh highs. But it was just one week ahead of the Presidential Election that gold pulled back from resistance, building a bull pennant into the final two months of the year. And, again, Bitcoin came to life in a very big way.
And even this year – spot gold hit a fresh high of $3500/oz in April, and then stalled, building another bull flag that remained in-play into the Jackson Hole Economic Symposium. As that digestion was showing in gold, as bulls pulled back from the throttle – Bitcoin again came back to life in a bit way, rushing up to another fresh all-time-high.
So, if we are in an environment where the bullish trend in gold may calm, Bitcoin can be one of the larger beneficiaries of that as anti-fiat flows shift into the cryptocurrency and away from an overbought backdrop in gold.
Bitcoin Monthly Chart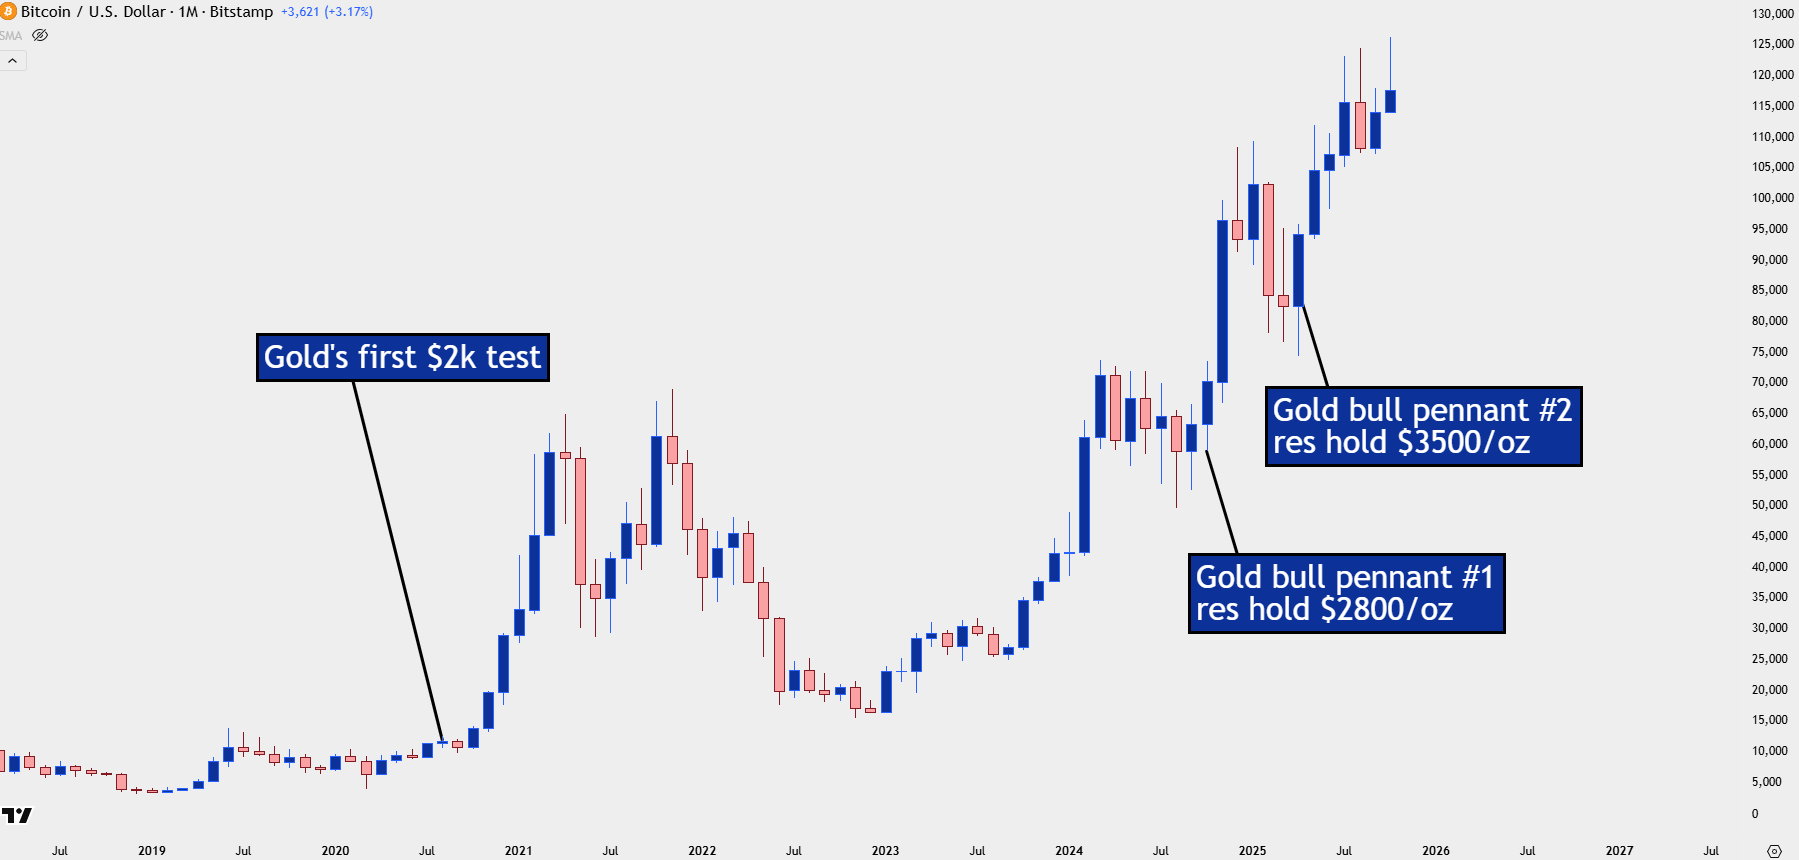
Chart prepared by James Stanley; data derived from Tradingview
Bitcoin Structure
To be sure Bitcoin and gold are different assets and different markets. They can share some drive and motivators, but ultimately the largest driver of price is going to be supply and demand and for that, positioning and sentiment matter quite a bit.
In Bitcoin, this carries more weight as there’s long-term holders and true believers in the cryptocurrency movement that can be perhaps even more motivated to take profits on tests of fresh big figures – just like we’ve seen at 125k.
But the true test of trend isn’t what happens at trend extremes – it’s what happens at pullbacks, in counter-trend scenarios. And despite the lack of strength above the 120k level that’s shown since July, there has been a hold of higher-lows, and this can present possible opportunity for bulls.
To illustrate acceptance of these new higher prices, we can look back to May and June, when the 110k level was acting as resistance. This is when bulls were taking profits and that was leading to a pullback. But, that pullback was limited to 100k, at which point buyers came in to support the market, thereby leading to support and a higher-low.
The next wave led to a fresh ATH and a push up to 120k, which, again, led to sellers and pullbacks. But it’s what happened in August and September that’s pertinent for right now, as we saw buyers coming in at higher-lows around that 110k level – illustrating support from prior resistance while also showing acceptance of 110k. And, eventually, a push up to 125k.
Bitcoin Weekly Price Chart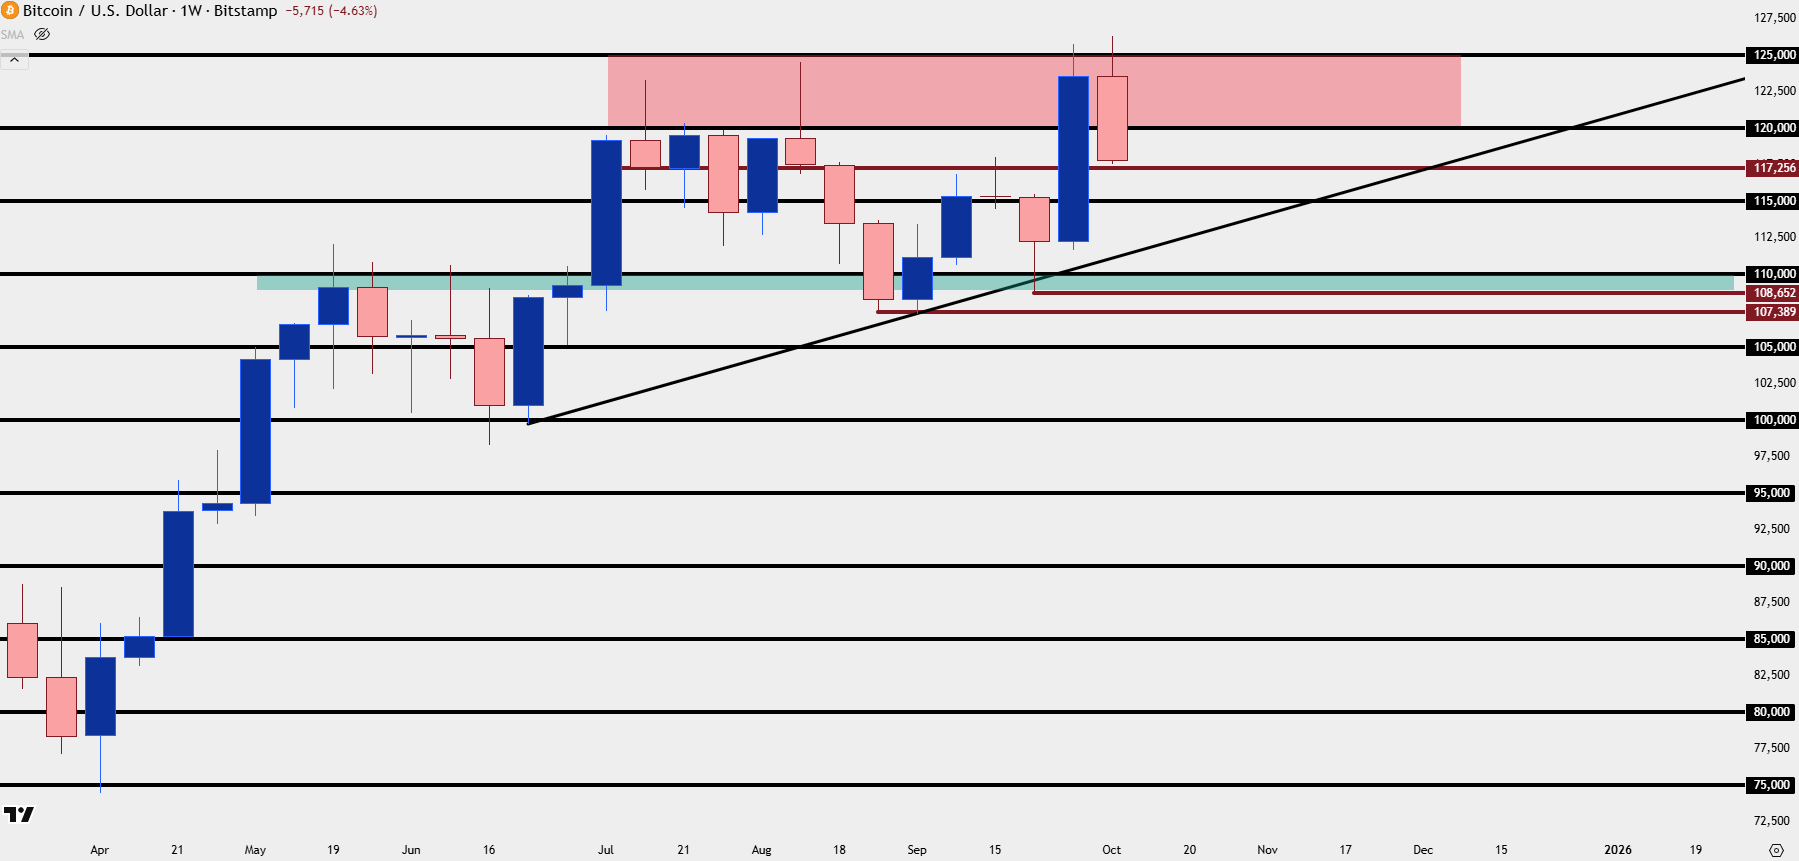
Chart prepared by James Stanley; data derived from Tradingview
BTC/USD Shorter-Term Strategy
Going down to the daily chart, we can pick out a few additional support levels. Nearby is the spot that I talked about in the Wednesday article, 117,256. This is an area of prior support turned-resistance, and ideally, bulls will remain aggressive enough to defend this level as a support. But, if that doesn’t happen, the 115k level sits just below and this has already shown some short-term support that couldn’t quite hold.
If that fails, then the next look is on the 110k level where we have the higher-low from August and September and this is the main area that bulls need to defend, or else deeper pullbacks seem more likely. But the higher-low structure thus far is 107,488 up to 108,652, so again, ideally, buyers will step in ahead of either of those levels being tested with reference around the 110k handle.
BTC/USD Four-Hour Chart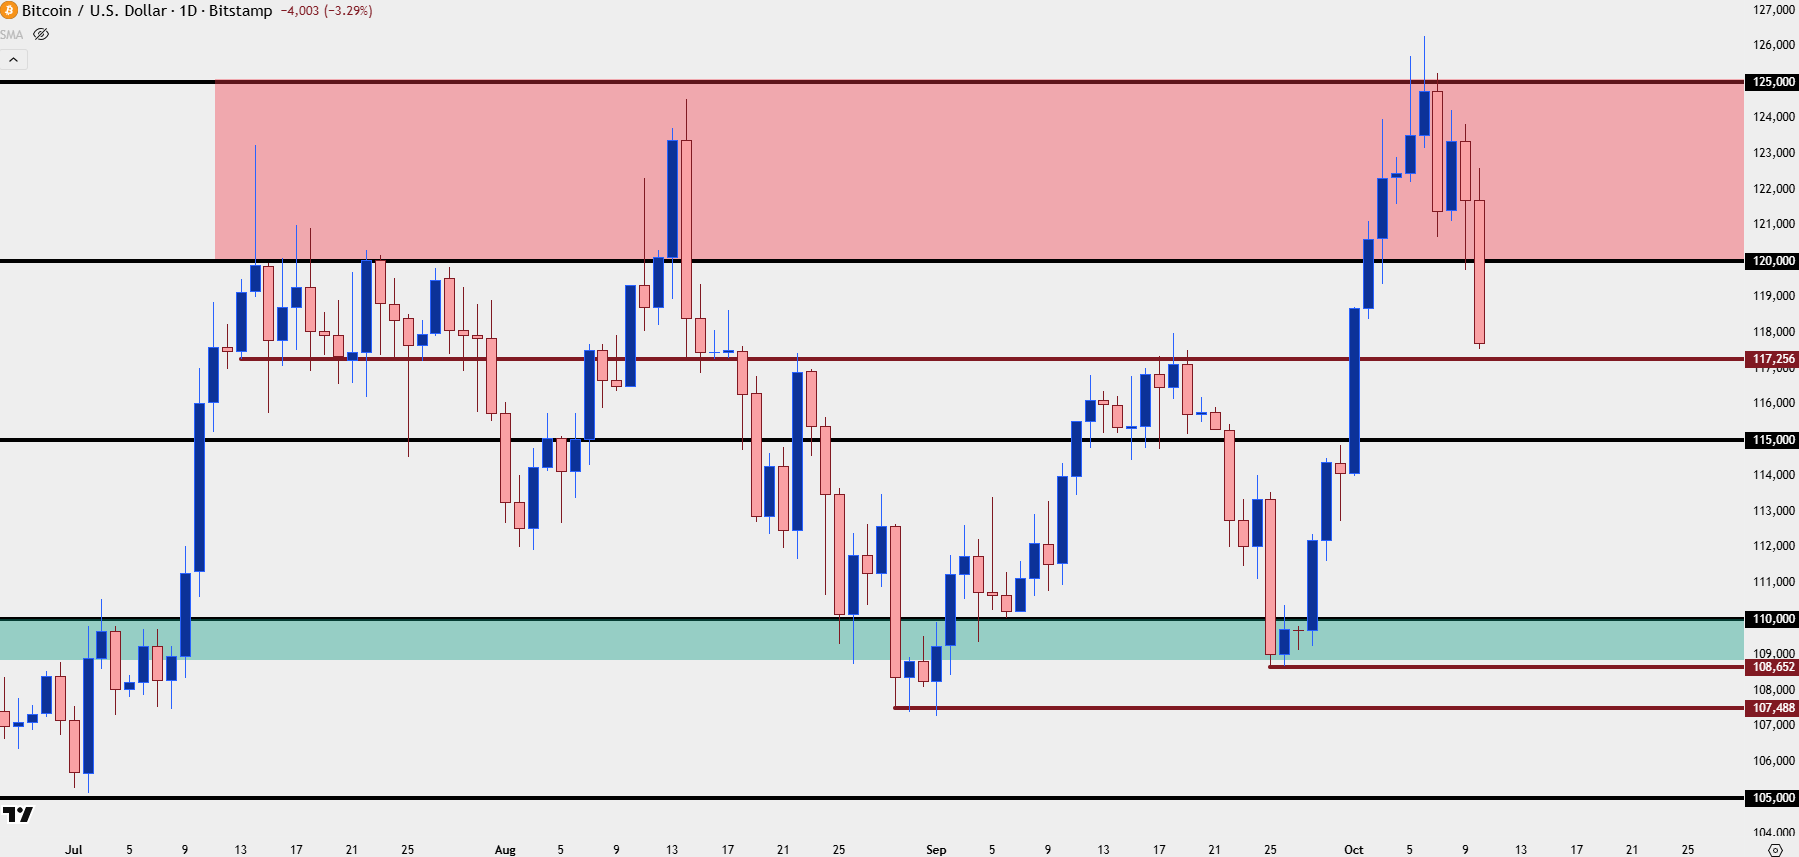
Chart prepared by James Stanley; data derived from Tradingview
--- written by James Stanley, Senior Strategist