


WTI and Brent continue to trade within the $90–$100 range, supported by IEA and Russian supply alternatives, while maintaining upside risks for inflation as tensions around energy infrastructure and the Strait of Hormuz persist.
The Fed is expected to deliver its rate decision and economic outlook today during the FOMC meeting, as the DXY holds above the 99.50 support. This keeps global indices on a cautious uptrend, while the dollar shows signs of a mild pullback. Wait-and-see scenarios, in line with rate hold expectations, are anticipated to gradually absorb inflationary shocks stemming from energy and petrochemical supply disruptions, which are expected to reflect in consumer prices within 4–8 weeks should the conflict persist.
Below are three possible scenarios for the Strait of Hormuz and crude oil price action, followed by long-term and technical outlooks for Brent and WTI:
- Scenario 1 — Rapid de-escalation (low probability)
Naval escorts become operational by the end of March, a ceasefire framework emerges in Q2, and tanker confidence gradually returns. Brent retraces below the June 2025 conflict highs toward $75, unwinding the geopolitical risk premium. This remains the least likely outcome, as Iran’s leadership has been explicit about keeping the Strait closed, and no credible resolution framework is currently in sight.
- Scenario 2 — Prolonged disruption, partial bypass (medium probability) The Strait remains effectively closed through H1 2026. Pipeline workarounds and IEA reserve releases provide only partial relief, with 400 million barrels covering roughly 20 days of normal Strait flows. Crude holds in the $90–$110 range, inflation pressures build globally, and Russia deepens its role in Asian markets as a structural beneficiary of Gulf supply disruptions. The full inflation impact through petrochemicals, plastics, and fertilizers is still 4–8 weeks away from fully feeding into consumer prices, suggesting that the worst of this scenario, including potential global market drawdowns, may still lie ahead.
- Scenario 3 — Full closure with key infrastructure strikes (increasing risk)
Iran expands its targeting to include bypass alternatives and critical energy infrastructure, lifting risk sentiment and crude prices higher. Central banks face a stagflationary backdrop, while recession risks rise sharply. From a technical perspective, a sustained break above $115 on WTI and Brent opens the path toward $130, with $150 in scope. Futures markets continue to underprice this risk, as reflected in the $38 premium of physical Dubai crude over paper markets.
Technical Analysis: Quantifying Uncertainty
Brent Price Outlook: 2-Week Time Frame – Log Scale

Source: Trading view
Brent price action is currently stalling below the 2022 highs and the 118 resistance, aligned with the 50% Fibonacci extension of the trend between 69.20 in February 2026, the 118 peak, and the recent 98 low. Three zones are outlined on the chart in line with the previous scenarios:
- Bullish scenario: a close above 115 and 118 boosts price action toward 125, 130, and 150, in line with Fibonacci extension levels of 61.8%, 78.6%, and 100%.
- Short-term bearish scenario: the base case remains the stable range between 98 and 110. A close below 98 supports a short-term correction toward the 2023 highs near 93.60 and the 2024 highs near 88, before re-exposing the June 2025 highs, with resistance aligning near the 78 mark from the previous Middle East conflict.
- Long-term bearish scenario: a close below last year’s conflict highs, under 78 and 75, extends consolidation risks toward 74 and 69 respectively.
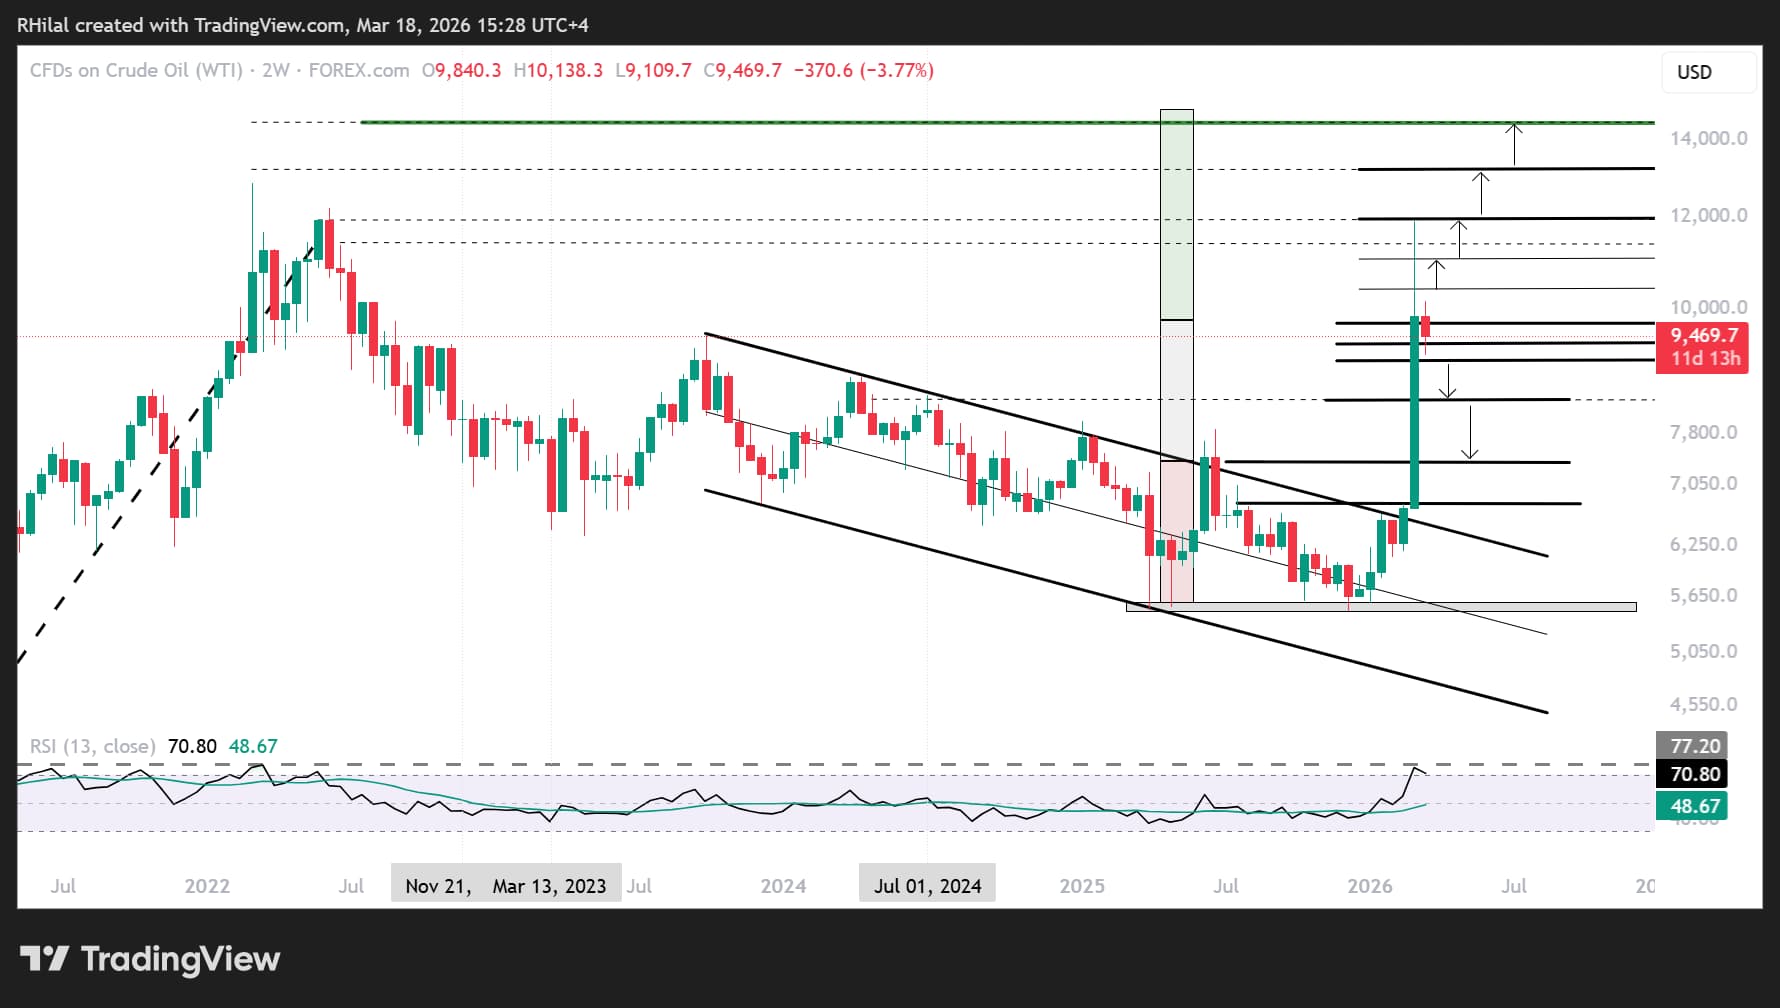
WTI Price Outlook: 2 Week Time Frame – Log Scale
Source: Trading view
In line with the Strait outlook and Brent price action, the WTI scenarios are as follows:
- Bullish scenario: a close above 98 extends upside risk toward 105, 110, 132, and 150 respectively.
- Short-term bearish scenario: the base case remains the stable range between 93 and 98. A close below 93 supports a short-term correction toward the 2023 highs near 90 and the 2024 highs near 84, before re-testing the June 2025 highs, with resistance aligning near the 75–73 range from the previous Middle East conflict.
- Long-term bearish scenario: a close below last year’s conflict highs, under 75 and 73, extends consolidation risks toward 67.
Written by Razan Hilal, CMT
Follow on X: @Rh_waves






