


Key Events to Watch this Week:
- Impact of Central Bank Outlooks: FOMC, BoC, and BoJ meetings and their influence on market sentiment and oil demand projections
- Mega-Cap Tech Earnings: Results from Meta, Facebook, Amazon, and Apple and their effect on global risk appetite
- Trade Deal Developments: Geopolitical friction involving US–China and US–Russia trade relations
- Key US and Chinese Economic Indicators: US Advance GDP, FOMC (Wednesday), Chinese Manufacturing PMI (Thursday), US NFP, ISM PMI (Friday)
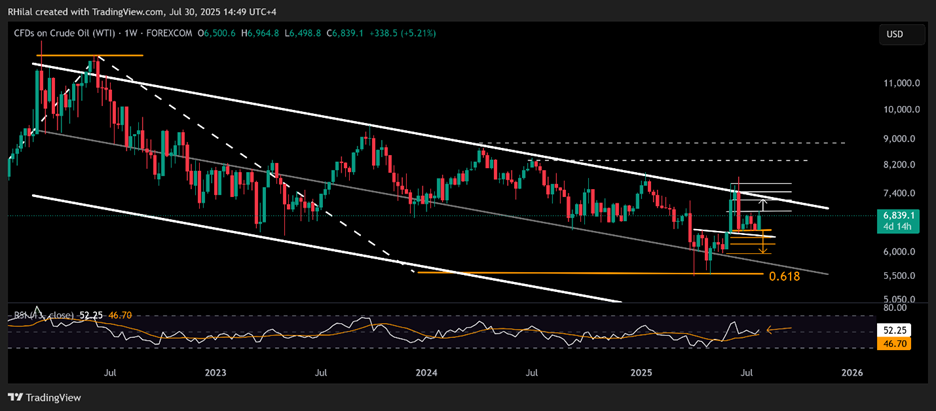
While crude oil prices trend within the borders of a 3-year down-trending channel, they recently shored up toward the $69 mark on trade deal developments—ranging from US-EU positive progress, US-Russia sanction threats tied to the Ukraine war, and US-China rival demands to settle the trade deal on their own terms.
The most notable trade negotiations are between the US and China. Meanwhile, Russia has consistently relied on redirecting oil exports towards Asia to offset the impact of US sanctions. When it comes to the US and China, the world’s largest economies aim to maintain a stable trading relationship while applying barriers such as tariffs and export controls to curb each other’s progress in critical sectors, including rare earth minerals and tech inputs (Bloomberg). The US-China trade deal may set the stage for global economic growth projections and their impact on commodity demand.
As for inventories and the summer season, crude oil stockpiles recorded a sharp drop in July, falling from 6-month highs with a shift of +7.1 million barrels down to -3.2 million —supporting price gains and aligning with OPEC's 2025 supply cut unwind strategy. This confirms OPEC’s strategic start to easing production cuts, which has now been accompanied by an oil price increase of approximately $15 per barrel.
Technical Analysis: Quantifying Uncertainties
Crude Oil Outlook: Weekly Time Frame – Log Scale
Source: Tradingview
Although news points to a crude oil price surge, technical analysis indicates price cap risks remain within the borders of a 3-year descending channel. Should a clear hold emerge above the $70 barrier, the bullish rebound in price action from the $64.40 zone, in line with the weekly RSI’s rebound off the neutral 50 zone, may extend toward the channel’s upper boundary at $72.40, $74.40, and $77 in more extreme scenarios.
A confirmed hold above the $77–78 zone may shift the primary trend away from bearish dominance and pave the way for longer-term bullish forecasts. On the downside, if a price drop results in a clean break below the $64 barrier, downside risks may extend toward the mid-zone of the long-standing channel, with potential support levels at $63.20, $61.80, and $59.70, respectively.
Written by Razan Hilal, CMT
Follow on X: @Rh_waves






