
The bearish-to-neutral setup across crude oil charts and the energy sector ETF remains valid for the week. OPEC has kept November quotas steady, Gulf exports have recovered to near prewar levels of 23.3 million barrels per day, and US crude inventories have continued to rise gradually, with a 922,000-barrel increase last week. WTI and Brent prices remain below their respective seven-month barriers, while the XLE Energy Select Sector SPDR Fund has pulled back below 18-year resistance.
The geopolitical conflict between the US and Iran remains ongoing, as does the uncertainty surrounding it. However, much of the impact appears to be capped. Signs of slowing demand are emerging alongside rising US crude inventories and a recovery in Gulf exports. The neutral-to-bearish setup is therefore expected to persist for another week, with key levels in focus to confirm either further de-escalation or renewed escalation.
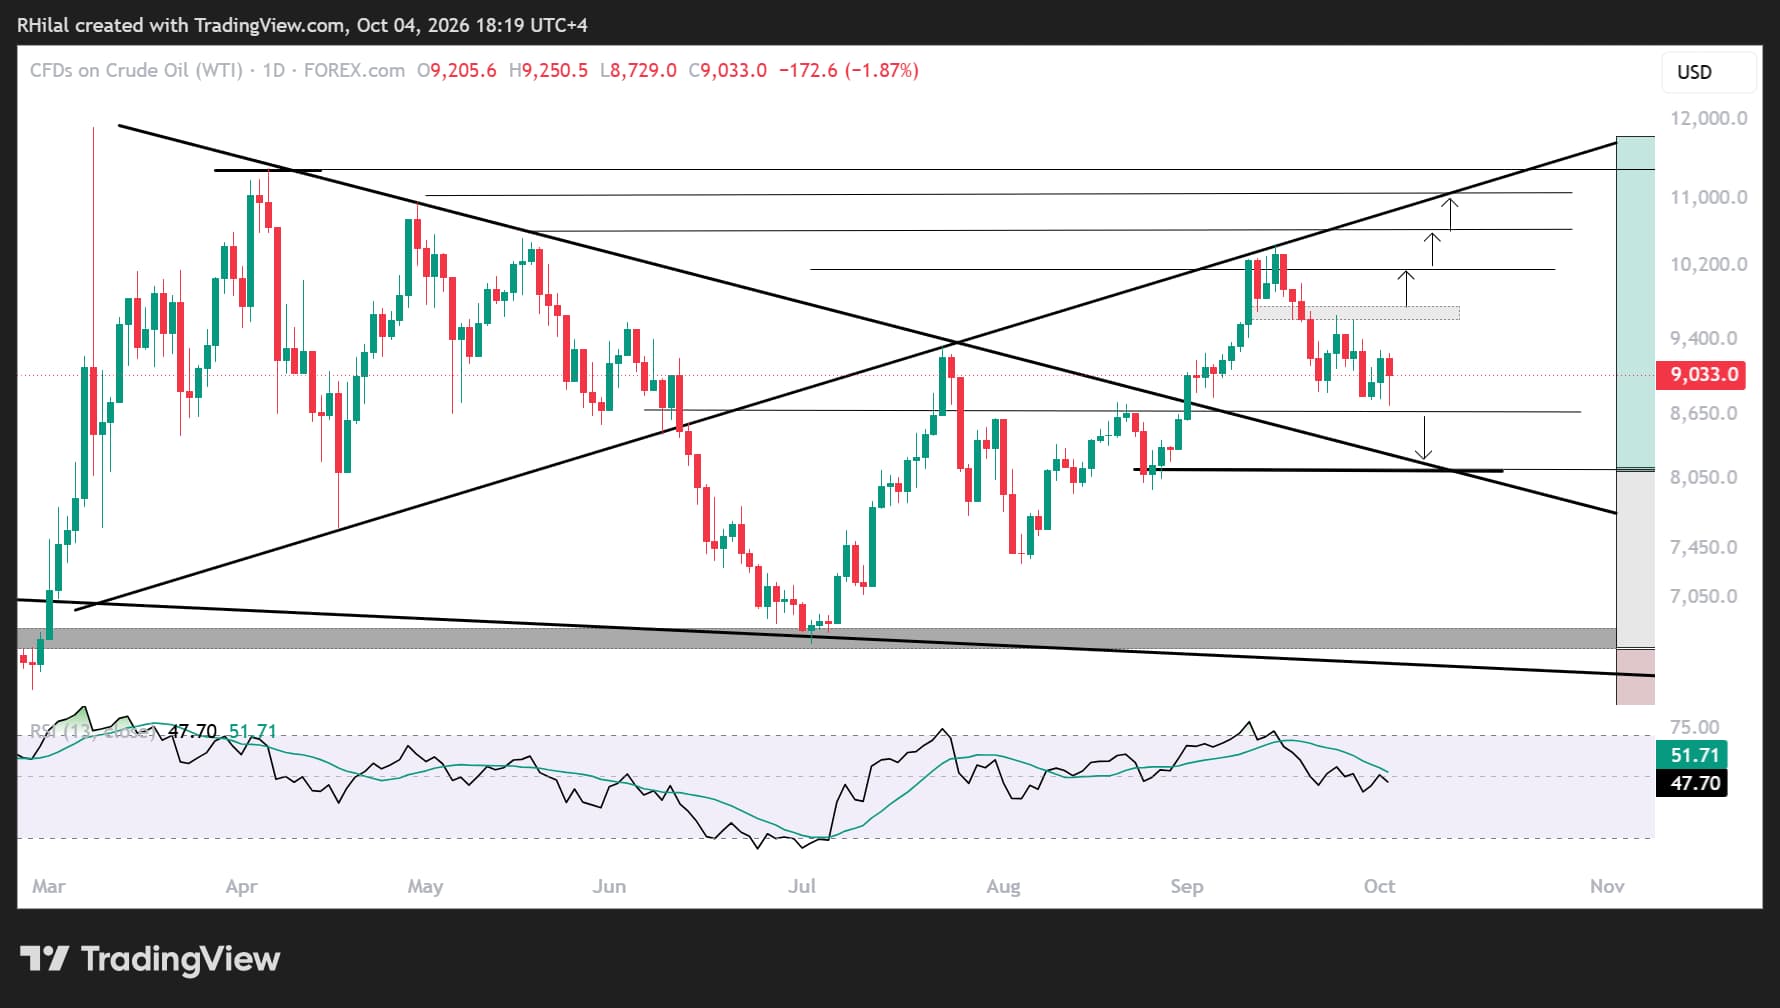
Crude Oil Weekly Outlook: WTI — Daily Time Frame, Log Scale
Source: TradingView
On the daily chart, WTI crude oil shows a bearish bias in both price action and the RSI. The daily RSI remains below its moving average and the neutral 50 level, while price continues to hold below the July 2026 high of 94.
If the wave from the March high to the July low and then the September high is corrective, a break below 86.60—the 38.2% extension of this wave—could target the 50% level near 81. This could present another potential dip-buying opportunity, as the level aligns with previous resistance connecting the lower highs between March and September. A further break lower would confirm a longer-term de-escalation scenario, with potential targets near prewar levels at 75 and 68.
To the upside, a move back above 94 and 97, followed by a break above the psychological 100 level, could expose the September high near 105. This may bring renewed pullback risk or confirm the potential for a longer-term bullish move toward the yearly highs.
Current bias: Bearish to neutral
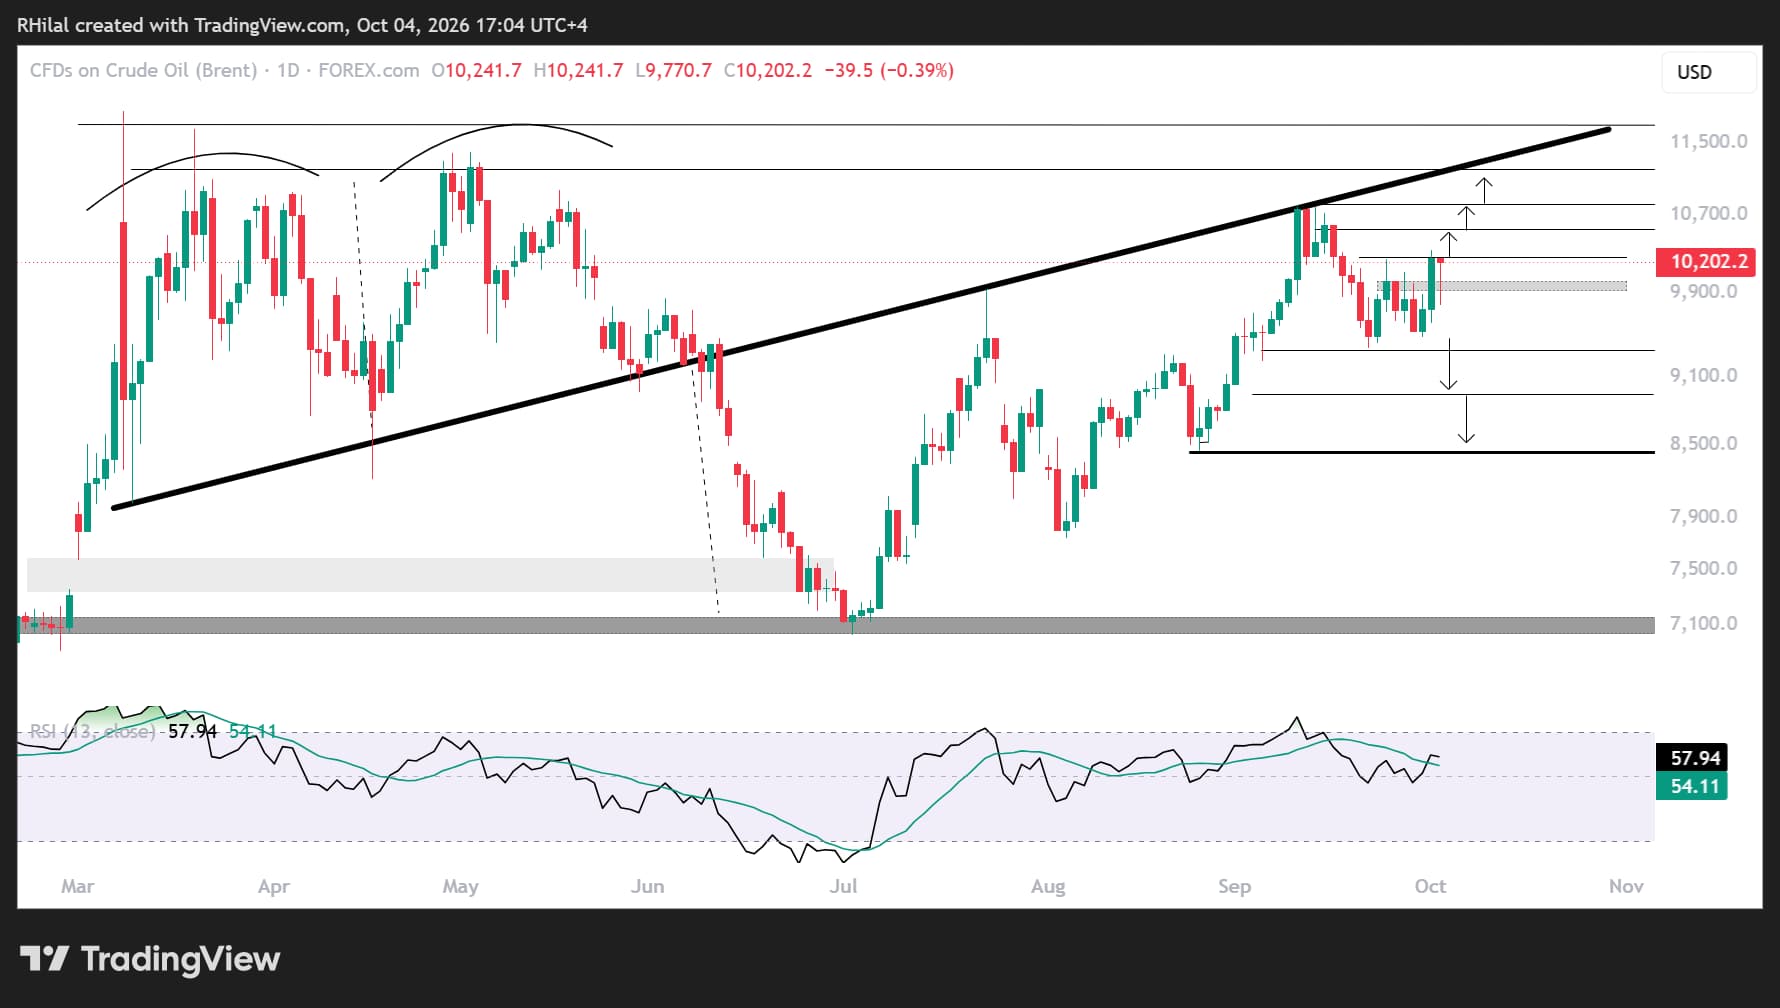
Crude Oil Weekly Outlook: Brent — Daily Time Frame, Log Scale
Source: TradingView
On the daily chart, Brent crude oil shows a neutral bias in both price action and the RSI. The daily RSI remains above its moving average and the neutral 50 level, while price holds above the July 2026 high of 99. However, it remains about 4% below the September high.
If the move from the August 26 low to the September high is an impulse wave, a break below 93.30—the 61.8% retracement of this wave—could target the 78.6% level near 89, followed by the 100% level near 84. These levels could offer another potential dip-buying opportunity. A further break lower would confirm a longer-term de-escalation scenario, with potential targets near prewar levels at 72 and 70.
To the upside, a move back above 103, followed by a break above 105.30, could expose the September high near 108. This may bring renewed pullback risk or confirm the potential for a longer-term bullish move toward the yearly highs.
Current bias: Bearish to neutral
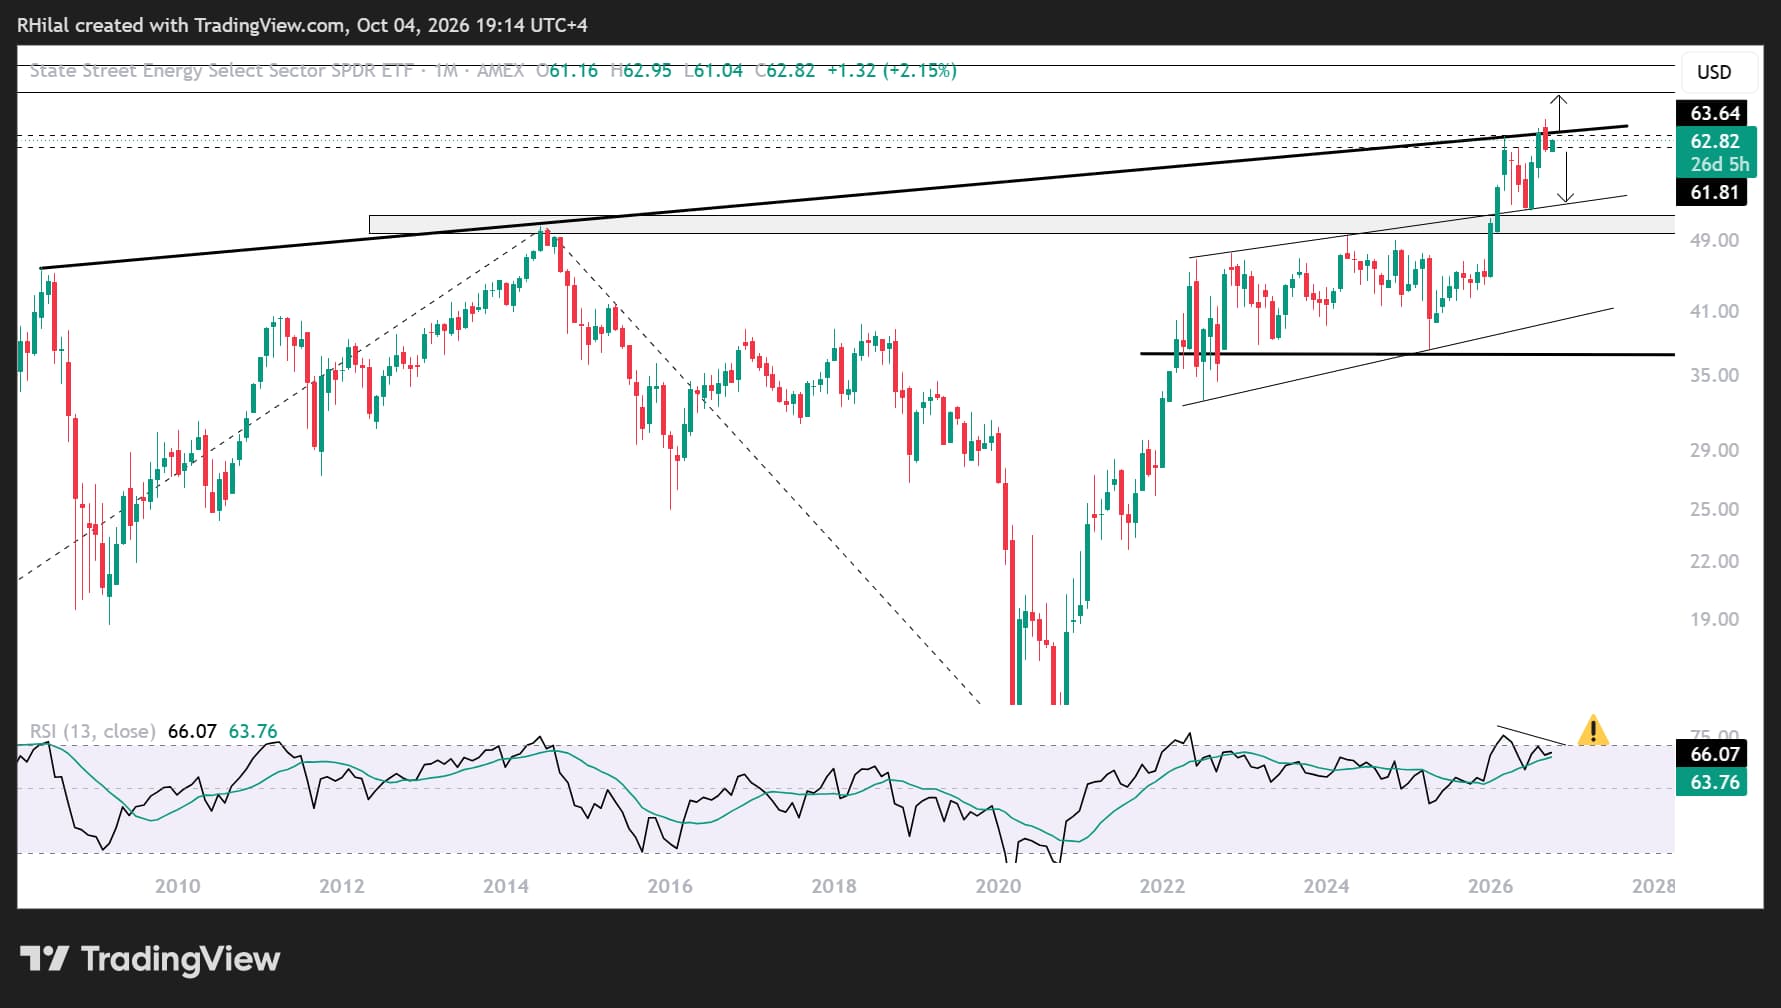
XLE Weekly Outlook: Monthly Time Frame, Log Scale
Source: TradingView
Finally, the XLE chart offers an equity-sector perspective. The pullback below 18-year resistance, which extends from 2008 to 2026, combined with diverging and overbought conditions on the monthly RSI at levels last seen in 1980, points to the risk of a bearish reversal. That risk would be confirmed by a breakdown below 61 and challenged by a recovery above 64 and 66.
Current bias: Bearish
Written by Razan Hilal, CMT
Follow on X: @Rh_waves