
As we move into the second half of April, a key development in the price action of major cryptocurrencies has been the rebound in the bullish bias, which has stabilized in the short term since last week.
Renewed market confidence has driven consistent buying, pushing the crypto market to levels not seen in several weeks. Bitcoin, as the benchmark cryptocurrency, has managed to break above the 75k level, which had previously acted as a key resistance, and has started to build a more consistent bullish structure.
If this dynamic continues, it is likely that buying pressure will remain relevant in market movements over the coming sessions.

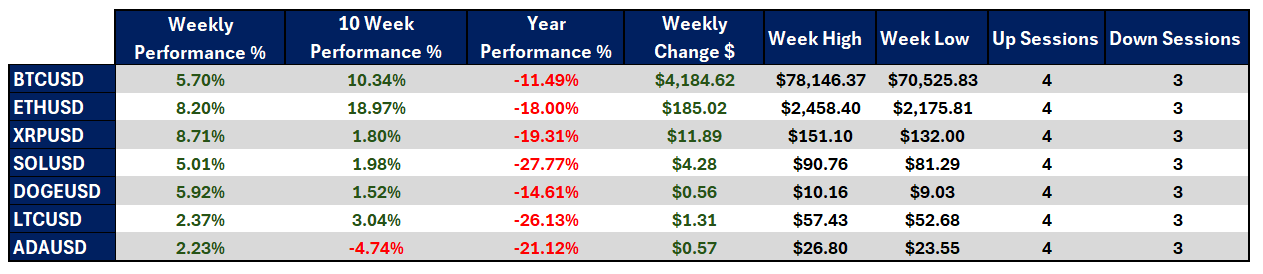
Performance of major cryptocurrencies
Source: Data - StoneX, Tradingview
- The best-performing cryptocurrency of the week has been Ripple, posting a gain of 8.71%, standing out as the strongest asset in the short term. Meanwhile, Cardano also remains in positive territory, although with a more modest gain of 2.23%, reflecting a lower ability to keep pace with the broader market momentum. Overall, the week has been positive for the crypto market, with price action reflecting a consistent recovery and the formation of new relevant levels in the short term.
- Looking at the past ten weeks, the market is finally trading above previous closing levels, indicating that the medium-term bias has begun to improve. Ethereum stands out with a gain of around 18.97% relative to those levels, while Cardano continues to lag with a variation of -4.74%.
- However, on a year-to-date basis, the market remains in negative territory, suggesting that the current recovery has not yet been strong enough to fully reverse earlier losses. Solana continues to be one of the most affected assets, with a decline of approximately -27.77%, while Bitcoin shows greater stability with a variation of -11.49% relative to its yearly opening levels.
- Bitcoin, as the market benchmark, continues to show significant volatility, with price movements exceeding $4,000 during the week, and the recent break above the 75k level confirms that buying pressure has once again become relevant in the short term.
- Overall, the market is showing a clear recovery, although it is important to highlight that the strongest movements are concentrated in specific cryptocurrencies rather than across the entire market, suggesting a more selective participation from investors.
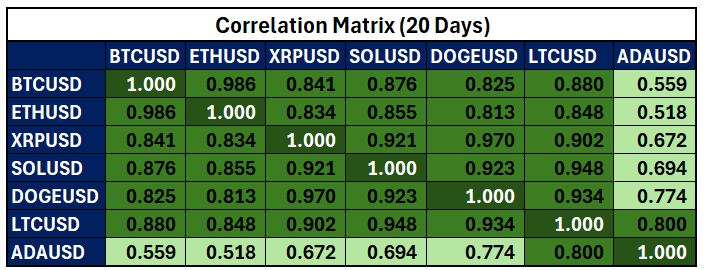
Colors from red to green – Red for negative correlations and green for positive correlations
Source: Data - StoneX, Tradingview
From a correlation standpoint, most major cryptocurrencies have once again begun to show a strong positive correlation with Bitcoin, remaining above levels of 0.8, which reflects a high degree of alignment in recent price movements. Correlation coefficients may change over time.
Cardano remains the exception, with a correlation closer to 0.5, indicating that although a relationship exists, its price action has not been fully aligned with Bitcoin’s recent momentum.
This behavior suggests that the bullish bias is being more broadly transmitted across the market, led by Bitcoin, and if this correlation persists, it is likely that risk appetite will continue to play a key role in the short term.
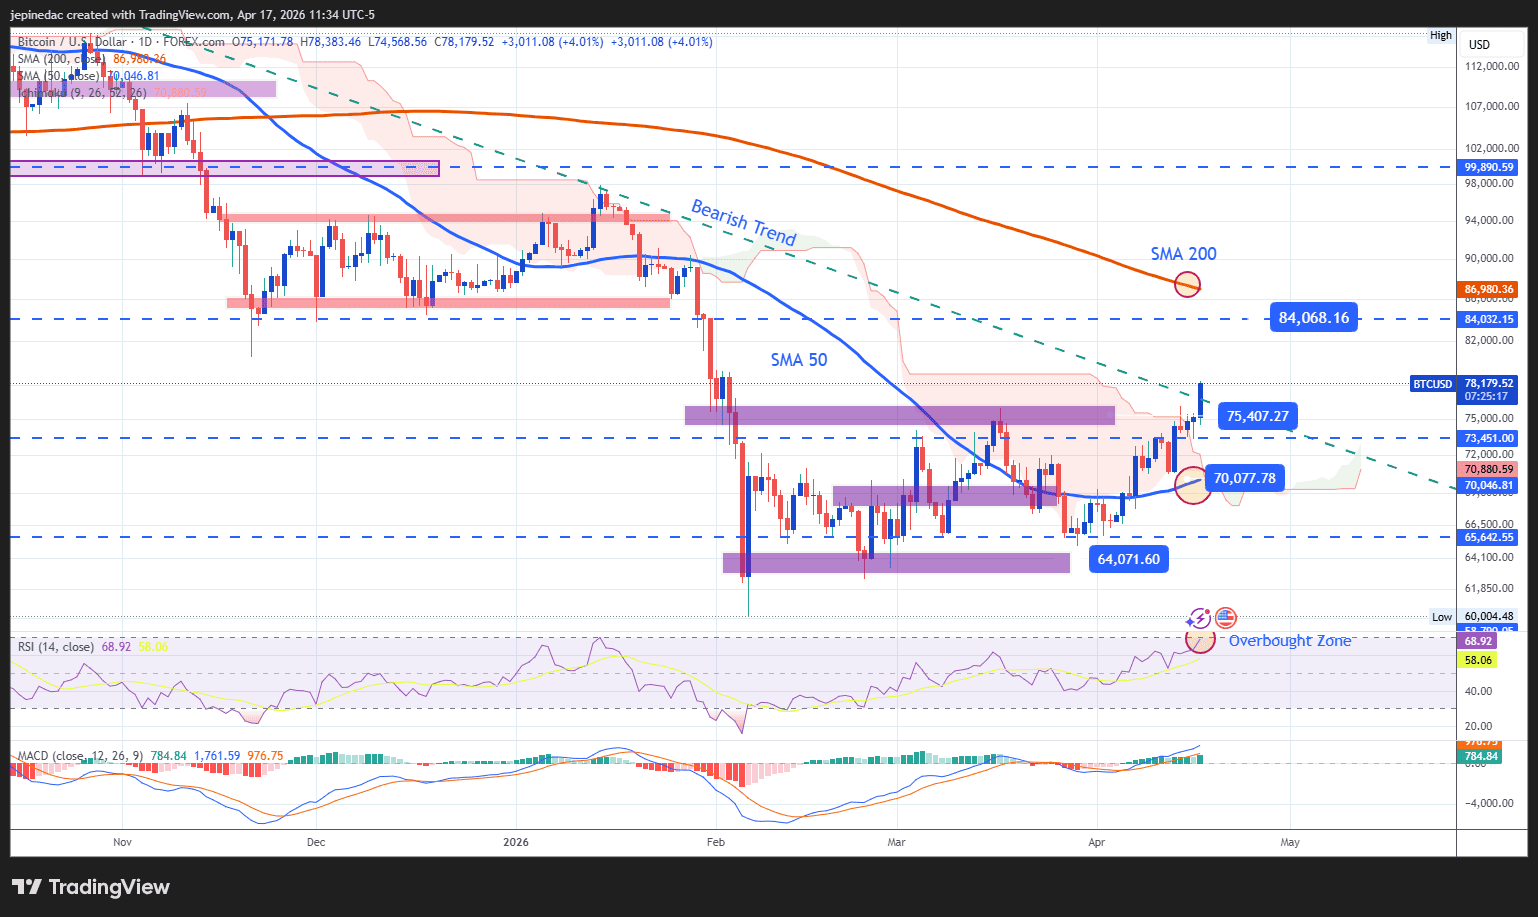
Bitcoin challenges the long-term downtrend
Source: StoneX, Tradingview
It is important to note that Bitcoin still maintains a long-term downward trendline that has been in place for several months. However, the recent price rebound has brought the asset closer to a potential breakout of this structure. If buying pressure continues to build consistently, this could lead to a structural shift in the chart, paving the way for the formation of a new upward trend in the coming sessions.
Indicators:
- The MACD indicator maintains a histogram above the zero line, confirming that short-term moving average momentum remains in bullish territory. Meanwhile, the RSI has shown a significant increase, approaching the overbought zone (70), which could indicate a potential imbalance in market forces and open the door to short-term corrections.
Key levels:
- 84,000 USD – Key resistance: A major resistance zone aligned with previous highs and close to the 200-period moving average. A break above this level could reinforce the bullish bias and support the formation of a more structured uptrend.
- 75,000 USD – Near-term barrier: A level that previously acted as a key resistance. It now becomes an important area to monitor in case of short-term pullbacks.
- 70,000 USD – Key support: A level aligned with the 50-period moving average. Price movements toward this zone could weaken the current bullish bias and lead to a phase of indecision in the short term.
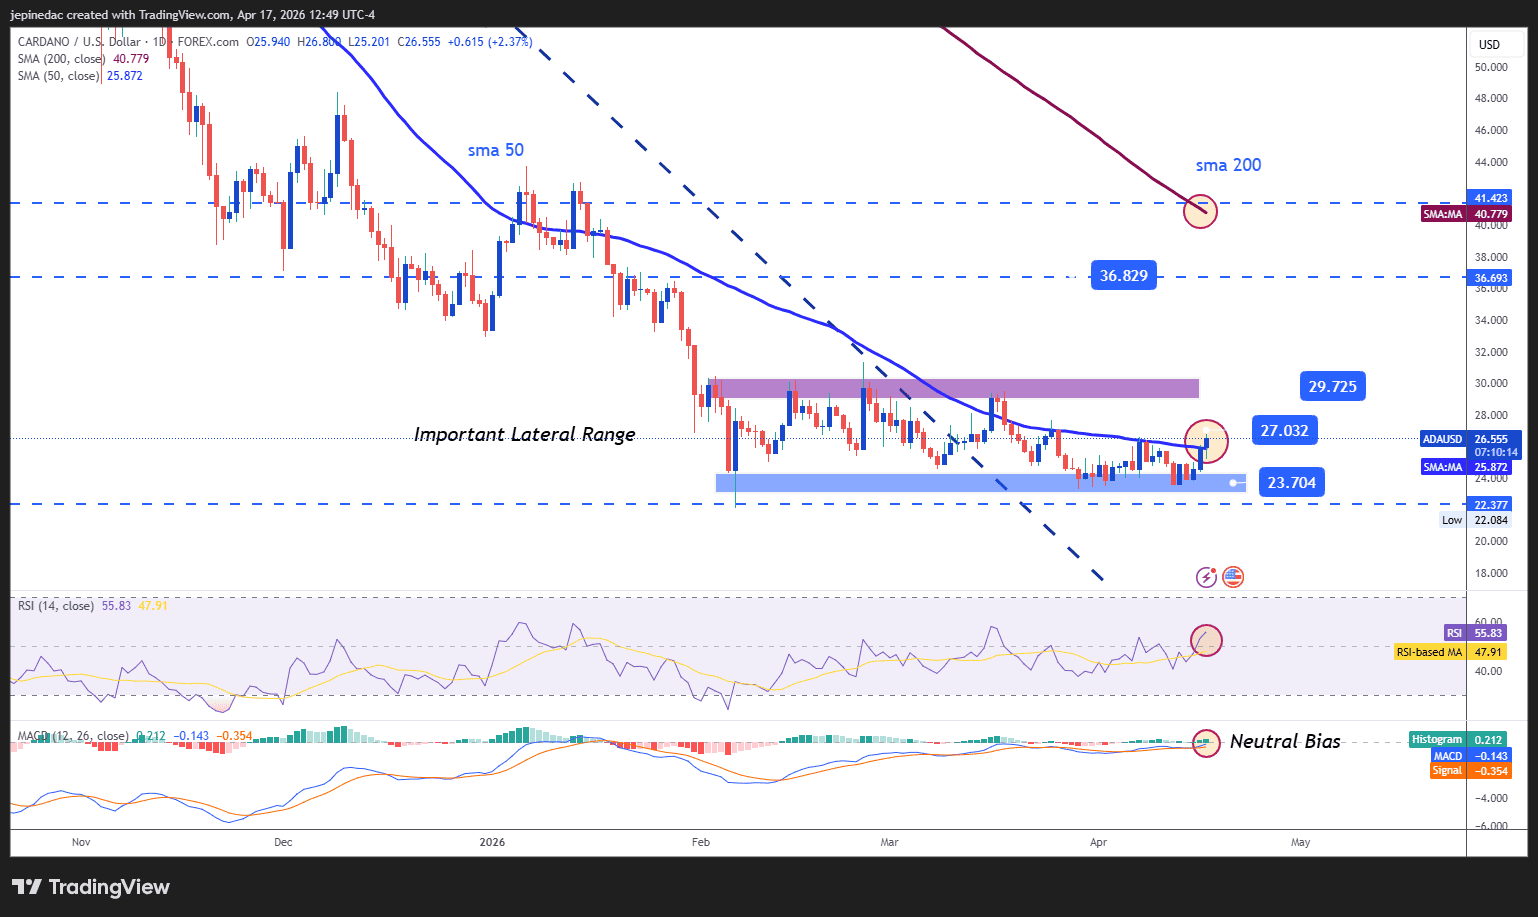
Cardano remains stuck in a range
Source: StoneX, Tradingview
Although Cardano has managed to close the week in positive territory, buying pressure has not yet been strong enough to break the sideways range that dominates its short-term price action. As long as price remains within this structure, it will be difficult to see a more defined directional move.
Indicators:
- Both RSI and MACD remain close to their neutral levels, reflecting a balance in market forces. This suggests that, rather than a clear trend, the market is currently experiencing a phase of indecision.
Key levels:
- 29.72 – Key resistance: The upper boundary of the current range. A breakout above this level could trigger a more relevant bullish bias.
- 27.03 – Near-term barrier: A mid-range level aligned with the 50-period moving average. Price action around this area could continue to reinforce the sideways structure.
- 23.70 – Key support: A level aligned with recent lows. A move toward this zone could bring renewed focus to the underlying bearish trend that remained relevant weeks ago.
Written by Julian Pineda, CFA, CMT – Market Analyst
Follow him on: @julianpineda25