


The Dow Jones Index closed the week with a decline of more than 2.2% in the short term, as selling pressure remains dominant amid a rising sense of market risk. Recent comments from President Donald Trump about a potential reactivation of the trade war with China have started to erode investor confidence, triggering a steady wave of selling in the index. As this risk sentiment persists, downward pressure may become even more pronounced in the coming sessions.

What Did Trump Say?
During a recent session, President Trump once again addressed the trade situation with China, stating that the Asian nation has been engaging in “immoral economic practices” against the U.S. economy by restricting the export of rare earth minerals, which are essential for the production of chips and electric vehicles. These materials are considered strategic for U.S. industrial growth, and such restrictions have been described as a direct threat to the nation’s manufacturing sector.
In response, Trump warned that new tariffs could soon be imposed on Chinese technology products, although no specific figures were mentioned. It’s worth recalling that in previous disputes, proposed tariffs reached as high as 150%, which had a significant impact on financial markets at the time.
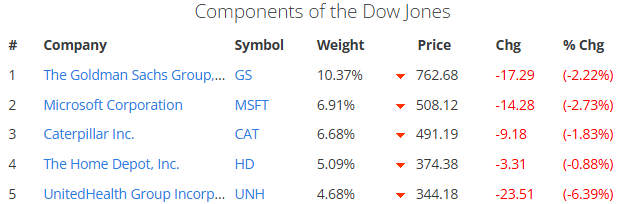
This development has had an immediate impact on recent Dow Jones movements, as investors now fear a renewed wave of trade tensions that could raise production costs and hurt key exports from major companies within the index. The negative sentiment has already been reflected in the performance of several key stocks, including Goldman Sachs, which fell more than 2.22%, Microsoft, which dropped 2.73%, and Caterpillar, which lost nearly 2%. However, the most pronounced decline came from UnitedHealth Group, which plunged more than 6%, not only due to trade tensions but also following Trump’s remarks suggesting a potential review or reform of the federal healthcare system, which could directly impact the company’s business model in the short and medium term.
Source: Slickcharts
Despite early-week optimism driven by new record highs, the shifting fundamental landscape has quickly eroded market confidence. The prospect of a revived trade war coinciding with the year-end season has dampened expectations that major equity indices — including the Dow Jones — will maintain solid demand. If political and economic uncertainty continues to grow, selling pressure is likely to remain dominant in the sessions ahead.
How Is Market Confidence Holding Up?
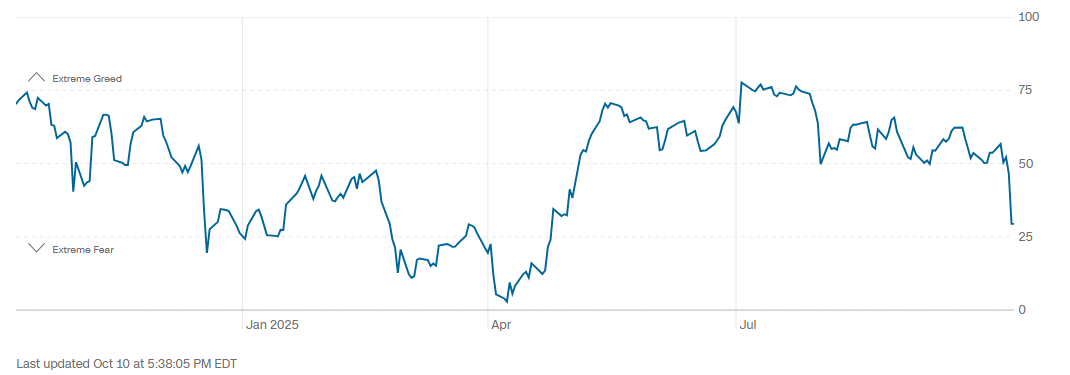
Market confidence appears to be weakening toward the end of the week, largely due to renewed concerns about a possible trade war reactivation. The Fear & Greed Index for financial markets has seen a sharp decline, dropping to 29 points in the short term. This steady downward slope brings the index closer to the “extreme fear” zone, signaling a notable deterioration in investor sentiment.
Source: CNN
As confidence continues to fade, interest in risk assets — such as equity indices — is likely to diminish. Investors may start shifting toward safe-haven assets, reducing capital inflows into stock markets. Consequently, the Dow Jones could face additional selling pressure in the coming trading sessions.
Technical Outlook for the Dow Jones
Source: StoneX, Tradingview
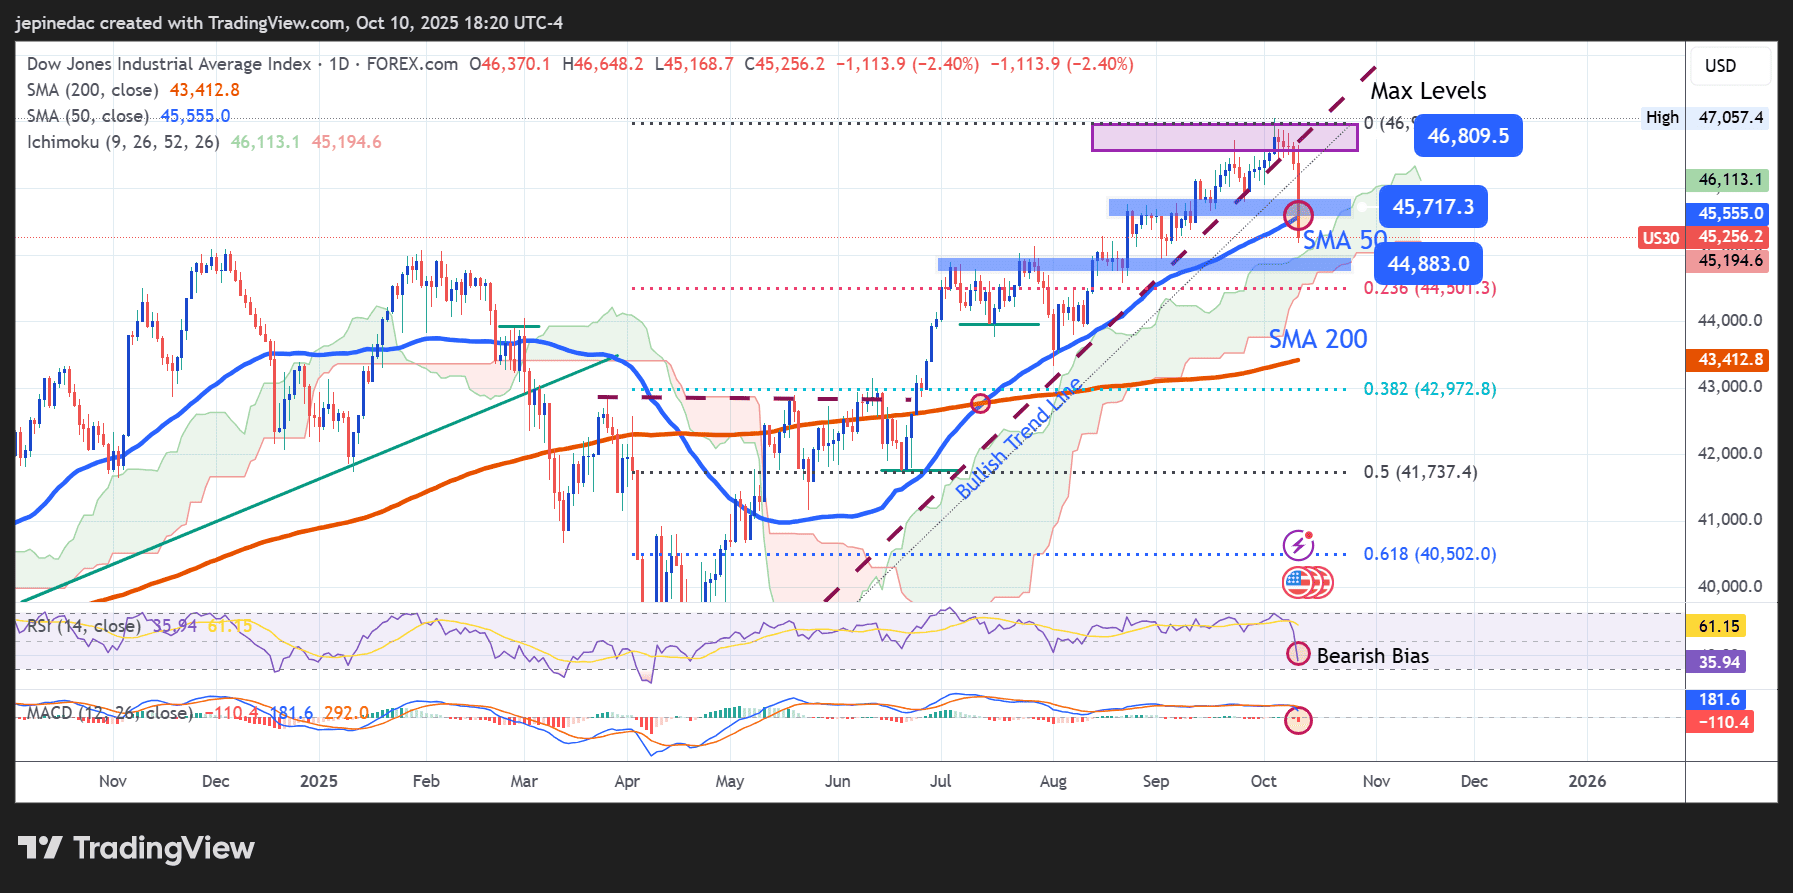
- Uptrend at Risk: In recent weeks, the Dow Jones had maintained a steady upward trend, reaching new all-time highs above 45,000 points. However, the latest bearish movements have introduced a new negative bias, breaking through the existing uptrend line and potentially altering the chart structure. If the price continues to trade below the 50-period moving average, this could confirm a shift toward a short-term bearish scenario.
- RSI: The RSI line has dropped significantly below the 50 level, indicating that the average selling momentum over the past 14 sessions has begun to dominate market behavior. As long as the RSI does not approach the oversold zone (30), downward pressure is likely to remain the prevailing force.
- MACD: The MACD histogram is now oscillating around the neutral line (0), suggesting that the momentum of the moving averages has turned bearish in the short term. If the histogram continues to move further below zero, it would reinforce a stronger bearish bias in the coming sessions.
Key Levels:
- 46,800 points – Major Resistance: Represents the all-time high area for the index. A sustained move above this level could reactivate the previous bullish trend, which is currently under pressure.
- 45,700 points – Current Barrier: Aligns with the 50-period simple moving average. As long as the price remains near this zone, a temporary consolidation phase may occur.
- 44,800 points – Key Support: Corresponds to the Ichimoku cloud area on the short-term chart. A sustained break below this level would confirm the end of the prior uptrend, paving the way for a new short-term downtrend.
Written by Julian Pineda, CFA – Market Analyst
Follow him on: @julianpineda25






